Mechanistic-Empirical Modelling of Flexible Pavement Performance: Verifications Using APT Measurements
Abubeker Worake Ahmed
PUBLIC DEFENCE OF PHD DISSERTATION
As a courtesy of the Royal Institute of Technology, KTH, Stockholm, the public defence of the PhD dissertation will takes place on the 23rd of May 2014 at 13:30 in room Q2, Osquldas väg 10, KTH. The defence will be conducted in English.
External Examiner: Professor Hervè Di Benedetto, University of Lyon, France Supervisor: Professor Sigurdur Erlingsson, KTH, VTI, and University of
Iceland
TRITA-TSC-PHD 14-003 ISBN 978-91-87353-39-0
Mechanistic-Empirical Modelling of Flexible Pavement Performance: Verifications Using APT Measurements
Abubeker Worake Ahmed
Division of Highway and Railway Engineering, Department of Transport Science, Royal Institute of Technology, Stockholm, Sweden
ABSTRACT
Mechanistic-Empirical (M-E) pavement design procedures are composed of a reliable response model to estimate the state of stress in the pavement and distress models in order to predict the different types of pavement distresses due to the prevailing traffic and environmental conditions.
One of the main objectives of this study was to develop a response model based on multilayer elastic theory (MLET) with improved computational performance by optimizing the time consuming parts of the MLET processes. A comprehensive comparison of the developed program with two widely used programs demonstrated excellent agreement and improved computational performance. Moreover, the program was extended to incorporate the viscoelastic behaviour of bituminous materials through elastic-viscoelastic correspondence principle. A procedure based on collocation of linear viscoelastic (LVE) solutions at selected key time durations was also proposed that improved the computational performance for LVE analysis of stationary and moving loads. A comparison of the LVE responses with measurements from accelerated pavement testing (APT) revealed a good agreement.
Furthermore the developed response model was employed to evaluate permanent deformation models for bound and unbound granular materials (UGMs) using full scale APTs. The M-E Pavement Design Guide (MEPDG) model for UGMs and two relatively new models were evaluated to model the permanent deformation in UGMs. Moreover, for bound materials, the simplified form of the MEPDG model for bituminous bound layers was also evaluated. The measured and predicted permanent deformations were in general in good agreement, with only small discrepancies between the models.
Finally, as heavy traffic loading is one of the main factors affecting the performance of flexible pavement, three types of characterizations for heavy traffic axle load spectrum for M-E analysis and design of pavement structures were evaluated. The study recommended an improved approach that enhanced the accuracy and computational performance.
Keywords: Flexible Pavement; Pavement Performance Models; Multilayer Elastic Theory; Linear
Mechanistic-Empirical Modelling of Flexible
Pavement Performance:
Verifications Using
APT Measurements
Abubeker Worake Ahmed
Doctoral Thesis
KTH Royal Institute of Technology
School of Architecture and the Built Environment Department of Transport Science
Division of Highway and Railway Engineering SE-100 44 Stockholm
© Abubeker Worake Ahmed, 2014 Doctoral Thesis
Division of Highway and Railway Engineering Department of Transport Science
TRITA-TSC-PHD 14-003 ISBN 978-91-87353-39-0
Summary
In the last few decades, Mechanistic-Empirical (M-E) pavement design methods have gained considerable interest due to their ability to model the actual pavement characterization. M-E design procedures are primarily composed of a reliable response model to estimate the state of stress in the pavement and distress prediction models in order to predict the different types of pavement distresses due to the prevailing traffic and environmental conditions.
One of the objectives of the study presented here was to develop a response model based on multilayer elastic theory (MLET) with improved computational performance by optimizing the time consuming parts of the MLET processes. The convergence and accuracy of responses in the vicinity of the surface of the top layer were improved using Richardson’s extrapolation. An iterative approach to model stress dependency of unbound granular materials was also incorporated. A comprehensive comparison of the program with two frequently used programs demonstrated excellent agreement and improved computational performance. Moreover, the program was extended to incorporate the viscoelastic nature of bituminous materials the through elastic-viscoelastic correspondence principle. A procedure based on collocation of linear viscoelastic (LVE) solutions at selected key time durations was also proposed that improved the computational performance for LVE analysis of stationary and moving loads. A comparison of the LVE responses with measurements from accelerated pavement testing (APT) revealed good agreement.
The second objective of this study was to evaluate permanent deformation (or rutting) models for bound and unbound granular materials (UGMs). The Mechanistic Empirical Pavement Design Guide (MEPDG) model for UGMs and two relatively new models were evaluated to model the permanent deformation in UGMs. Furthermore, for bound materials, the simplified form of the MEPDG model for bituminous bound layers was also evaluated. A total of three series of full scale accelerated pavement tests (APT) using a heavy vehicle simulator (HVS)
Mechanistic-Empirical Performance Modelling Abubeker W. Ahmed
ii
was used to evaluate the models. In addition, test results from an extra-large wheel tracking (ELWT) device were employed for the purpose of verification of model parameters for bituminous bound layers. The permanent deformation, wheel loading, pavement temperature and other material properties were continuously controlled during the HVS and ELWT tests. Stress dependent behaviour of unbound materials and traffic wandering were also taken into account during the evaluations and a time hardening approach was applied to accumulate the permanent deformation contributions from different stress levels. The measured and predicted permanent deformations were in general in good agreement, with only small discrepancies between the models. Model parameters were also estimated for three different types of unbound granular materials.
Finally, as heavy traffic loading is one of the main factors affecting the performance of flexible pavement, this study evaluated three distinct types of characterizations of heavy traffic axle load spectrum (ALS) for M-E analysis and design of pavement structures. The characterization of the entire ALS using an equivalent number of standard axle loads (ESALs) of 80 kN (US) and 100 kN (Europe) is generally employed in most empirical and few M-E design procedures. The other alternatives are to characterize the entire ALS by Constant Contact Area (CCA) or Constant Contact Pressure (CCP). These characterizations were evaluated based on the predicted rutting and fatigue cracking of several pavement structures subjected to heavy traffic ALS data collected from bridge-weigh-in-motion stations. The results indicated that for layers below the top 25 cm, all characterizations produced similar values of predicted rutting. However, for the top 25 cm, the methods produced significantly different values of predicted rutting and fatigue cracking. Even though the CCP approach is a relatively realistic representation of the actual traffic compared to the ESAL and CCA characterizations, it was shown that the CCP characterization is computationally very expensive. The study proposed an improvement to the CCA approach that enhanced the accuracy while maintaining the same level of computational performance.
Acknowledgements
First and foremost, I would like to express my special gratitude and appreciation to my supervisor Prof. Sigurdur Erlingsson, who created the opportunities for me, and I am honoured and privileged to have been able to work so closely with him. I am indebted to him for his guidance, encouragement and invaluable advice over the years.
I would like to acknowledge the substantial financial support from the Swedish Transport Administration (Trafikverket) and the Swedish National Road and Transport Research Institute (VTI).
I would also like to thank Hassan Hakim, Andreas Waldemarson, Håkan Arvidsson, Tomas Halldin and Henrik Hellman at the Division of Pavement Technology at VTI, who contributed invaluable assistance during the specimen preparation and laboratory testing in the second half of the project.
I would also like to thank my colleagues at the Division of Pavement Technology (väg och banteknik) at VTI. Each of you contributed to making the Division a nice working place. Special thanks to Dr Safwat Said for his fruitful technical discussions and encouragement. My fellow colleagues Farhad Salour, Jonas Wennström and Shafiqur Rahman are also acknowledged for their excellent company and for reviewing my thesis. In addition, I also want to thank my friends Abateneh Yitayew, Markus Svensson (currently working at the Swedish Defence Research Agency FOI), Tariku Mehari (Ericsson) and Tigist Fetene (KTH) for their support and encouragement.
Further, I would like to extend my sincere gratitude to the staff at the VTI for all administrative and other kinds of support that they have provided me over the years.
Finally, I would like to express my special thanks to my mother Jemila Redi, who has always believed in me, her support has been tremendous; words cannot express how grateful I am.
List of Acronyms
AASHTO American Association of State Highway and Transport Officials
ALS Axle Load Spectra
APT Accelerated Pavement Testing
BWIM Bridge Weight-in-Motion
CalME California Mechanistic-Empirical Pavement Design Program
CCA Constant Contact Area
CCP Constant Contact Pressure
ELWT Extra-Large Wheel Tracking
ERAPAVE Elastic Response Analysis of Pavements
ESAL Equivalent Standard Axle Load
FEM Finite Element Method
FWD Falling Weight Deflectometer
HMA Hot Mix Asphalt
HVS Heavy Vehicle Simulator
LVE Linear Viscoelastic
M-E Mechanistic–Empirical
MEPDG Mechanistic-Empirical Pavement Design Guide
MLET Multilayer Elastic Theory
PEDRO Permanent Deformation of asphalt for Roads
PMS Pavement Management System
STA Swedish Transport Administration
UGMs Unbound Granular Materials
VEROAD Viscoelastic Road Analysis Delft
VTI Swedish National Road and Transport Research Institute
Table of Contents
Summary ... i
Acknowledgements ... iii
List of Acronyms ... v
Table of Contents ... vii
List of Publications ... ix
1. Introduction ... 1
1.1. Distresses in Pavements ... 2
1.2. Use of Distress Models in Pavement Management System ... 5
1.3. Objectives and Scope of the Research ... 6
2. Pavement Performance Modelling ... 9
2.1. Response Model for M-E Design Procedures ... 9
2.2. Performance Modelling of Unbound Granular Materials ... 13
2.3. Modelling Permanent Deformation in UGMs ... 17
2.4. Performance of Asphalt Bound Materials ... 19
2.5. Modelling Permanent Deformation in Asphalt Mixtures ... 21
2.6. Characterization of Traffic ... 22
2.7. Time Hardening Procedure ... 26
3. Test Equipment, Structures and Materials ... 29
3.1. Full Scale Accelerated Pavement Tests ... 29
3.2. Extra-Large Wheel Tracking Tests ... 31
4. Response Models for Flexible Pavements ... 33
4.1. Multi-Layer Elastic Theory ... 33
4.2. Linear Viscoelastic Theory ... 36
5. Evaluation of Permanent Deformation Models ... 39
5.1. Permanent Deformation Models for UGMs ... 39
5.2. Permanent Deformation Model for Bituminous Bound Layers ... 41
Mechanistic-Empirical Performance Modelling Abubeker W. Ahmed
viii
7. Conclusions and Recommendations ... 47
7.1. Response Model ... 47
7.2. Permanent Deformation Models ... 48
7.3. Heavy Vehicle Characterization ... 49
7.4. Limitations and Recommendations for Future Studies... 49
List of Publications
Paper I
Erlingsson, S., and Ahmed, A. W., 2013. Fast layered elastic response program for the analysis of flexible pavement structures, Road Materials and Pavement Design, 14(1), pp. 196-210, DOI: 10.1080/14680629.2012.757558.The author of this thesis carried out the development of theory, the programming, and was involved in the write-up.
Paper II
Ahmed, A. W., and Erlingsson, S., 2013. Evaluation of permanent deformation models for unbound granular materials using accelerated pavement tests, Road Materials and Pavement Design, 14(1), pp. 178-195, DOI: 10.1080/14680629.2012.755936.The author of this thesis carried out the analysis of the data, the development of theory and the write-up.
Paper III
Ahmed A. W., and Erlingsson, S., 2012. Modeling of flexiblepavement structure behaviour–Comparisons with HVS
measurements In D. Jones, J. Harvey, A. Mateos, and I. Al-Qadi, (Eds). Advances in Pavement Design through Full-scale Accelerated Pavement Testing, pp. 493-503, New York: CRC Press.
The author of this thesis analysed the data, carried out the development of theory and the write-up.
Paper IV
Ahmed, A. W., and Erlingsson, S., 2013. Characterization of heavy traffic axle load spectra for mechanistic-empirical pavement design applications. Accepted for publication in International Journal of Pavement Engineering.The author of this thesis carried out the data analysis, the development of theory and the write-up.
Paper V
Ahmed, A. W., and Erlingsson, S., 2014. Viscoelastic modelling of pavement structure behaviour in a full scale accelerated pavement test. Submitted to International Journal of Pavement Engineering. The author of this thesis carried out the analysis of the data, the implementation of the viscoelastic approach used and the write-up.Paper VI
Ahmed A. W., and Erlingsson, S., 2014. Evaluation of a permanent deformation model for asphalt concrete mixtures using extra-large wheel tracking and heavy vehicle simulator tests. Submitted to Road Materials and Pavement Design.The author of this thesis carried out the ELWT tests, performed the analysis of data from both the ELWT and HVS tests, and was involved in the write-up.
1. Introduction
Flexible pavement flexes or deforms when subjected to wheel loads. A flexible pavement is typically constructed of several layers of materials, traditionally with the stiffer layers (usually made of asphalt materials) placed at the top and weaker layers at the bottom. The major functions of flexible pavements are, among others, to distribute the traffic loading in order to protect the subgrade from excessive stress and to provide a better ride quality.
When subjected to excessive traffic loading and/or severe climatic condition, pavements start to deteriorate and as a result the performance of pavement starts to decline, which in turn affects the safety of road users.
Permanent deformation on the pavement surface along the wheel path, usually referred to as rutting, is one of the major deteriorations that affect the ride quality as well as safety of road users by leading to hydroplaning, which decreases the skid resistance of the surface and eventually makes steering difficult as the rutting increases in depth.
Pavements are designed using either the pure empirical or Mechanistic-Empirical (M-E) procedures. The empirical procedures developed from the 1950 road test by the American Association of State Highway and Transport Officials (AASHTO) are the basis for most existing empirical design procedures in use worldwide. However these procedures are subjected to growing uncertainties due to the fact that today’s pavement design data exceed the data used in the 1950s AASHTO road test. In addition, these procedures have no mechanistic basis to verify that the stresses, strains or deformations which are induced due to traffic loads and environmental conditions are within the allowable limits.
The M-E design philosophy, on the other hand, applies a more realistic characterization of pavement structures and the related variables. The responses (stresses and strains) in the pavement due to traffic loading, and prevailing environmental conditions are calculated using a response model. Distresses are
Mechanistic-Empirical Performance Modelling Abubeker W. Ahmed
2
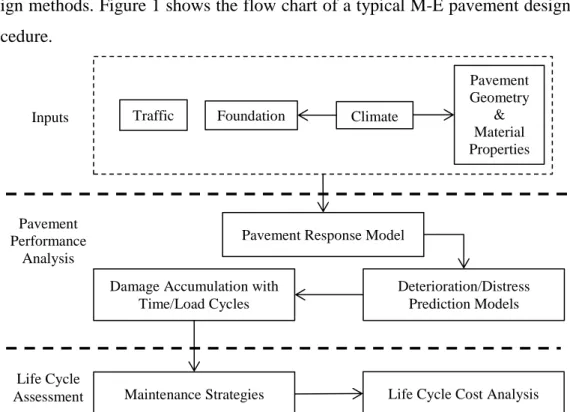
then predicted using M-E distress (performance) prediction models which empirically relate the pavement performance to the pavement responses, traffic volume and the environment. Finally the M-E procedure attempts to limit the distresses or damage to pavement within the desirable tolerances. Therefore the response model and performance prediction models are vital to M-E pavement design methods. Figure 1 shows the flow chart of a typical M-E pavement design procedure.
Figure 1. Flow chart for Mechanistic - Empirical pavement design procedure.
1.1. Distresses in Pavements
Pavements are built to provide safe and good ride quality for road users. The safety and ride quality are affected due to different types of distresses during the service life of the pavements. A more detailed description of different types of distresses can be found in textbooks such as Huang (2004) or in handbooks of highway engineering. The subsequent sections present the two distress modes that most M-E design procedures attempt to control.
1.1.1. Permanent deformation
Permanent deformation of the surface of the pavement along the wheel path, also referred to as rutting, is a gradual accumulation of small unrecoverable
Foundation Climate Pavement Geometry & Material Properties Traffic
Pavement Response Model
Deterioration/Distress Prediction Models Damage Accumulation with
Time/Load Cycles
Maintenance Strategies Pavement
Performance Analysis
Life Cycle Cost Analysis Inputs
Life Cycle Assessment
deformations, in both bound and unbound granular pavement layers, as a result of applied traffic load (Huang, 2004; Sousa et al., 1991). Rutting occurs when the pavement layers consolidate (or change in volume) due to traffic loading. Rutting may also have associated transverse displacement due to shear failure (FHWA, 2003).
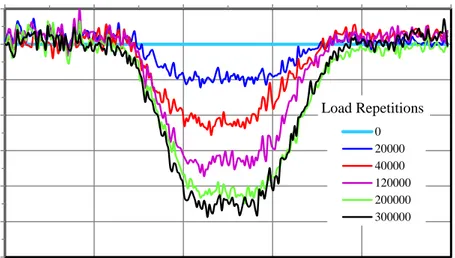
Some of the causes of rutting, among others, are an unstable asphalt layer and densification of the asphalt layer due to inadequate compaction during construction. Rutting is considered as a load related or structural distress and is included as a failure criterion in most M-E pavement design procedures. Figure 2 presents the profile of a tested pavement structure after several load passes were carried out using a Heavy Vehicle Simulator (HVS) testing (Wiman, 2006). The figure demonstrates that as the number of load passes increased, the rutting increased.
Figure 2. Rut measurements from HVS Testing. 1.1.2. Fatigue cracking
Fatigue cracking is a series of longitudinal and interconnected cracks caused by repeated application of tensile strains due to the traffic load. These tensile strains are usually below the tensile strength of the material.
Fatigue cracking may be initiated at the bottom (bottom-up cracking) of an asphalt layer or stabilized base where tensile stress or strain becomes highest following traffic loading (Mobasher et al., 1997; Huang, 2004). These
-6 -5 -4 -3 -2 -1 0 1 0 500 1000 1500 2000 2500 P erma ne nt de for mation [ mm ] Distance [mm] 0 20000 40000 120000 200000 300000 Load Repetitions
Mechanistic-Empirical Performance Modelling Abubeker W. Ahmed
4
microscopic cracks propagate through the material to the top of the layer and form one or more longitudinal wheel path cracks which, after repeated application of loading, interconnect with each other and form cracks with a pattern like the skin of an alligator (Huang, 2004). It is also observed that fatigue cracking may be initiated at or near the surface of the pavement and propagate downward (top-down cracking), which commonly occurs in hot mix asphalt pavements (Wang et al., 2003; Wang et al., 2007).
Fatigue cracking, in general, is described as a two-phase process, initiation followed by propagation. The initiation phase of fatigue cracking on the surface is characterized by microcracks that are instigated in places where high cyclic shear or tensile stress occurs (Daniel et al, 2001). The mechanism of top-down cracking is very complicated; however, Wang el al. (2003) indicated that both tensile-type and shear-type cracking may initiate top-down cracking. Once the crack initiation develops and starts to propagate, further loading may lead to the propagation phase which is characterized by macrocracks. Fatigue cracking occurs mostly in areas which are subjected to repeated traffic loading. Therefore fatigue cracking is considered as a structural (load related) distress and it is incorporated in most M-E pavement design methods.
1.1.3. Modelling distresses in pavements
In pavement structures, it is believed that each passage of traffic load contributes a certain amount of damage to the pavement that gradually accumulates over time and eventually leads to pavement failure. Therefore pavements are designed to span a specific amount of design life, after which the pavement is assumed to be no longer serviceable.
The prediction of pavement life for rutting and fatigue cracking was first introduced by Shell’s pavement design method (Dorman, 1962; Sousa et al., 1991; Huang, 2004). The damage calculation is performed according to Miner’s law where failure due to the combined loading occurs when:
Y i S j i j j i R N n D 1 1 , , (1)where DR, 0 ≤ DR ≤ 1 is the damage ration; Y denotes the analysis period; S is the
number of seasons per year; ni,j is the number of applied load cycles and Ni,j is the
number of load cycles to failure. If DR > 1, the pavement has reached its ultimate
carrying capacity and can no longer be serviceable.
Miner’s law is used to predict the life of a pavement with respect to both rutting and fatigue cracking and it is implemented for pavement damage calculation in several pavement analyses and design programs such as KENPAVE (Huang, 2004).
Barksdal (1972) presented an approach to predict the rutting in pavement layers. The method involves dividing the layer into sub-layers and the permanent strain at the mid-points of the sub-layers is then used to estimate the total pavement rutting by summing up the contribution to rutting from each layer or sub-layer as shown in Equation (2).
n i i i p p p z dz z 1 , 0 (2)where εp,i denotes permanent strain in sublayer i calculated from M-E
performance prediction model (permanent strain model); Δzi is the thickness of the
ith layer or sub-layer; n is the total number of sub-layers and δp is the rut depth.
1.2. Use of Distress Models in Pavement Management System
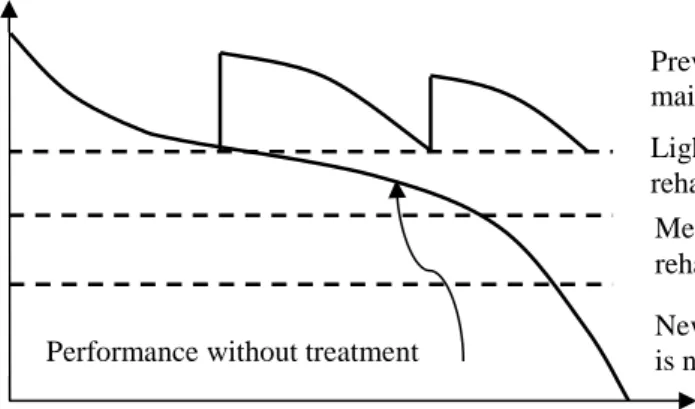
The pavement management system (PMS) involves a set of techniques for monitoring, collecting, analysing and providing post-construction conditions of pavements so as to assist decision makers in selecting efficient and cost-effective maintenance strategies or intervention level (Haas et al., 1994). Therefore evaluation or prediction of the performance of new or in-service pavements is an essential part of PMS in order to determine the best possible cost-effective maintenance alternatives. PMS usually involves rigorous computations of life cycle cost analyses of several alternatives, thus leading to high- performance M-E performance prediction procedures. Figure 3 illustrates a typical performance curve and the possible intervention levels depending on the predicted performance.
Mechanistic-Empirical Performance Modelling Abubeker W. Ahmed
6
Distress models have also gained importance in performance-based contracts for pavement maintenance and rehabilitation projects. This is due to the fact that performance-based contracts specify the desired levels of pavement performances or fundamental engineering properties. Therefore distress prediction models provide an objective means to assist contractors to achieve a structural design that fulfils the required levels of pavement performance (Pidwerbesky, 2004).
Figure 3. Pavement conditions and intervention levels for pavement management system (Huang, 2004).
1.3. Objectives and Scope of the Research
The main objective of this research project was to develop an M-E performance prediction procedure or framework which adequately predicts the performance of thin asphalt pavements under prevailing traffic and environmental conditions. The tasks included:
1. Developing and evaluating high efficiency response programs based on multi-layer elastic and viscoelastic theories for predicting flexible pavement responses.
2. Evaluation of performance prediction models for rutting in bound and unbound layers using measurements of full scale accelerated pavement testing (APT).
3. Evaluation of different characterizations of heavy vehicle axle load spectra (ALS) for M-E pavement analysis and design applications.
Even though there are several other types of distresses such as thermal and fatigue cracking, the present work mainly concentrated on rutting as it is
Pavement age P ave ment c ondit ion Preventative maintenance Light rehabilitation
Performance without treatment
Medium rehabilitation New construction is necessary
considered the most important distress mode. Furthermore, the framework was designed in such a way that other types of distresses can easily be incorporated in the future.
2. Pavement Performance Modelling
The subsequent sections present a short literature review of the selected works which are deemed essential for M-E performance modelling of flexible pavement structures. The survey focused on the response model for pavement analysis and permanent deformation (rutting) behaviour of unbound granular materials (UGMs) and asphalt mixtures.
2.1. Response Model for M-E Design Procedures
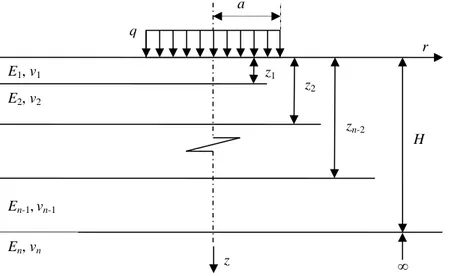
The multilayer elastic theory (MLET), first introduced by Burmister (1943, 1945), is by far the most common response model employed for analysis of layered systems, as shown in Figure 4 (Acum and Fox, 1951; Ahlvin and Ulery, 1962; Jones, 1962; Peattie, 1962; Verstraeten, 1967; Hunag, 1968; Bufler, 1971; Van Cauwelaert and Lequeux, 1986; Maina and Matsui, 2005; Khazanovich and Wang, 2007). Other alternatives for analysis of layered pavement systems include Odemark’s method of equivalent thickness (Ullidtz, 1987) and the 3D finite element method (FEM). The FEM is more comprehensive in its ability to model characteristics of real pavement structures such as a wide variety of nonlinear material behaviour; however it is computationally expensive when compared to the MLET (ARA, 2004). Therefore most M-E pavement design procedures employ the MLET due to its simplicity and computational performance. For instance the US Mechanistic-Empirical Pavement Design Guide (MEPDG)
Mechanistic-Empirical Performance Modelling Abubeker W. Ahmed
10
Figure 4. Layered system subjected to a circular distributed load.
In Figure 4, Ei and vi denote the elastic modulus and Poisson’s ratio of layer i (i =
1, 2,..n); n is the number of layers; zi is the distance from the surface to the bottom
of layer i; H is the distance from the surface to the top of the lowest layer; q is the circular distributed contact pressure and a denotes the contact radius.
2.1.1. Summary of MLET
An axisymmetric solution of a multilayer elastic system as in Figure 4 can be
solved by assuming a stress function that satisfies (Timoshenko and Goodier,
1951):
0
4
(3)
where the Laplace operator 4 for axially symmetrical stress distribution is
defined as: 2 2 2 2 2 2 2 4 1 1 z r r r z r r r (4)
Each of the constituent layers must satisfy Equation (3) and the axisymmetric responses, stresses and displacements can be obtained from (Timoshenko and Goodier, 1951; Maina and Matsui, 2005):
q E2, v2 E1, v1 z H zn-2 z2 z1 En-1,vn-1 En, vn a ∞ r
2 2 2 2 2 2 2 2 3 3 1 0 1 1 2 1 1 ) 1 ( 1 ) 2 ( z r E r r r E E z r r r r z z r z z z z u w rz t r z (5)
in which v and E are the Poisson’s ratio and modulus of elasticity of the material, respectively; and σ, τ, w and u are normal stress, shear stress, vertical
displacement and radial displacement, respectively. The stress function for the
ith layer (i = 1 to n) which satisfies Equation (3) is given by (Huang, 2004):
) ( ) ( ) ( ) ( 2 0 3 1 1 ) ( , i i i i m i m i m i m i i e m D e m C e B e A m m J H z r (6)where ρ = r/H, λ = z/H, λi = zi/H; Ai, Bi, Ci and Di are integration constants for the
ith layer which are obtained from the boundary and continuity condition; J0 is the
Bessel function of the first kind and order 0 and m is the Hankel parameter (Van Cauwelaert, 2003). The integration constants are determined from the solution of
a matrix equation of the form ZX = Y where Z and Y are matrix of 4n-2 4n-2 and
4n-2 1, respectively, which are assembled from the boundary and continuity
conditions; X is a column vector of the unknown integration constants.
Introducing Equation (6) into Equation (5) yields the solution of the layered
system under concentrated load P = -mJ0 (mρ). Therefore the responses due to a
circular distributed load q over radius a can be found by integrating:
0 1( )dm H a m J m S H a q S c (7)where S is the response due to a distributed load of q and Sc is the response due to
a concentrated load of P = -mJ0 (mρ).
The infinite integral in Equation (7) is evaluated using numerical integration (Van Cauwelaert and Lequeux, 1986; Hayhoe, 2002; Huang, 2004; Maina and
Mechanistic-Empirical Performance Modelling Abubeker W. Ahmed
12
Matsui, 2005; Khazanovich and Wang, 2007). The integral in Equation (7) is a time consuming process for M-E pavement design applications where a repeated application of response computation is needed. In addition, for locations close to the surface of the top layer, the convergence of the integral is very slow (Maina and Matsui, 2005; Khazanovich and Wang, 2007). Khazanovich and Wang (2007) thus suggested the use of interpolation and tabulated values of stresses in order to improve the computational performance of MLET. Maina and Matsui (2005) employed Richardson’s extrapolation to improve the convergence of near surface responses.
2.1.2. Extension of MLET for problems involving linear viscoelasticity (LVE) Asphalt mixtures exhibit unique characteristics of both viscous and elastic properties, and hence are categorized as viscoelastic materials. Moreover, understanding the viscoelastic properties of asphalt mixtures is important to achieve performance-based structural design of bituminous layers (ARA, 2004). Therefore it is important to extend the theory of MLET to account for the effect of viscoelasticity. This can be achieved by means of the elastic–viscoelastic correspondence principle which states that the solutions of linear viscoelastic (LVE) problems can be derived from corresponding solutions of linear elastic problems in Laplace space (Chou, 1969; Huang, 2004; Kim, 2011).
The constitutive equation for an LVE material is given, in terms of the convolution integral, as:
d t E t t
0 (8)where (t) is time dependent stress at time t; E(t-) is the modulus as function of
time t; () is the strain and is a dummy variable. The Laplace transform of
Equation (8) yields: s L t L Et d
sE s
s t ˆ ˆ ˆ 0
(9)where L is the Laplace transform operator; s is a complex number; ˆ
s , ˆ
s , and
sEˆ are the stress, the strain and modulus, respectively, expressed in the Laplace
domain.
It is the similarity between Equation (9) and the constitutive equation for linear
elastic problems (i.e., = E) that led to the elastic – viscoelastic correspondence
principle. Therefore Equations (3) to (7) can be employed to solve LVE problems
provided that v and E are replaced with their corresponding Laplace transformsv
and s ˆE respectively.
The LVE solutions described above can also be extended to solve problems involving moving loads through Boltzmann’s superposition. However, this approach is generally time consuming (Huang, 2004; Kim, 2011). Another alternative for analysis of pavement structures subjected to moving load includes the use of a simplified load function, which varies with time, in order to simulate a moving load. For instance, in the VESYS and KENLAYER codes, a haversine function P(t) has been employed. The load function is given by (Papagiannakis et al., 1996; Huang, 2004):
t D A t P 2 sin2 (10)where D = is the duration of the load in sec; a is the contact radius; V is the
speed of the moving load; A is the amplitude and , is the time in sec.
2.2. Performance Modelling of Unbound Granular Materials
Unbound granular materials (UGMs) consist of continuously graded crushed rock or natural aggregates that also contain some amount of fines. The term unbound means that no binding agent such as cement or bitumen is used in UGMs. UGMs in pavement structure are used primarily to transfer the heavy traffic loads from the surface to the underlying subgrade. The resistance to load in UGMs is mainly a result of the aggregate interlock and the internal friction between aggregates, and their performance is affected by several factors presented in the subsequent sections.
Mechanistic-Empirical Performance Modelling Abubeker W. Ahmed
14
2.2.1. State of stresses and stress history of UGMs
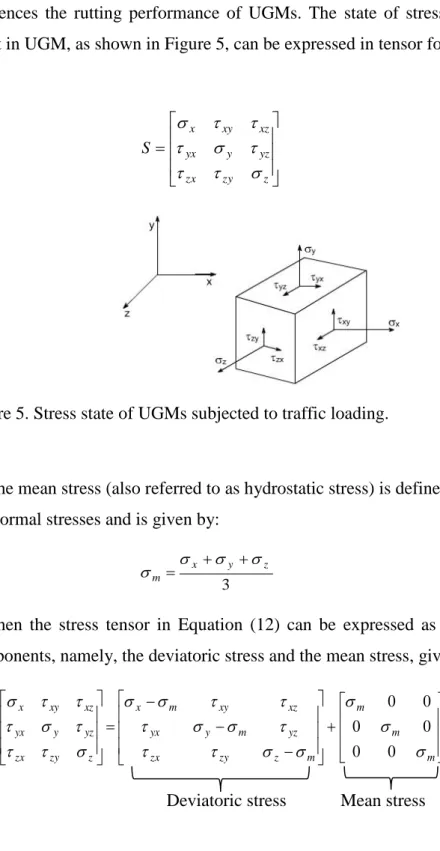
Several studies have indicated that the stress state of UGMs substantially influences the rutting performance of UGMs. The state of stress at an arbitrary point in UGM, as shown in Figure 5, can be expressed in tensor form as:
z zy zx yz y yx xz xy x S (11)
Figure 5. Stress state of UGMs subjected to traffic loading.
The mean stress (also referred to as hydrostatic stress) is defined as the mean of the normal stresses and is given by:
3 z y x m (12)
Then the stress tensor in Equation (12) can be expressed as the sum of two components, namely, the deviatoric stress and the mean stress, given by:
m m m m z zy zx yz m y yx xz xy m x z zy zx yz y yx xz xy x S 0 0 0 0 0 0 (13)
Deviatoric stress Mean stress
The mean stress and the deviatoric stress components are the key to understanding the deformation mechanisms in UGMs. For instance, from repeated
triaxial tests performed on various UGMs, it is reported that the accumulation of permanent strain in UGMs increases when the deviatoric stress increases and decreases when the confining stress increases (Morgan, 1966; Barksdale, 1972; Brown and Hyde, 1975).
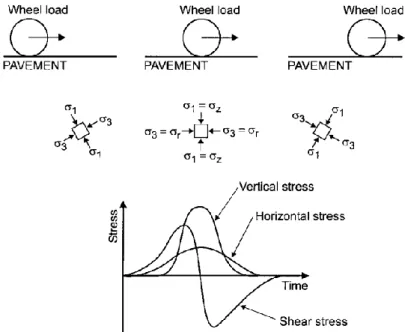
Moreover, the state of stress at a single point in UGMs varies with the position of the wheel, as shown in Figure 6, which leads to shear reversal or the rotation of the principal planes (planes with zero shear stress). To investigate the effect of the shear reversal on the permanent deformation behaviour of UGMs, Chan (1990) conducted a hollow cylindrical test on crushed limestone and a higher permanent strain was observed for load cases with shear reversal.
Figure 6. Stress condition in unbounded granular materials (Lekarp et. al., 1998). In addition to the stress state, the permanent deformation behaviour of UGMs is also affected by the stress history. This is due to the fact that the stiffness of the material gradually increases due to the compaction effect of the repeated loading, resulting in a reduction in permanent deformation for subsequent loadings. Brown and Hyde (1975) reported that the permanent strain resulting from successive increases in stress level is considerably smaller than the permanent strain that occurs due to abrupt loading of higher stress.
Mechanistic-Empirical Performance Modelling Abubeker W. Ahmed
16
Uzan (1985) has shown that the stiffness of UGMs increases as the confinement level increases and has recommended a stress dependent resilient stiffness. One of several forms of stress dependent stiffness is given by ARA (2004): 3 2 1 3 1 k a oct k a m a r p p p k M (14)
where Mr is the resilient stiffness; k1, k2, and k3 are material constants; pa = 100
kPa; m is the mean stress in kPa; oct = √( ) ( ) ( )
is the octahedral shear stress in kPa and 1, 2 and 3 are the principal stresses in
kPa.
2.2.2. Load cycle
Pavement materials are subjected to repeated traffic loading with each passage contributing to a small amount of unrecoverable strain. The permanent deformation in UGMs is therefore a gradual accumulation of these contributions through the service life of the pavement.
Several studies have indicated that the permanent deformation of UGMs is highly influenced by the number of load repetitions (Morgan, 1966; Barksdale, 1972; Sweere, 1990). Paute et al. (1996) concluded that the rate of increase of permanent strain in UGMs under repeated loading decreases constantly to such an extent that it is possible to define a limit value for accumulation of permanent strain. However, Lekarp (1997) and Lekarp and Dawson (1998) reported that stabilization of the accumulation of permanent strain is attained only at a low applied stress level, and at high stresses which are above some threshold value known as the shakedown limit the material experiences a continuous incremental permanent strain and eventually leads to failure. Kolisoja (1998) revealed that the development of permanent deformation is complex and may not be expressed as a simple function, as the materials that seem to be stable at some loading cycle may indicate unpredictable behaviour under further loading.
2.2.3. Moisture content and physical properties
Moisture content in its optimum amount promotes better compaction of the UGMs. However, the actual moisture content in UGMs in pavements varies from time to time due to the ingress of water from the surroundings, depending on the permeability of the material and the drainage conditions. Generally, an increase in moisture content decreases the shear resistance or resistance to permanent deformation (Barksdale, 1972; Thom and Brown, 1988; Lekarp et al., 2000a and 2000b; Erlingsson, 2010b).
Physical properties such as density, degree of compaction, fine contents, grading, aggregate type and aggregate surface conditions also affect the performance to rutting of UGMs. Several studies have indicated that as the density increases the resistance to permanent deformation increases this is particularly true for angular aggregates (Dunlap, 1966; Holubec, 1969; Thom and Brown, 1988; Lekarp et al., 2000a and 2000b).
2.3. Modelling Permanent Deformation in UGMs
As discussed in the previous sections, permanent deformation in UGMs is influenced by a number of factors and several attempts have been made to develop analytical or M-E permanent strain predictive models for UGMs in pavements. A detailed summary of the permanent strain prediction models for UGMs can be found in Lekarp et al. (2000b) and SAMARIS (2004). The subsequent sections present the commonly used and recently developed permanent strain models. 2.3.1. Regression-based permanent deformation models
Regression-based models for permanent deformation in UGMs relate the pavement responses (stresses or strains) with the permanent strain in the UGM layers using empirical equations. These models are usually some function of the stress state, load cycles and material constants. This section presents the Tseng and Lytton (1989), the Gidel et al. (2001) and the Korkiala-Tanttu (2005, 2008)
models. In these models, the permanent strain p is expressed as the product of
two functions as:
f N gp
Mechanistic-Empirical Performance Modelling Abubeker W. Ahmed
18
where g(, ) is some function of pavement responses (stresses or strains) and
f(N) is some function of load repetition N.
The Tseng and Lytton (1989) model, Equation (16), is a function of resilient
strain r and the number of load repetitions N. This model has been implemented
for estimating the permanent strain in base, subbase and subgrade layers in MEPDG (ARA, 2004): r N p e ) ( 0 1 (16)
in which 1 is the laboratory to field correlation factor; ε0, β and ρ are material
parameters.
The model by Gidel et al. (2001), Equation (17), was developed based on repeated multistage triaxial tests conducted on UGMs and is a function of the
maximum deviatoric stress (qmax) and mean stress (pmax).
B n a p N N p q p s m p L 0 1 max max max max 0 1 1 (17)
where 1 is the laboratory to field correlation factor; N0 is the reference number of
load applications (N0 = 100); max2
2 max
max p q
L and pa = 100 kPa; n, B and 0 are
material constants; m = 6(sin/(3 - sin) and s = 6(c)(cos/(3 - sin), where
and c are the angle of internal friction and the cohesion of the material,
respectively; pmax = (1+23)/3, qmax = 1-3, 1, 2 and 3 are the principal
stresses.
In the Korkiala-Tanttu (2005) model, it is presumed that the permanent strain in UGMs is directly proportional to the distance from the state of stress (stress point) to the Mohr-Coulomb failure line expressed in deviatoric stress – mean stress (q-p) space. The permanent strain is then expressed as a hyperbolic function of the deviatoric stress ratio, Equation (18). This model accounts for the effect of the number of load cycles through the log-log approach, as recommended by Sweere (1990). b p N R A R C N 1 ) ( (18)
in which 1 is the laboratory to field correlation factor; C and b are material
constants; A is a parameter independent of the material (A = 1.05) and R is the deviatoric stress ratio given by:
max max max mp s q q q R f (19)
where m, s, qmax, pmax and s are as defined above.
2.3.2. Advanced models
The two most studied advanced group of models used for UGMs are the Elasto-plastic and the Shakedown models. The elasto-Elasto-plastic models apply the concept of plasticity theory to model the cyclic behaviour of UGMs (Bonaquist et al., 1997; Hornych et al., 1998; Desai, 2002).
The shakedown concept employs the fact that if progressive increase in plastic strain (also known as ratcheting) under cyclic loading occurs then the structure will eventually fail. The critical load level below which the structure shakes down (or the plastic strain progressively stabilizes under cyclic loading) and above which ratcheting is instigated is called the shakedown limit. This limiting value is used for estimating the permanent strain in the UGMs (Hornych et al., 2007).
2.4. Performance of Asphalt Bound Materials
The three building blocks of asphalt bound materials (or asphalt mixtures) are aggregate, binder, and air. In dense graded asphalt mixtures the aggregate constitutes around 90% of the mixture volume. Asphalt mixtures are one of the principal components of flexible pavement structure which are used to transfer the heavy traffic loads from the surface to the underlying base and subbase layers and provide a smooth ride when used as a surface layer.
One of the major distresses affecting the ride quality of asphalt pavements is rutting. Rutting in asphalt layers occurs when the pavement under traffic loading consolidates due to compaction. Rutting may also arise due to lateral movement of the hot-mix asphalt (HMA) due to shear failure which generally occurs in the upper portion of the pavement surface. The performance of asphalt mixtures to rutting is affected by several factors which are presented in the following section.
Mechanistic-Empirical Performance Modelling Abubeker W. Ahmed
20
2.4.1. Temperature and binder
The quantity and type of the binders are determinant factors of the performance of an asphalt mixture. Generally a binder content higher than the optimum makes the asphalt layer prone to rutting. On the other hand low binder content decreases workability during construction and makes compaction of the HMA difficult, which in turn leads to excessive air void, thus making the mix vulnerable to rutting. Furthermore, at high pavement temperatures the asphalt binder becomes less viscous. This in turn reduces the stiffness which leads to shear failure.
Some performance tests performed on asphalt mixtures indicated that asphalt mixtures with modified binder might have better resistance to rutting and low temperature susceptibility than unmodified mixtures (Corte et al., 1994; Tayfur et al., 2007; Oscarsson, 2011).
2.4.2. Physical properties
Studies indicated that aggregate selections and gradations play a significant role in the performance of asphalt mixtures. In addition, the shape and texture of the aggregate also influence the performance of the mixture. In general, a rough-textured cubical-shaped aggregate performs better than a smooth, rounded aggregate as it produces a better aggregate interlock. This help decrease the potential for rutting (Matthews and Monismith, 1992).
2.4.3. Other factors
Other factors influencing the performance of asphalt mixtures include traffic load and axle configurations, truck speed, contact pressure and wheel wandering. It is well known that slow moving trucks are more damaging due to the longer duration of loading. Furthermore, truck loading and axle configurations are also important factors. For instance, Corte et al. (1994) reported that axles with wide single wheels, super single wheels, might be more aggressive than dual wheels with respect to rutting resistance. Finally excessive wheel wander may also lead to wider and perhaps deeper ruts in the asphalt layers (Donovan and Tutumluer, 2008).
2.5. Modelling Permanent Deformation in Asphalt Mixtures
Simple M-E analytical and advanced models have been developed in an effort to predict rutting in asphalt mixtures which are discussed in the subsequent sections. 2.5.1. Regression-based models
One of the commonly used regression-based rut predictive models for asphalt layers is the AASHTO model which was developed as a part of the M–E Pavement Design Guide developed under the National Cooperative Highway Research Program (NCHRP). Equation (20) presents the simplified version of the model. This model is a function of pavement temperature, number of load cycles and vertical elastic strain calculated using a response model (ARA, 2004).
r a a p N aT N 2 3 1 1 ) ( (20)
where p is the permanent strain; 1 is a calibration factor; T is the temperature; N
is the load repetitions; a1, a2 and a3 are the regression constants and r is the
vertical elastic strain calculated using a response model.
Other models include the shear based incremental-recursive CalME model which is employed in the M-E design program by the California Department of Transportation (Ullidtz et al., 2006) and the PEDRO model which was developed based on viscoelastic densification and flow (Said et al., 2011). Oscarsson (2011) evaluated the MEPDG, CalME and PEDRO models based on permanent deformation measurements from test pavement structures.
2.5.2. Advanced models
Advanced models for predicting permanent deformation in asphalt mixtures consider the viscous nature of asphalt mixtures through viscoelastic or viscoelastoplastic constitutive equations. Both linear and nonlinear viscoelasticity approaches have been examined. One such example is the linear viscoelastic model employed in the viscoelastic multilayer computer program VEROAD,
viscoelastic road analysis Delft, (Hopman, 1996). However, being
computationally expensive the nonlinear viscoelasticity has gained little usage (Collop et al., 1995).
Mechanistic-Empirical Performance Modelling Abubeker W. Ahmed
22
Collop et al. (1995) used VESYS to predict rutting in asphalt concrete and they reported that there was a good agreement between the measured and the predicted rutting except at the initial stage of the loading. This was attributed to the fact that the initial stage rutting is a result of densification which the theory of viscoelasticity is unable to take into account. Furthermore, research from Shell indicated that utilizing viscoelastic properties of asphalt is not sufficient due to the fact that the influence of the aggregate and its interaction with the asphalt is not
included in viscoelastic modelling (Lijzenga, 1997; Long, 2001).
Viscoelastoplastic models, on the other hand, take into account the influence of aggregate and asphalt-aggregate interaction through elastoplastic components.
2.6. Characterization of Traffic
Traffic is one of the major factors affecting the performance of flexible pavements and it is certainly one of the important parameters in pavement design procedures. In the empirical pavement design procedure which was developed based on the 1950’s AASHTO road test, the mixed traffic is converted into the number of an Equivalent Standard Axle Loads (ESAL) of usually 80kN (US) and 100 kN (Europe). The conversion is made based on empirical relations developed from the AASHTO road test. The conversion of mixed traffic into ESALs depends on several factors such as the pavement type and the distress type under consideration.
As pavement design procedures advance toward a more mechanistic approach, the use of a more detailed traffic count and characterization is inevitable. The subsequent sections present the common traffic counting method and its characterizations.
2.6.1. Weigh-in-motion instruments
Weigh-in-motion (WIM) instruments are installations or attachments on or under the pavement which are used to record the daily, weekly, seasonal and yearly variations of traffic data while the vehicle is in motion (Cebon and Winkler, 1991; Bouteldja et al., 2008).
The bridge weigh-in-motion (BWIM) system, first introduced by Moses (1979), is a WIM system mounted on a concrete bridge. The system consists of extensometers (strain gauges) and a data logger. Strain gauges and extensometers attached to the bottom surface of the bridge slab are used to measure and detect traffic information such as vehicle speed, axle load and configurations, and time. The various recordings are stored in the data logger. It is essential to note that, even though BWIM or WIM instruments provide detailed information regarding traffic characteristics, these instruments do not record other important parameters such as traffic wander pattern, wheel configurations (i.e. single or dual), and contact pressure which are also important for pavement design procedures.
The axle loads and configurations from WIM instruments are usually presented in the form of the axle load spectra (ALS) or frequency distribution of the axle load groups of a given axle configuration (steering, single, tandem, tridem or quad axle). Therefore raw WIM or BWIM data must be analysed to produce the ALS. The analysis of the BWIM data is carried out in two steps; first the data from each axle configuration are grouped into different axle load intervals (load groups). The axle loads may be grouped using a desired load interval or bin width. In MEPDG, for instance, 4.4 kN (1000 lb) for single axle, 8.9 kN (2000 lb) for tandem axle and 13.3 kN (3000 lb) for tridem and quad axle are used (APA, 2004). The frequency distributions for the load groups are then determined in order to produce the ALS.
Few studies have been carried out to characterize the statistics of ALS and their contribution to the pavement deterioration process. Based on the ALS data from the USA, Haider and Harichandran (2009) concluded that fatigue damage is related to the heavy load wings of the ALS while the rutting behaviour is primarily the result of the number of load applications. Similarly, Prozzi and Hong (2006) has shown that the ALS of a given project site can be represented by a mixed lognormal distribution function and it is reported that the performance of the pavement can be predicted by the statistical characteristics of the ALS distribution functions.
Mechanistic-Empirical Performance Modelling Abubeker W. Ahmed
24
2.6.2. Characterization of heavy traffic in a Swedish road network
In 2004, the Swedish Road Administration established a national BWIM network. The BWIM network consists of motorways, arterials or trunk roads as well as one county road and measurements were made during one week every year between 2004 and 2008 (Erlingsson, 2010a; Erlingsson et al., 2010; Winnerholt and Persson, 2010). Erlingsson et al. (2010) analysed the BWIM data to generate ALS of national BWIM sites and studied their characteristics. A time series analysis of these stations for the time period between 2004 and 2008 was also carried out to investigate how the ALS changes over time and to estimate the annual growth rate. Figure 7 shows the ALS for a national BWIM site at Mjölby, South of Stockholm.
Figure 7. ALS of the national BWIM site at Mjölby for the period 2004 – 2008 for a) Steering axles, b) Single axles, c) Tandem axles and d) Tridem axles (Erlingsson, 2010a).
From Figure 7 it can be observed that the distribution of steering axles was fairly normally distributed; this might be attributed to the fact that steering axles are single wheel and the load carried by steering axles, the front compartment of the trucks, is fairly uniform from truck to truck while the load transferred to other axle configurations varies depending on the loading conditions.
0 0 0 1 1 1 1 0 0.2 0.4 0.6 0.8 1 1.2 0 10 20 30 40 0 50 100 150 Axle Weights [kN] Fr e q u e n c y [ % ] 2004 2005 2006 2007 2008 Mean a) 0 5 10 15 0 50 100 150 200 Axle Weights [kN] Fr e q u e n c y [ % ] 2004 2005 2006 2007 2008 Mean b) 0 2 4 6 8 10 0 50 100 150 200 250 300 Axle Weights [kN] Fr e q u e n c y [ % ] 2004 2005 2006 2007 2008 Mean c) 0 2 4 6 8 10 0 50 100 150 200 250 300 350 Axle Weights [kN] Fr e q u e n c y [ % ] 2004 2005 2006 2007 2008 Mean d)
2.6.3. Characterization of heavy traffic ALS for M-E applications
As mentioned in the preceding sections, traffic is one of the key factors influencing the performance of flexible pavements and it is one of the main input parameters for pavement design procedures. Various design procedures adopt different characterizations of the traffic. Most M-E procedures characterize the entire heavy traffic ALS by converting into an equivalent number of standard axles ESALs; thus this standard axle is used for analysis and design of the pavement. This characterization is generally computationally efficient as the analysis of the pavement is performed only for the chosen standard axle. On the other hand, in more comprehensive M-E design procedures such as MEPDG, the entire ALS is used to analyse the pavement. However, these procedures are computationally expensive. Thus, to improve the computational performance, in MEPDG the ALS is characterized by a constant contact area (CCA); in this way, as indicated in Equation (7), response analysis for only one set of axle load-contact pressure combinations is performed. The responses for other axle loads in the ALS are estimated from the linear relation between contact pressure and the response. As reported by Morton et al. (2004), a relatively more accurate characterization for the ALS is to assume a constant contact pressure (CCP) for the entire traffic. However, this characterization requires the analysis of the pavement structure for the entire axle loads in the ALS and therefore computationally inefficient for practical applications.
2.6.4. Heavy traffic lateral wander
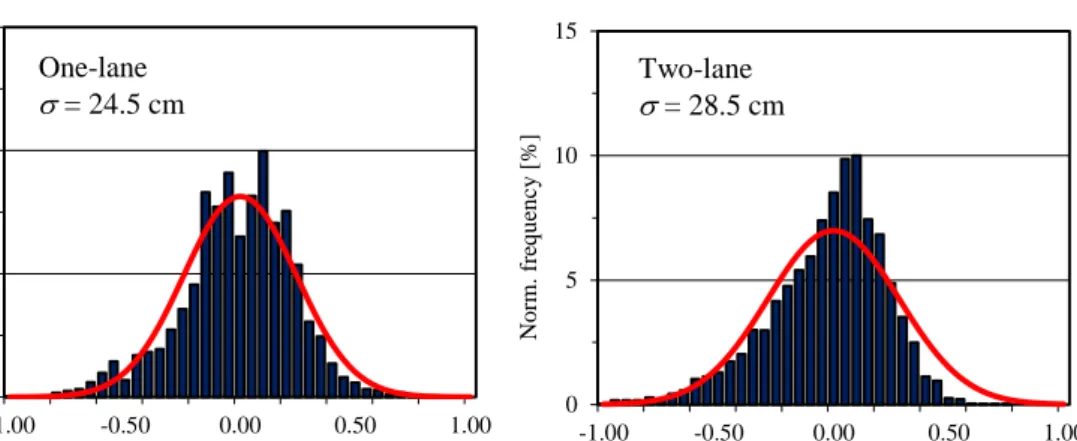
Pavements are subjected to wandering traffic loads that do not follow a straight course or channelized traffic. Several studies have shown that traffic wandering has a significant effect on the development of rutting (Blab and Litzka, 1995; Wu and Harvey, 2008). It is therefore necessary to take the effect of a wandering pattern into account both during testing and modelling of the permanent deformation behaviour of the pavement structures. Studies based on field measurements have indicated that the lateral wander pattern can be modelled as normally distributed (Erlingsson et al., 2012). Figure 8 shows the measured lateral wander distributions of one-lane and two-lane sections of a state road. The
Mechanistic-Empirical Performance Modelling Abubeker W. Ahmed
26
approximate normal distribution curve and its standard deviation of the data are also included in the figure.
Figure 8. Normalized frequency of the lateral positions of the right wheel of heavy vehicles on one-lane and two-lane sections of a state road (Erlingsson et al., 2012).
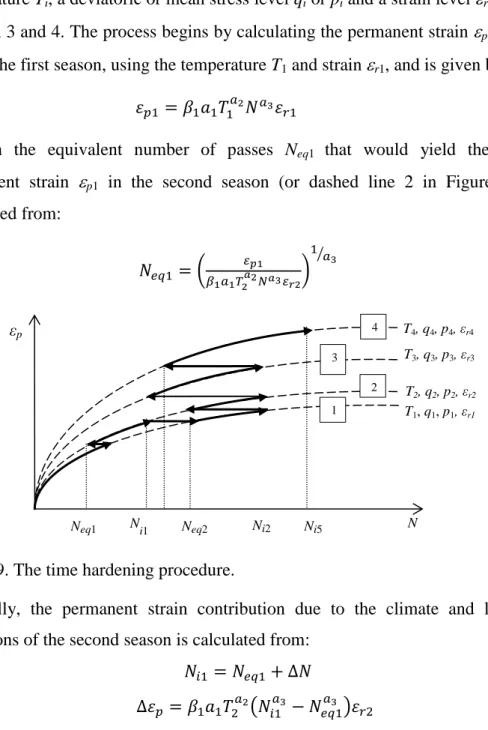
2.7. Time Hardening Procedure
The preceding sections discussed the various factors affecting the rutting performance of bound and unbound pavement materials. Attempts to develop permanent deformation models for pavement materials were also discussed. These models are generally some function of the number of load passes, stress or strain level and pavement temperature. Figure 9 is a graphical representation of these models. The dashed lines in the figure represent the accumulated permanent strain
p as a function of the number of load passes N for a single pavement temperature
Ti, a single deviatoric or mean stress level qi or pi and a single strain level ri,
where i = 1, 2, 3 and 4, denoting the climate and loading conditions of period i. However, pavements in actual field circumstances are subjected to variable climatic and traffic loading conditions (such as ALS or wandering); therefore a procedure must be adopted to combine the permanent strain contributions from different temperature and stress levels.
Lytton et al. (1993) proposed a time hardening procedure to combine the permanent deformation contributions due to various stress levels. To illustrate the procedure, the permanent deformation in the bituminous bound layers, shown in Equation (20), is employed to predict the permanent strain for a time period of
0 5 10 15 -1.00 -0.50 0.00 0.50 1.00 N o rm. fr eq u en cy [ %] Wheel position [m] One-lane = 24.5 cm 0 5 10 15 -1.00 -0.50 0.00 0.50 1.00 N o rm. fr eq u en cy [ %] Wheel position [m] Two-lane = 28.5 cm
four seasons. It is assumed that each season is characterized by a pavement
temperature Ti, a deviatoric or mean stress level qi or pi and a strain level ri where
i = 1, 2, 3 and 4. The process begins by calculating the permanent strain p1 at the
end of the first season, using the temperature T1 and strain r1, and is given by:
(21)
Then the equivalent number of passes Neq1 that would yield the same
permanent strain p1 in the second season (or dashed line 2 in Figure 9) is
calculated from:
( )
⁄
(22)
Figure 9. The time hardening procedure.
Finally, the permanent strain contribution due to the climate and loading conditions of the second season is calculated from:
(23a)
( ) (23b)
where N is the number of applied load repetitions during the second season. The
total permanent strain at the end of the second season is obtained from:
(24)
The above procedures are repeated until the end of the seasons is reached.
Neq1 Neq2 Ni2 Ni5 T1, q1, p1, εr1 T2, q2, p2, εr2 T3, q3, p3, εr3 T4, q4, p4, εr4 εp N 1 2 3 4 N i1
3. Test Equipment, Structures and Materials
3.1. Full Scale Accelerated Pavement Tests
Full Scale APT results were used in this study. The APTs were conducted using an HVS facility at the Swedish National Road and Transport Research Institute, VTI (Wiman and Erlingsson, 2008). Figure 10 shows the HVS facility.
Figure 10. The HVS at the Swedish Road and Transport Research Institute, VTI, Linköping, Sweden.
The HVS is a mobile device employed to study the behaviour of a pavement structure under loading and environmental conditions which are close to actual field conditions. Using the HVS it is possible to apply a single or dual wheel moving load of magnitudes from 30 to 110 kN at speeds up to 12 km/h. Traffic wander is simulated by moving the wheel in the transverse direction. Environmental influences such as pavement temperature and ground water table are controlled through add-on facilities. The responses (stresses and strains in the pavement) in the pavement and permanent deformation measurements are registered using various sensors installed in the test structure.
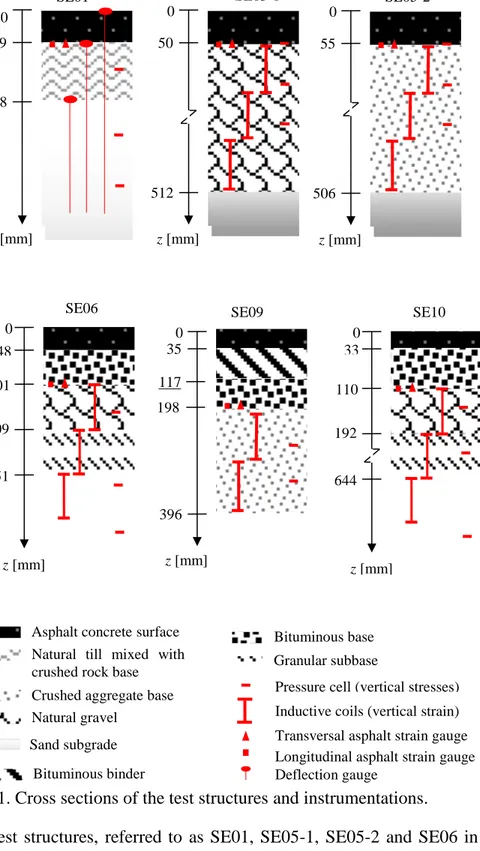
The tests used in this study were conducted on test structures built in a 3 m deep test pit testing facility at VTI (Wiman, 2001, 2006 and 2010). The structures consisted of a thin asphalt surface layer, bituminous bases, UGM base or subbase layer, and a sand subgrade over a rigid bottom. A total of 6 test pavement structures were used. Figure 11 shows the cross sections of the test structures and
Mechanistic-Empirical Performance Modelling Abubeker W. Ahmed
30
their instrumentations.
Figure 11. Cross sections of the test structures and instrumentations.
The test structures, referred to as SE01, SE05-1, SE05-2 and SE06 in Figure 11, were used for evaluation and validation of responses and permanent deformation models for UGMs (Paper II and Paper III) whereas permanent
SE01 0
49
138
z [mm]
Crushed aggregate base Asphalt concrete surface Natural till mixed with crushed rock base Natural gravel Sand subgrade
SE05-1
Pressure cell (vertical stresses) Transversal asphalt strain gauge Longitudinal asphalt strain gauge Inductive coils (vertical strain)
SE05-2 0 55 506 z [mm] 0 50 512 z [mm] Deflection gauge 48 209 101 z [mm] 351 0 SE06 Bituminous base Granular subbase SE09 0 35 396 z [mm] 33 192 110 z [mm] 644 0 SE10 Bituminous binder 117 198