TVE 16 015 maj
Examensarbete 15 hp
Maj 2016
Development and investigation
of a sun-based tariff model for
charging electric vehicles
Mathias Alarcón
Niklas Dahlin
Robin Landau
Samuel Wennlund
Teknisk- naturvetenskaplig fakultet UTH-enheten Besöksadress: Ångströmlaboratoriet Lägerhyddsvägen 1 Hus 4, Plan 0 Postadress: Box 536 751 21 Uppsala Telefon: 018 – 471 30 03 Telefax: 018 – 471 30 00 Hemsida: http://www.teknat.uu.se/student
Abstract
Development and investigation of a sun-based tariff
model for charging electric vehicles
Mathias Alarcón, Niklas Dahlin, Robin Landau, Samuel Wennlund
The purpose of this bachelor thesis is to create an easily understood tariff model suitable for electric vehicle (EV) charging stations connected to solar panels and the power grid, i.e. the sun-based model. The tariff model should give incentives to maximise the self-consumption of the station, i.e. to increase the direct use of the photovoltaic (PV) produced energy. This is done through encouraging the customer to charge at daytime and with low power output.
The presented results show how different types of EVs are affected with the suggested sun-based model, i.e. what their energy price and their price per 10 km becomes. The sensitivity analysis consists of a change in the installed PV capacity. The results show that the proposed model provides advantages for solar-charging, since the best price is offered to the customers who charge in the desired manner. The price is unaffected with the different solar panel sizes, but the profits of the station owners increase with the size. One particular challenge noticed in the model however is that the profit for the station owner increases with lower degrees of self-consumption, which needs to be rectified in future studies prior real-life implementation.
ISSN: 1650-8319, TVE 16 015 maj Examinator: Joakim Widén
Ämnesgranskare: Joakim Munkhammar Handledare: Per Wickman
Table of Contents
1. INTRODUCTION __________________________________________________________ 2 1.1 PURPOSE AND THESIS QUESTIONS _____________________________________________ 3 1.2 LIMITATIONS ___________________________________________________________ 3 1.3 DISPOSITION ___________________________________________________________ 4 2. BACKGROUND ___________________________________________________________ 4 2.1 CHARGING EVS TODAY _____________________________________________________ 4 2.1.1 Existing infrastructure and tariff models for EV charging ____________________ 7 2.2 PV POWER _____________________________________________________________ 8 2.3 THE POWER GRID ________________________________________________________ 9 2.3.1 Power peaks _______________________________________________________ 9 2.3.2 Tariff models from a grid perspective ___________________________________ 9 2.3.3 Guarantees of origin _______________________________________________ 11 3. SYSTEM VIEW ___________________________________________________________ 12 3.1 SOLELIA GREENTECH _____________________________________________________ 12 3.2 THE SELF-CONSUMPTION TODAY _____________________________________________ 13 4. METHODOLOGY _________________________________________________________ 14 4.1 MOTIVATION FOR THE SUN-BASED TARIFF MODEL _________________________________ 15 4.2 SUN-BASED TARIFF MODEL _________________________________________________ 16 4.3 CHARGING PATTERNS _____________________________________________________ 17 4.4 STATION CALCULATIONS ___________________________________________________ 17 4.5 SENSITIVITY ANALYSIS ____________________________________________________ 18 5. DATA __________________________________________________________________ 19 5.1 SOLAR DATA ___________________________________________________________ 19 5.2 ASSUMPTIONS AND ESTIMATIONS ____________________________________________ 20 6. RESULTS _______________________________________________________________ 21 6.1 CUSTOMER ___________________________________________________________ 21 6.2 STATION _____________________________________________________________ 25 6.2.1 Consumed energy _________________________________________________ 25 6.2.2 Self-consumption __________________________________________________ 26 6.2.3 Sold and purchased energy __________________________________________ 27 6.2.4 Economic performance _____________________________________________ 28 6.3 SENSITIVITY ANALYSIS ____________________________________________________ 29 7. DISCUSSION ____________________________________________________________ 32 8. CONCLUSIONS __________________________________________________________ 35 REFERENCES ________________________________________________________________ 36 APPENDIX A - PRICES AND CALCULATIONS _______________________________________ 40 APPENDIX B - MATLAB SCRIPTS ________________________________________________ 421
List of terms and abbreviations in this report.
EV An electric vehicle with solely electric drive.
PHEV A plug-in hybrid electric vehicle, which combines an electric motor with a combustion engine and has a battery of a more significant size that can be charged when plugged into a charger.
PV power Photovoltaic power: electricity produced directly from solar radiation.
kWh Kilowatt hour, a unit for measuring amounts of electric energy. 1 kWh equals the use of 1 kW for one hour.
Rated power The maximum power that is produced or transferred.
The solar station An EV charging station connected to solar panels and the power grid, like the one offered by Solelia Greentech.
Self-consumption The use of locally produced power instantaneously without using the power grid.
Coverage The percentage of time of use for a charging station.
The sun-based tariff The tariff model that is developed within this report. The tariff rewards customers who choose to charge their EVs during daytime with a low power output.
GO Guarantees of origin, an assurance that the produced energy origins from a specific source. The GOs are issued by the Swedish government.
Normal charging Charging with power outputs between 2.3-3.7 kW.
Semi fast charging Charging with power outputs between 3.7-50 kW.
Fast charging Charging with power outputs that exceed 50 kW.
2
1. Introduction
In the Paris COP21 meeting in 2015, an agreement was set to limit the global
temperature increase to below 2 degrees Celsius, due to global warming (C2ES, 2015). In order to achieve this goal, various actions need to be taken. On the same theme, in the “Europe 2020 targets” set in 2010, the European Union states a number of goals to be reached within the community until 2020. Regarding the climate- and clean energy issue, the EU aims to decrease the emissions of greenhouse gases, increase the share of renewable energy sources and improve the energy efficiency (The European
Commission, 2011).
With this in mind, the transformation to renewable energy sources achieves a high priority, especially within the fossil fuel dominated vehicle industry. A third of
Sweden's greenhouse gas emissions originates origins from the transport sector, making it clear that actions are needed to achieve reductions (Swedish Environmental Protection Agency, 2015). Although it is important to increase the efficiency of the fossil fuel driven vehicles, the share of electric vehicles (EVs) in the vehicle fleet needs to
significantly expand in order to substantially decrease the emissions. The reason is that the EV’s cause less greenhouse gas emissions (CEF, 2016) and possess a significantly higher energy efficiency (Fueleconomy, 2016). The number of EVs in Sweden is rapidly increasing, since early 2014 the fleet has expanded with 350 percent to roughly 18,000 EVs and hybrids (Elbilsstatistik, 2016).
Photovoltaic power (PV power) is increasingly used as a source of renewable energy. Between 2010 and 2014, the installed PV power in Sweden increased from 10 MW to 80 MW (Swedish Energy Agency, 2015a). Today 20 percent of the Swedish house owners consider investing in home-produced electricity, making it reasonable to believe that PV power will continue expanding (Svensk Energi, 2014a). Since solar radiation is variable, PV power is considered to be an intermittent power source, which in large quantities causes instabilities to the power grid (Helbrink et al., 2015, summary). However, the PV power is well suited for charging EVs, where the power can be directly stored in the batteries (Wickman and Munkhammar, 2015, p. 3).
Given the increased markets of the EVs and the PV power, new solutions for combining these are emerging. An example of that is the Stockholm based company Solelia
Greentech AB. They have developed charging stations for EVs directly connected to solar panels (the solar station), making it possible in theory to charge vehicles
completely with PV power (Solelia, 2016a). The setup utilises synergy since it provides EVs with “clean” energy, while the PV power developed in the solar panels can be used directly without power grid involvement.
At present time (2016), a common tariff for EV charging when not being free of charge, is the constant commission where the customer pays the same fee regardless of the time of day. For solar charging stations, with the ambition to maximize the direct use of the instantaneous power produced, i.e. the self-consumption, it is preferable if the charging
3
occurs in the same pattern as the PV power is produced. Furthermore, since high power output requires more advanced and expensive installations, there is a benefit in
encouraging customers to charge with low power rates.
1.1 Purpose and thesis questions
The purpose of this project is to develop a tariff model (referred to as the sun-based tariff) that rewards the users who choose to charge their EVs in a manner that increases the self-consumption of the solar station, with a low power output at daytime when the PV production is high. In order to get an idea of how the tariff model affects the customers and station owners, the thesis questions are:
§ How does the sun-based tariff affect the costs of charging EVs at different times?
§ How does the sun-based tariff affect the costs and incomes of the station owner? § How does the degree of self-consumption change with different usage of the
charging station?
1.2 Limitations
The thesis is based upon a number of limitations. Primarily, all solar radiation data is taken from solar panels from roof of the Ångström laboratory in Uppsala. Therefore it is only local data, which possibly could have changed the results if it was to be measured somewhere else. The solar power calculations are not based on solar power data, but from the solar radiation data which is converted to solar power through calculations based on a model of south directed panels with constant efficiency.
For estimating a sun-based tariff, an average of solar irradiance for each hour of day was made.
For calculations with the solar radiation and solar power, an average day was used based on data from a whole year. Even though the solar radiation changes over the year an average day was chosen to create and encourage a habit of charging during the day. This was considered to be more important than using the reality of actual produced solar power for the tariff system.
The price of electricity from the grid is decided to be constant for all calculations. Furthermore, the price will be the same for selling the locally produced power to the grid as well as buying power from the grid.
While the EVs are charging, the charging rates are assumed to be constant, even though it is not the case in reality (which is described in chapter 2.1).
The construction costs of the stations and the material costs of the solar panels are excluded, since the report does not aim towards calculating the repayment. The purpose
4
is solely to estimate how a sun-based tariff affects the costs and incomes of the customers and station owners.
The same constant energy consumption is assumed for all the different vehicles. The consumption otherwise varies slightly between the different models and depends on how they are driven.
In this report all batteries that are described are of the same kind, Lithium-ion batteries, since these are the most commonly used batteries in EVs (Battery University, 2016a).
1.3 Disposition
The report is divided into different sections. It begins with a background section, section 2, where the reader will be introduced to how the charging of EVs are structured today. Existing tariff models for EV charging, an introduction to PV power and the power grid will also be presented. Thereafter the system that the report covers will be presented in section 3. Section 4 will present the model used in the report and section 5 will present the data used in the model. The results of the report and a sensitivity analysis will be presented in section 6 and in section 7 a discussion of the result will be presented along with suggestions for further studies. In section 8, the last section of the report,
conclusions based on the discussion will be presented.
2. Background
The relevant themes and subjects for the purpose of the thesis are presented in the background chapter. Initially, the EV sector and its present charging systems are described, ahead with a selection of relevant tariff models. After a brief introduction to PV power, the Swedish power grid is reviewed, along with aspects applicable to the purpose. The background chapter will give a foundation to the aim of the report: to develop a tariff model suitable with the solar stations.
2.1 Charging EVs today
Today there are three different ways of charging EVs when it comes to power output: normal charging, semi fast charging and fast charging. There are no official limits between the different charging rates but the following are reasonable definitions according to Svensk Energi (2014b, pp 5-7).
Normal charging is the power that can be accessed in households through standard power outputs. That is a one-phase connection of 230 V and 10 A to 16 A, which leads up to a maximum power of 3.7 kW. (Svensk Energi, 2014b, p.5)
5
Semi fast charging covers the range of 3.7 kW up to 50 kW (Svensk Energi, 2014b, p.5). Three phase connection delivers the highest power possible to get into households, which at 16 A reaches up to 11 kW (Svensk Energi, 2013, p.8). Special equipment is needed to reach higher power outputs, which therefore calls for specified charging stations. Semi fast charge is suitable for charging when visiting for instance restaurants, grocery stores and cafés (Emobility, 2016). Figure 1 shows an example of a semi fast charger.
Figure 1: The 22 kW semi fast charging output at the Solelia charging station by the central station in Uppsala, Sweden (Photo by Wennlund, 2016).
Fast charging is suitable when being on a trip and in need of recharging without the time for a longer break. Power at 50 kW and above is considered as fast charging. The two leading systems for fast charging are CCS (Combined Charging System) which is dimensioned for up to 200 kW and CHAdeMO that is dimensioned for up to 120 kW. Though the two concepts have greater capabilities most fast charging stations today give 50 kW (Svensk Energi, 2014b, p.7). This is because of the large costs of installing high power connections to the grid. An exception is the Tesla Supercharger that has a power of 120 kW, although they have their own system that only works for Tesla vehicles (Tesla, 2016a). Fast charging enables users to reach longer distance, for instance at rest areas along highways (Emobility, 2016).
The numbers above are summarized in the following table (table 1). Table 1: Charging types with corresponding power outputs.
Charging type Power
Normal charge ≤ 3.7 kW
Semi fast charge 3.7 kW to 50 kW
Fast charge ≥ 50 kW
The existing EVs and their battery sizes gives a perception of the significances of the different kinds of charging. Typical models that exist on the market today (2016) are
6
Mitsubishi Outlander PHEV, Nissan Leaf and Tesla Model S. These three were chosen since they represent the wide range of different existing electric vehicles today.
Mitsubishi Outlander PHEV is a plug-in hybrid SUV with a 12 kWh battery besides the gas tank for the combustion engine (Mitsubishi Motors, 2016, p.15). Nissan Leaf is a smaller sized all electric vehicle with an option of 24 kWh or 30 kWh battery (Nissan, 2016). The Tesla Model S is an all-electric large sedan that exists with battery capacities between 70 kWh and 90 kWh (Tesla, 2016b).
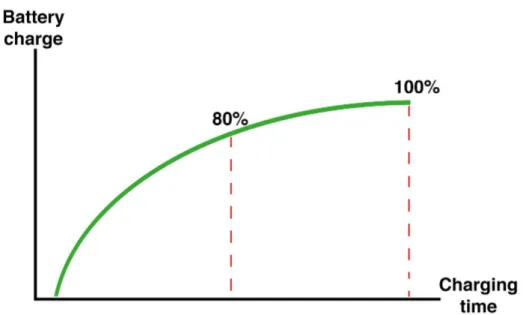
The charging speed for a battery is not constant; it decreases as the battery gets filled up since the internal resistance increases (see figure 2). Because of this, manufacturers of automobiles and charging systems most often refer to the charging time from 0-80 percent of the batteries capacity (Transport evolved, 2014). Also, if the maximum battery capacity is not needed the battery works most effectively between 20-80 percent charge. Keeping the charge amount within that interval also increases the life of the batteries (Battery University, 2016b). Therefore this report will also refer to 0-80 percent when discussing charging rates.
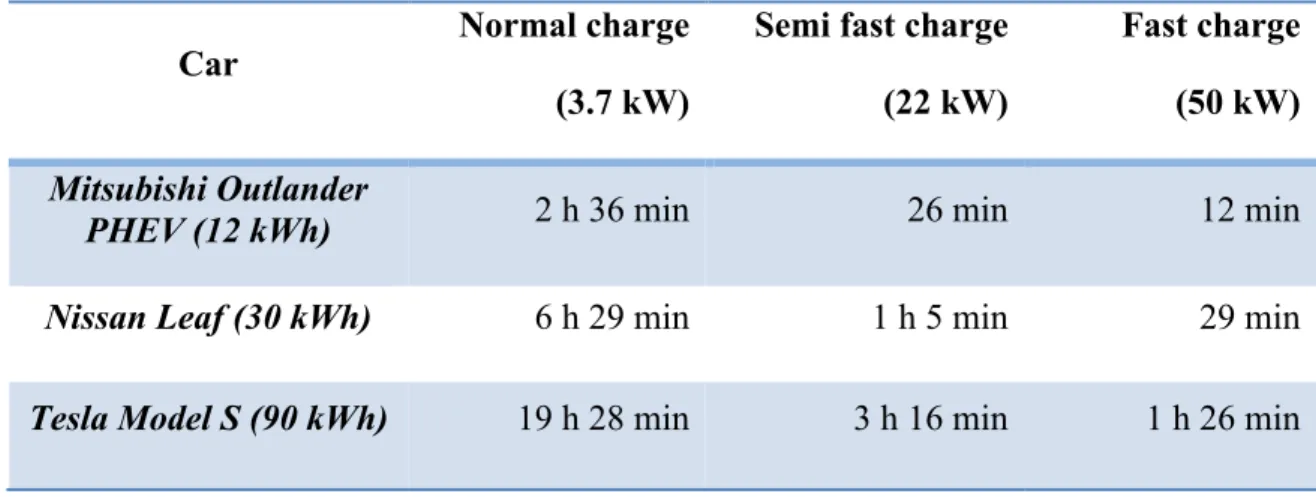
Figure 2: The general charging curve for an EV battery (Figure by Wennlund, 2016). The following table (table 2) shows the time to charge the different EVs at the different power capacities. For the calculations in the table the 30 kWh battery was chosen for the Nissan Leaf and the 90 kWh for the Tesla. For normal and fast charging the limits 3.7 kW and 50 kW were chosen. This project treats solar stations such as Solelia’s charging station which have a 22 kW charging power (see figure 1), therefore this was selected for the semi fast charge.
7
Table 2: The approximated charging duration (0-80%) calculated from dividing 80 % of the battery size with the charging power.
Car Normal charge
(3.7 kW)
Semi fast charge (22 kW)
Fast charge (50 kW)
Mitsubishi Outlander
PHEV (12 kWh) 2 h 36 min 26 min 12 min
Nissan Leaf (30 kWh) 6 h 29 min 1 h 5 min 29 min
Tesla Model S (90 kWh) 19 h 28 min 3 h 16 min 1 h 26 min
2.1.1 Existing infrastructure and tariff models for EV charging
There are about 2000 charging spots distributed on 600 stations in Sweden (2016). Some of them enable the customer to charge for free and some are connected to a parking lot, where the charging price is included in the parking fee. Other stations offer charging for a minute based or hour based price. As the number of EVs is increasing, more public stations in connection to malls and public parking lots are under
development, and different methods of paying and tariff models are being tested
(Elbilsupphandling, 2016). What follows is a short presentation of three different power companies that manage charging stations in Scandinavia. Their prices and methods will be presented.
Fortum
Fortum is one of the biggest power companies in Scandinavia. Their project Charge and Drive has been on-going since 2011. It aims to develop the infrastructure of charging stations and contains approximately 300 stations across Sweden, Norway and Finland (Fortum, 2015a). Many of those stations offer fast charging service and are deployed along different high traffic highways. Fortum has developed a minute based pricing model for fast chargers where the vehicles are charged with maximum power in the beginning. After a while the power decreases and the minute based price increases. The time based tariff model encourages the user to only charge the required electricity and then move on. In that way the time of charging decreases and the next customer can use the charger (Fortum, 2015b). The price of the fast charging service is 2 SEK/min. Fortum also offers semi fast charging at a price of 1.50 SEK/min and normal charging at a price of 5 SEK/hour (Fortum, 2016).
8
Vattenfall
Another big power company in Scandinavia, Vattenfall, uses the same tariff model as Fortum. Vattenfall has 37 semi fast chargers and 21 fast chargers positioned mainly in the area around Stockholm (Vattenfall, 2016a). Both Fortum and Vattenfall believe that the EVs should primarily be charged at home by normal charging, and that the fast chargers only should be used to fill up the battery to 80 percent or less when normal charging is not an option (Ny teknik, 2015). The price of the fast charging service and the semi-fast charging service are the same, 3 SEK/min. (Vattenfall, 2016b)
Grønn Kontakt
The Norwegian company Grønn Kontakt manages a wide network of public AC and DC chargers for EVs. The company, established in 2009, is owned by 23 Norwegian grid operators and has 46 stations in Norway. Grønn Kontakt offers different charging
options. The company offers a semi fast charging service of (converted from NOK) 0.59 SEK/kW for every initiated 15 minutes and a fast charging service of 2.47 SEK/kW for registered customers (Grønn Kontakt, 2015)(Valuta, 2016).
Table 3: A summarization of the existing EV charging tariffs today (2016).
Company (charging rate) Price Rated power output
Fortum (normal) 5 SEK/hour 3.7 kW
Fortum (semi fast) 1.50 SEK/min 22.0 kW
Fortum (fast) 2.00 SEK/min 50.0 kW
Vattenfall (semi fast) 3.00 SEK/min 22.0 kW
Vattenfall (fast) 3.00 SEK/min 50.0 kW
Grønn Kontakt (fast) 2.47 SEK/min 50.0 kW
2.2 PV power
Solar panels today (2016) normally have efficiency from 11 to 15 percent. Although there are panels that have been far more efficient, they have not discovered an economically sustainable solution to implement those panels on the market for most applications. The performance of the solar panels depends on a number of different factors such as solar radiation, temperature, shading and panel orientation. Most of the solar panels work less efficient in a hot climate, and an incorrectly designed panel can be very sensitive for small shades (Pure energies, 2016)
9
2.3 The power grid
The Swedish power grid contains of 555 000 km aerial and ground wires across the country. The power grid can be divided in three different levels: the national grid, the regional grid and the local grid. There are several local grids and the electricity customers are normally connected to a local grid. The local grids are connected to a larger regional grid that is connected to the national grid. There are about 160 different power companies in Sweden that operates in the local grids. However, the national grid is controlled by the Swedish authority Svenska Kraftnät (Svensk Energi, 2016). Svenska kraftnät balances the electricity consumption and production, and maintains fluctuations in the grid. The authority also manages the import and export of electricity with the neighboring countries (Svenska Kraftnät, 2016). The Swedish electricity that Svenska Kraftnät manages is mainly produced by nuclear power and hydropower.
2.3.1 Power peaks
In a power grid the production has to match the consumption at all times to maintain a stable grid without any large voltage and frequency fluctuations, which could possibly cause power failure. A challenge in controlling the power production is therefore to meet demand variations. A way to stimulate more preferable usage patterns of the grid would be to encourage the users to reduce their power peaks, which would smoothen demand fluctuations. There are several beneficial aspects of this, primarily the reduced risk of power failures. Another is that the dimension and expenses of new electricity infrastructure could be reduced due to the lowering of peak power (Balijepalli et. al, 2011). Considering EV charging and smoothing out the demand variations it is desirable to make people charge their EVs at home at low power outputs during night-time. Normal charging like this will also probably be the most common way of charging in the future according to Vattenfall and Fortum estimations (Ny teknik, 2015). It is reasonable though that people need higher power (semi fast and fast) charging as well. In this study the power peak perspective is taken into consideration by creating
incentives for people to do their faster charging with PV power from neighbouring solar panels. The instantaneous use of the locally produced PV power is called
self-consumption. From a power peak perspective this is something preferable due to the lower constraint on the grid.
2.3.2 Tariff models from a grid perspective
A common way to set prices for electricity today is by the amount of energy consumed (LUT, 2012, pp. 63-64). From a power grid system perspective however, there are disadvantages with energy-based tariffs, which is stated in a report by Lappeenranta University of Technology, LUT (LUT, 2012). They conclude that an energy-based tariff does not encourage an effective use of the grid since the amount of energy does not directly coincide with how strenuous the use of the grid has been, and therefore it does not reflect the cost of the grid. In the long run this is leading to an unnecessarily over-dimensioned and thereby expensive grid structure, even if it is cheaper to make a
10
resiliant grid initially compared to improving it. Another aspect of the problem with energy-based tariffs is that some customers do not have any major opportunity to lower their energy consumption, but can in fact change their behaviour considering the usage of energy when it comes to power peaks. In order to reduce power peaks to achieve a more effective use of the grid, LUT instead present a power-based tariff as the most promising option to the current pricing (LUT, 2012, pp. 63-64).
In a report commissioned by Energiforsk, officials from Sweco Energuide assembled a number of different tariff models for power grid consumers (Helbrink et al., 2015, pp. 13-22).
Table 4: The different tariff structures for power grid consumers. Based on Helbrink et al., 2015, chapter 3.3.
Name of tariff
model Structure Note Customer incentives
Fuse subscription (set as reference)
Fixed yearly fuse rate + fixed energy rate
Used by the vast majority in Sweden.
Minimizing the energy consumption, regardless of the time.
Power tariff Fixed yearly fuse rate
+ fixed energy rate + commission for highest power output
Changing to flat power
consumption, while minimizing the energy consumption.
Time differentiated power and energy tariff
Fixed yearly fuse rate + time depended high/low load energy rate + commission for highest power output
High load is defined as weekdays 06-22 November-March. The remaining time is defined as low load.
A combination between consuming constant power and focusing the energy
consumption to low load hours. The price levels decide the strongest incentive.
Monthly power tariff
Fixed yearly fuse rate + monthly depended commission for highest power output
The monthly power commission is given from the power companies costs from the same month the previous years.
Changing to a flat power consumption.
Time differentiated energy tariff, Time-of-use
Fixed yearly fuse rate + time depended high/low load energy rate
Minimizing the energy
consumption, and focusing it to low load hours.
Critical peak pricing
Fixed yearly fuse rate + energy rate
depended on high/low load and time of the year
A similar structure as Time-of-use, but more detailed.
Minimizing the energy
consumption, and focusing it to cheap times of year low load hours.
The report concludes that since the majority of the users have the fuse subscription, which does not properly incentivize the customers to minimize the strain on the grid, the
11
users who consume energy during low load hours subsidize the rest since the energy price is unchanged. Since there are good tools to provide specific consumption data, the report states that it is necessary to charge grid users in a way that encourages conscious energy consumption, taking the grid perspective into account (Helbrink et al., 2015, pp. 13-22).
2.3.3 Guarantees of origin
A guarantee of origin (GO) is a form of assurance, issued by the Swedish parliament, that the energy that is delivered from the grid is produced by a specific energy source. The idea is that the producers of renewable energy receive an extra income for the produced power, to stimulate renewable power production. After producing 1 MWh from a specific energy source, the producer obtains a GO, which can be traded with a power company where the price is decided through market mechanisms. Further, when the energy amount has been consumed, the GO is cancelled (Swedish Energy Agency, 2016). There is no official price data for GOs, but a reported estimation from 2013 is 0.01 SEK/kWh (Bengts Villablogg, 2013).
12
3. System view
The system studied in this report includes a charging station placed at some public location, e.g. outside a grocery store or a train station. It consists of two charging spots where EVs can be connected to two different power outputs. The charging station is connected to an adjacent solar panel in order to enable the EVs to be charged with locally produced PV power. The station is also connected to the power grid, which supplies the charging with remaining power when the PV production is lower than the charging power. In the case where no EV is charging and the sun is shining the
produced PV power can, as a consequence of the grid connection, be sold to the grid. A schematic description of the system can be seen in figure 3.
Figure 3: A schematic description of the system, consisting of a charging station with adjacent solar panels and with a connection to the power grid (Figure by Alarcón,
2016).
3.1 Solelia Greentech
An existing system like the one described in the system section is the charging station developed by Solelia Greentech AB. They provide a solution where the charging station is connected to14 m2 solar panel of 2 kW rated power, while it is possible to connect a larger solar panel to the station (Solelia, 2016b). EVs are most often being charged at higher power outputs than the rated PV power of the station. Since the stations are also connected to the power grid Solelia has solved the problem with low power production by establishing the so-called “solar bank” concept (“solbanken”). By trading with guarantees of origin, and measuring the station’s production and consumption Solelia
13
can guarantee 100 percent PV power for the EVs (Solelia, 2016c). For example if the power of charging is larger than the instantaneous power production at the charging station, power is supplied by the grid and the GOs and solar bank account are being used, and the source of the energy can be guaranteed. The same solution applies on the problem of charging at night-time. If a station is producing PV power when no EV is charging the energy is delivered to the grid and the solar-bank account balance increases (Solelia, 2016c).
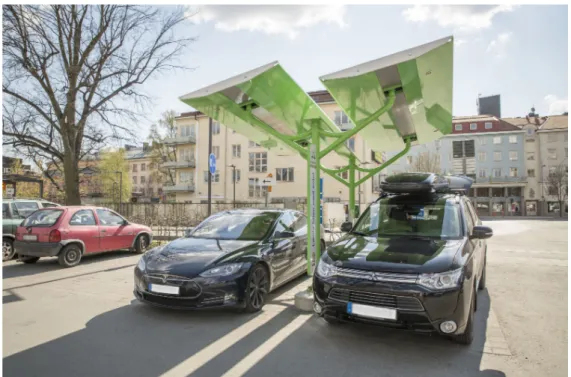
Figure 4: A Solelia charging station with 14m2 (2 kW) solar panels and two charging spots in the central station area in Uppsala, Sweden (Photo by Wennlund, 2016).
3.2 The self-consumption today
In an article by Munkhammar, Widén and Wickman (2014) eight of Solelia’s stations were analysed considering PV power production, EV charging and degree of consumption. The results vary somewhat from station to station. The degrees of self-consumption are between 0.2 and 10 percent at these stations, which calls for a great potential in improvement. Today none of the stations has any fees for charging. In order to achieve more preferable charging patterns to stimulate a higher degree of
self-consumption a time-differentiated tariff could be developed for these stations (Munkhammar, Widén and Wickman, 2014).
14
4. Methodology
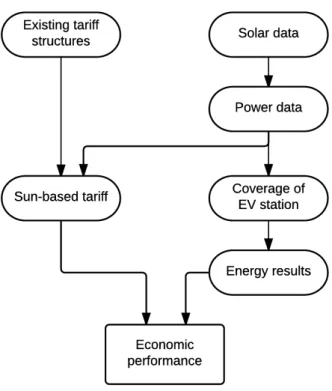
This project consists of a literature study on publications concerning tariff options for electrical energy today. To get inspiration and ideas for the development of a sun-based tariff, several existing EV charging tariffs were studied. For the development of the sun-based tariff, solar radiation data was supplied by the Ångström Laboratory at Uppsala University to be able to make approximations of PV power production. To obtain the results, Matlab scripts using the sun-based tariff model were developed. The results contains of numbers showing economic performance, considering the customer and the owner of the charging station, as well as self-consumption at the station. The results were then analysed and discussed. A sensitivity analysis was also made by changing the solar panel size within our model to see how large effect it has on the results. The methodology of this study can schematically be observed in the figure 5.
Figure 5: A flow chart of the methodology in this study.
In section 4.1 the development and structure of the sun-based tariff is motivated. Thereafter in section 4.2 the sun-based tariff is presented mathematically, showing the different parameters and how they were decided. Section 4.3 covers how charging patterns are handled within this study. In section 4.4 it is presented how the calculations for the station was made. Chapter 4 ends with section 4.5 with a description of how the sensitivity analysis was put through.
15
4.1 Motivation for the sun-based tariff model
The criteria for the model are based on different assumptions and evaluations that are aligned with the market and how the current charging stations are used. Most of the stations that are currently in service have a minute-based tariff. Therefore the model also utilizes the minute-based tariff, as it is familiar to the existing EV users. As mentioned earlier in this paper, the tariff model is intended to create incentives for charging EVs when the sun is shining. A subscription-based, month-based or year-based model, were therefore excluded as an option since the charging price would not take the momentarily PV production into account. The charging price has to vary over time and naturally follow the movement pattern of the sun. This leads to an idea of having a lower charging price when the PV production is high and vice versa. However, a tariff updated in real-time could possibly be unstable and confusing for the customers since the PV production sometimes varies within minutes. An important purpose of the sun-based tariff model is that it should be easy to understand, and promote simple charging habits. For that reason it is more appropriate to have a price that changes hourly in proportion to a daily average PV production. The daily average PV production differs on a seasonal basis. Hence it seems reasonable to suggest that the tariff model should implicate that the minute price for different hours alters monthly, every half year or in another similar timespan. However, an important goal that the tariff should try to fulfil is to create stable charging habits for the customers. So for the same reason as the real-time-based pricing was avoided, it is believed that having the same tariffs over a whole year would make it easier for the customers to understand the incentives. Although the PV production will be less during the winter, the sun's peak hours will be similar during the whole year.
In chapter 2.3.2, it was stated that not only the consumed energy, but also the used power output should be taken into account regarding the grid usage. To encourage less constraint on the grid, it should be possible to use a lower power output for the
charging, and that selection should be rewarded with a cheaper price. Furthermore, as long as the potential of the installed solar panels does not match the charging power outputs, charging with low power is preferable since it increases the self-consumption of the station. In table 4, a number of tariff models for the power grid were presented. In order to have a simple and easily accessed tariff model as well as an incentive to use a low power output, a model similar to the power tariff will be used within this project, encouraging the customer to charge not only at day time, but also with a low power output.
Two different power outputs were included in the model to give a convenient option to the customer. The chosen power values were determined to 3.7 kW and 22 kW. The first-mentioned output is the standard power output for normal charging on the market, and is the preferable option since it has lower impact on the grid, and increases the ratio of directly consumed PV power. Therefore the price of the 3.7 kW-option is set to be lower than the 22 kW-option. The 22 kW-option is still of significance since it gives the
16
customer the opportunity to charge an EV faster. The parameters and their values in the model will be presented in the next section.
4.2 Sun-based tariff model
With the previous section in mind, the sun-based tariff minute price function p was setup as follows (equation 1),
𝑝 ℎ, 𝑃 = 𝑝! 𝑃 − 𝛼 𝑃 ∙ 𝑃𝑉 ℎ (1) Where the different variables are representing,
𝑝! − 𝑟𝑒𝑓𝑒𝑟𝑒𝑛𝑐𝑒 𝑝𝑟𝑖𝑐𝑒,
which is a price per minute when there is no PV production. It depends on charging power and when the charging is taking place.
𝑃 − 𝑐ℎ𝑎𝑟𝑔𝑖𝑛𝑔 𝑝𝑜𝑤𝑒𝑟, ℎ − ℎ𝑜𝑢𝑟 𝑜𝑓 𝑑𝑎𝑦,
𝑃𝑉 − 𝑓𝑢𝑛𝑐𝑡𝑖𝑜𝑛 𝑔𝑖𝑣𝑖𝑛𝑔 𝑎𝑣𝑒𝑟𝑎𝑔𝑒 𝑃𝑉 𝑝𝑟𝑜𝑑𝑢𝑐𝑡𝑖𝑜𝑛 𝑓𝑜𝑟 𝑡ℎ𝑒 𝑔𝑖𝑣𝑒𝑛 ℎ𝑜𝑢𝑟, 𝛼 − 𝑝𝑟𝑜𝑝𝑜𝑟𝑡𝑖𝑜𝑛𝑎𝑙 𝑐𝑜𝑛𝑠𝑡𝑎𝑛𝑡.
Considering the choice of two different power outputs, there are two p0-values. These
were set based on Fortum’s prices of 1.50 SEK/minute for 22 kW and 5 SEK/hour, corresponding to 0.08 SEK/minute, for 3.7 kW. For the sun-based tariff these were taken into account by setting the p0-values to obtain an average minute price for a day to
be the same as Fortum’s constant pricing. This gives, 𝑝! 22 𝑘𝑊 = 1.773 𝑆𝐸𝐾, and
𝑝! 3.7 𝑘𝑊 = 0.095 𝑆𝐸𝐾.
The 𝛼 - parameter is a proportional constant in the unit of SEK/kW, which is adjusting the minute price proportionally to the average PV production. It was set to reduce the minute price to half of the reference price at the hour of highest average PV production. This was to give a clear incentive to charge EVs at the brightest hours of the day. The -parameter is also depending on the reference price since it changes with charging power. It is set as follows (equation 2),
𝛼 𝑃 = !!(!)
!∙!"# (!") (2) The total cost is then set by the sum of the minute prices over the charging period, through equation 3,
𝑡𝑜𝑡𝑎𝑙𝑐𝑜𝑠𝑡(𝑇!, 𝑇, 𝑃) = ! 𝑝(ℎ, 𝑃)
17 where, 𝑇!− 𝑚𝑖𝑛𝑢𝑡𝑒 𝑐ℎ𝑎𝑟𝑔𝑖𝑛𝑔 𝑠𝑡𝑎𝑟𝑡𝑠, and, 𝑇 − 𝑚𝑖𝑛𝑢𝑡𝑒 𝑐ℎ𝑎𝑟𝑔𝑖𝑛𝑔 𝑒𝑛𝑑𝑠.
4.3 Charging patterns
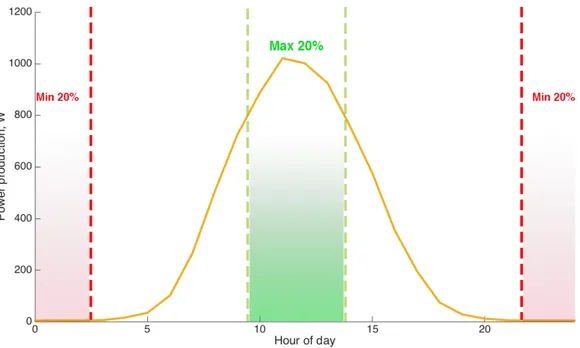
With a rapidly changing EV market and lack of data of how and when people are charging EVs, charging patterns are relatively unknown (Munkhammar, 2015). In this study different scenarios of user coverage (percentage of time of use) of the station has been utilized to analyse consumed energy from the station and the economic output. This was done with 20, 33 and 50 percent coverage. A maximum and minimum value from this gives an interval to work with. This is used to calculate the possible intervals of income, self-consumed energy and costs of energy from the grid. In figure 6 below it is visually explained where the maximum and minimum values occur.
Figure 6: The average PV production over a day. The intervals show the maximum and minimum self-consumption time spans given a 20 % coverage (Figure by Wennlund,
2016).
4.4 Station calculations
All station results were calculated on a year basis. Self-consumption and economic performance results were obtained through the different coverage. Degrees of self-consumption were obtained by simulating how much PV power the station is producing
18
on average every minute. Looking at time intervals with certain coverage, finding the maximum and minimum value, a self-consumption span was obtained for that specific coverage. Matlab script can be seen in appendix B. For the economic performance, income and cost for the station were calculated. Here the time spans were also applied, giving an income and cost interval. The income was calculated by looking at income from EV charging and sold energy. The cost was calculated from energy that had to be purchased from the grid. The profit for the station was then calculated from the
difference of income and cost.
4.5 Sensitivity analysis
Since the result is affected by a number of assumptions and uncertanties regarding the parameters, a sensitivity analysis is motivated, where the key parameters are varied. In this case the parameter that was varied is the size of the solar panels. The default size (14 m2 (2 kW)) was changed to 300 m2 (43 kW), which is the size of the solar panels on
ICA Maxi Västerås, a size assumed to apply on super markets and office buildings, where the station could be located (Direct Energy, 2012).
19
5. Data
The purpose of this section is to introduce the solar data that has been used in the model to obtain the results. Assumptions and estimations that were made with will also be presented.
5.1 Solar data
To approximate the PV production at a charging station, solar radiation data was
obtained from measurements at the Ångström Laboratory, Uppsala University. The data spans over a year and has minute resolution in the unit of W/m2. This data was for example used in Quantifying self-consumption of on-site photovoltaic power generation
in households with electric vehicle home charging (Munkhammar et. al, 2013). To use
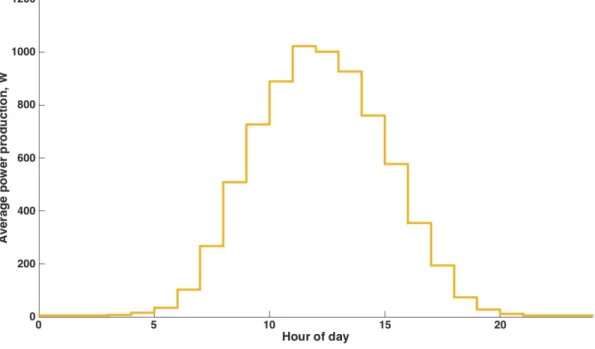
the data in this study (which aims for an hour based tariff) an average of each hour for a day was calculated. With 15 percent efficiency of the solar panels and a size of14 m2 (2 kW), figure 7 shows the average PV power production of a charging station, which is implemented in the Matlab function averagePVproduction(h) (see Appendix B) that the model is based on.
Figure 7: The average PV production with 14 m2 (2 kW) solar panels and 15 % efficiency over a day (year based data).
20
5.2 Assumptions and estimations
Prior to the simulations, a number of parameters had to be determined.
§ The grid power is assumed to be paid for by the consumed energy, since it is the most common tariff model (due to chapter 2.3.2). According to Vattenfall, the extensive power consumption that is needed for this kind of station (set to 100 000 kWh/year) gives a total price of 0.7275 SEK/kWh including taxes
(Vattenfall, 2016c). Since Solelia guarantees 100 percent solar energy from their stations, guarantees of origin for the solar energy need to be purchased and added to the power price. Due to chapter 2.3.3, a solar energy GO was set as 0.01 SEK/kWh in 2013. This indicates that the cost is marginal, but an increased demand of solar power could increase the value of the solar GOs. By taking that into account, as well as the possible fluctuations of the grid power price, the grid power price is set to 0.80 SEK/kWh in the simulations.
§ The solar panels are assumed to be south directed solar panels with 15 percent constant efficiency (due to assumptions in section 2.2).
§ Every EV is assumed to consume 2 kWh per 10 km, which is based on estimation from Svensk Energi (2014b, p.5).
§ The coverage that has been used are 20, 33 and 50 percent.
§ Since the Solelia station in the Uppsala central station area has 14 m2(2 kW)
solar panels, that size has been set as default for the simulations.
21
6. Results
Initially in this chapter the prices obtained with the sun-based tariff model are
presented. Then the maximum and minimum self-consumption cases are compared from different perspectives. The cases are also put into comparison with a constant price scenario. Results with the constant price are given by assuming that charging is evenly spread out over the day. The section starts off giving results for charging an EV from a customer perspective, and thereafter the results from a station perspective are presented.
6.1 Customer
From the sun-based tariff model presented in section 4.2 with the given parameter values, the following prices for the customers of EV charging are presented in figure 8 and figure 9. Given that the customer has the choice of charging at 3.7 kW or 22 kW power output, the cases that are presented are with charging being done with one or the other. First, the prices for charging with 3.7 kW power (figure 8) output is presented, thereafter with 22 kW (figure 9).
22
The lowest price for charging at 3.7 kW is obtained between 11:00 and 12:00 with the sun-based tariff. The price is then 0.048 SEK/min. During night-time the price rises to 0.095 SEK/min. The highest price is obtained between 21:00 and 04:00. Exact minute prices can bee seen in appendix A.
Figure 9: Prices per minute over a day, charging at 22 kW.
The lowest price for charging at 22 kW is obtained between 11:00 and 12:00 with the sun-based tariff. The price is then 0.89 SEK/min. During the night-time the price goes up to 1.773 SEK/min. The highest price is obtained between 21:00 and 04:00. The minimum and maximum prices for the 3.7 kW case occur during the same hours, which is expected since both cases are using the same equations with the difference of
reference price. As for the 3.7 kW case exact prices for 22 kW can be seen in appendix A.
Some typical EV models on the market today are presented in section 2.1. Costs of charging these models from 0-80 percent are presented below with the sun-based tariff model and a constant minute price (table 5 and 6). The minimum prices are
corresponding to charging at daytime when the sun is shining, while the maximum prices are during night. Corresponding costs per 10 km are also shown in figures 10 and 11, based on that an EV consumes 2 kWh per 10 km.
23
Table 5: Total costs of charging with 3.7 kW from 0 to 80 percent of battery capacity.
EV Total cost (SEK) minimum price maximum price constant price Mitsubishi Outlander PHEV (12 kWh) 7.62 14.78 12.45 Nissan Leaf (30 kWh) 21.39 36.95 31.14 Tesla Model S (90 kWh) 90.00 101.78 93.41
Figure 10: The corresponding cost per 10 km for the different EVs, charging at 3.7 kW. The minimum and maximum price are shown. The horizontal line is representing cost
with constant price.
As table 5shows, the price for charging a battery from 0 to 80 percent, doubles for a Mitsubishi Outlander PHEV, comparing the maximum and minimum cases. The Tesla Model S minimum and maximum price does not differ much from each other when charging at 3.7 kW power output. This is explained by the amount of time it takes to charge the large battery of 90 kWh with a lower power output. Charging Tesla Model S from 0 to 80 percent takes 19 hours and 28 minutes, which covers a large part of both
24
day and night resulting in a smaller price difference. The cost per 10 km therefore does not vary significantly for a Tesla model S, however for the Nissan Leaf and the
Mitsubishi which have smaller batteries, the cost between the maximum and the minimum cases varies with over 1 SEK. Comparing with the constant minute price for the 3.7 kW power output, it is located between the maximum and minimum cases for the minute price.
Table 6: Total costs of charging with 22 kW from 0 to 80 percent of battery capacity.
EV Total cost (SEK) minimum price maximum price constant price Mitsubishi Outlander PHEV (12 kWh) 23.94 47.76 39.27 Nissan Leaf (30 kWh) 58.61 116.74 98.18 Tesla Model S (90 kWh) 182.57 348.34 294.55
Figure 11: The corresponding cost per 10 km for the different EVs, charging at 22 kW. The minimum and maximum price are shown. The horizontal line is representing cost
25
The minute price with the hourly rates when charging at 22 kW with the sun-based tariff model differs with approximately 1 SEK. Table 6 shows that charging a Nissan Leaf, Tesla model S or a Mitsubishi Outlander from 0 to 80 percent in the maximum case, costs almost twice as much comparing with the minimum case. The same difference in price occurs when comparing the cost per 10 km between the two mentioned cases. The minimum case is also far cheaper per 10 km, comparing with the constant price. For example, the minimum price for a Nissan Leaf is 4.88 SEK/min and the constant price is 8.18. The difference between the constant price case and the maximum case does not vary as much.
6.2 Station
The results from a station perspective are presented below in tables showing numbers of energy consumed, rate of self-consumption and sold and purchased energy from the grid. The results are shown with different coverage of use and with either 3.7 kW or 22 kW power output. The tables are presented with a year as time frame.
6.2.1 Consumed energy
The total energy that is consumed over a year with the different coverage and power outputs is presented below (table 7 and 8). The consumed energy converted to driving range is also presented.
Table 7: The yearly energy consumption with different coverage of station use, and the charging done with 3.7 kW. The corresponding driving range also presented.
Coverage
(%) Energy (kWh) Range (km)
20 12 965 64 825
33 21 392 106 960
26
Table 8: The yearly energy consumption with different coverage of station use, and the charging done with 22 kW. The corresponding driving range also presented.
Coverage (%) Energy (kWh) Range (km)
20 77 088 385 440
33 127 195 635 975
50 192 720 963 600
As table 7 and 8 shows, the driving range increases with higher energy consumption. With the coverage of 50 percent for 22 kW charging, the range is 963 600 km. The energy consumption when charging at 3.7 kW is considerably lower than the energy consumption when charging at 22 kW.
6.2.2 Self-consumption
The degree of self-consumption for different coverage is presented in Table 9.
Table 9: The total energy and percentage of the locally produced PV power that is directly used, i.e. the yearly self-consumption. The rest is delivered to the grid.
Coverage (%) Highest self-consumption Lowest self-consumption Estimated self-consumption with constant price kWh % kWh % kWh % 20 1 628 59.2 8.9 0.3 818 29.8 33 2 327 84.7 18 0.7 1 173 42.6 50 2 676 97.3 75.7 2.7 1 376 50.0
The self-consumption of the station, with different coverage, shows a number of
interesting results. Table 9 shows that the ratio of self-consumption is over 50 percent in the highest self-consumption cases for the different coverage. For the 50 percent
coverage, the self-consumption is almost 100 percent, which means that almost all locally produced PV power would been used for charging the EVs. Comparing with the
27
lowest self-consumption cases where the ratio is very low, almost all PV power would be sold to the grid instead.
6.2.3 Sold and purchased energy
The delivered and consumed electricity to and from the grid for different coverage is presented in Table 10. The table applies to both the 3.7 kW case and the 22 kW case, since the amount of sold PV power will be the same for the both cases.
Table 10: The energy (kWh) sold to grid for different coverage.
Coverage (%)
Energy sold to grid (kWh)
Highest self-consumption Lowest self-consumption
20 1122 2741
33 423 2732
50 74 2674
Table 10 shows that higher self-consumption gives a lower amount of energy that would be sold to the grid. In the 50 percent coverage case, the amount of energy between the highest self-consumption and lowest self-consumption differs with 2600 kWh.
With the rates of self-consumption in table 9, the following numbers shows the amount of energy that is purchased from the grid. This is also presented with the cases of charging with 3.7 or 22 kW power output (table 11 and 12).
Table 11: The energy (kWh) purchased from grid if all charging is done with 3.7 kW
Coverage (%)
Energy purchased from grid (kWh)
Highest self-consumption Lowest self-consumption
20 11 337 12 956
33 19 065 21 374
28
Table 12: The energy (kWh) purchased from grid if all charging is done with 22 kW
Coverage (%)
Energy purchased from grid (kWh)
Highest self-consumption Lowest self-consumption
20 75 460 77 079
33 124 868 127 177
50 190 044 192 644
Table 11 and 12 shows that the energy purchased from the grid does not vary drastically between the highest and the lowest self-consumption cases, for both the 3.7 kW and the 22 kW outputs. This could be due to the area (rated power) of the solar panels not being large enough to cover the instant power needed for charging the EVs. Therefore the energy purchased from the grid remains in a more or less constant level.
6.2.4 Economic performance
In Table 13 the profit when charging at 3.7 kW i shown. In Table 14 the profit when charging at 22 kW is shown. An approximation of the energy price is set to 0.80
SEK/kWh, both for selling and buying. The profit is calculated from numbers of income and costs, which can be seen in the appendix.
Table 13: The profit (SEK) for the station owner if all charging is done with 3.7 kW, depending on coverage and highest or lowest self-consumption.
Coverage (%)
Profit (SEK)
Highest self-consumption Lowest self-consumption
20 2 788 11 821
33 5 114 17 997
29
Table 14: The profit (SEK) for the station owner if all charging is done with 22 kW, depending on coverage and highest or lowest self-consumption.
Coverage (%)
Profit (SEK)
Highest self-consumption Lowest self-consumption
20 145 159 313 654
33 274 222 514 645
50 502 586 773 325
By looking at the economic profit for the station owner, presented in table 13 and 14, regardless of charging at 3.7 kW or 22 kW, the profit is larger for the cases with the lowest self-consumption. The proportions between the customer price and energy purchased from the grid could explain this. As mentioned in the previous section, the energy purchased from the grid is more or less equally for the different cases. However, the customer price does not remain constant, since the minute price in the sun-based tariff model changes rather drastically during the day. Hence, when charging is done during sun hours the profit will be lower.
6.3 Sensitivity analysis
A sensitivity analysis was made by changing solar panel size to 300 m2 to see how the economic performance of the model then was changed. The same calculations as for the results above were done and the following results were obtained. First, sold energy to the grid is presented. A distinction from the results above is when the two charging spots are occupied and charged at 3.7 kW at production peak hours, the station is producing more power than needed for the charging. Therefore, in this case, the station is simultaneously obtaining incomes from both the charging and selling energy to the power grid.
The 300 m2 solar panel reaches an average power peak of 22 kW. Producing 58.9 MWh
30
Table 15: The energy (kWh) sold to the grid if all charging is done with 3.7 kW charging
Coverage (%)
Energy sold to grid (kWh)
Highest self-consumption Lowest self-consumption
20 45 972 58 746
33 37 545 58 550
50 26 525 57 315
Table 16: The energy (kWh) sold to the grid if all charging is done with 22 kW charging
Coverage (%)
Energy sold to grid (kWh)
Highest self-consumption Lowest self-consumption
20 24 055 58 746
33 9 073 58 550
50 1 599 57 315
The next tables presented are showing the energy purchased from the grid in the case of 300 m2 solar panels at neighbouring rooftops to the solar-station.
Table 17: The energy (kWh) purchased from grid if all charging is done with 3.7 kW
Coverage (%)
Energy purchased from grid (kWh)
Highest self-consumption Lowest self-consumption
20 0 12 774
33 0 21 005
31
Table 18: The energy (kWh) purchased from grid if all charging is done with 22 kW.
Coverage (%)
Energy purchased from grid (kWh)
Highest self-consumption Lowest self-consumption
20 42 207 76 897
33 77 331 126 808
50 135 382 191 098
These numbers are resulting in the following profit intervals for 3.7 kW and 22 kW respectively.
Table 19: The profit for the station owner if all charging is done with 3.7 kW, depending on coverage and highest or lowest self-consumption.
Coverage (%)
Profit (SEK)
Highest self-consumption Lowest self-consumption
20 47 738 56 771
33 50 064 62 946
50 56 292 70 799
Table 20: The profit for the station owner if all charging is done with 22 kW, depending on coverage and highest or lowest self-consumption.
Coverage (%)
Profit (SEK)
Highest self-consumption Lowest self-consumption
20 190 030 358 600
33 319 170 559 590
32
By having solar panels of 300 m² instead of 14 m², the amount of purchased energy from the grid decreases, which is showed when comparing Table 11 and 12 with Table 17 and 18. With solar panels that cover an area of 300 m², the self-consumption
increases for the both charging output cases. In the 3.7 kW case with the highest self-consumption, no energy from the grid is needed, which is showed in Table 17 where there is only zeros in the column. And comparing with charging at 22 kW, a larger amount of energy is also sold to the grid since the station overproduces PV power, showed in Table 15 and 16.
However, even by having 300 m², the profit for the station will still be higher in the lowest self-consumption case, for both 3.7 kW and 22 kW, regardless of the coverage, which can be seen in Table 19 and 20. But the station owner still makes a larger profit comparing with having 14 m².
7. Discussion
The results show that the prices for charging are lower when the self-consumption is high and vice versa. Comparing the sun-based tariff with a constant price-based tariff, the first mentioned creates incentives for charging when the sun is shining from a customer perspective. In contrast to the present self-consumption that is between 0.2 and 10 percent (due to chapter 3.2), the highest self-consumption cases are over 50 percent.
The calculations that have been made are based on charging the battery from 0 to 80 percent. The amount of kilometers that is charged into the different EV models are the same per minute within the assumptions. This simplifies the reality, since EVs do not only charge within the mentioned interval, which is the most efficient span. Due to this, the estimations of the distances are slightly overestimated. The sun-based tariff model does not take this into account. A way to improve it could therefore be to make the price depend on how charged the battery is. Due to chapter 2.2.1, Fortum has a somewhat similar solution, where the fee increases with the charging time. The implementation of that aspect could be a case for further studies.
The station owners’ higher profit during low self-consumption could be seen as a flaw of the model, since the station owner could want to create incentives for the customers to charge during night-time. This opposes the purpose of the model since it creates unwanted owner incentives.
The 𝛼-parameter was set to reduce the minute price by half to create the incentives. However the parameter could have been set different and the results would then have been affected. By lowering the 𝛼-parameter the minute price would vary less and the incentives for the customers to charge during the peak hours of the sun would be affected negatively. With a higher -parameter, the incentives for the customer increase
33
but the station owner’s profit could decrease. This balance needs to be taken into account when designing the tariff and could therefore be investigated further;
attempting to increase the station owner incentives for implementation of the sun-based tariff, without taking away the customer’s incentives.
The solar panel sizes used in the results are 14 m2 and 300 m2, since they represent the Solelia station and the solar panel size on a big supermarket’s roof. The results show that larger sizes leads to higher incomes for the station owners for both day and night-time charging, since less power needs to be purchased from the grid. At the same night-time, the gap between the day and night charging income for the station owner decreases, which makes the incentive stronger for the station owner to implement the sun-based tariff. For solar panel sizes between the presented, the station owner incomes will lie between the 14 and 300 m2 cases, since it is proportional to the size. Since the results depend on the coverage, which is hard to predict, the station incomes are difficult to foresee. It could be seen as a rule of thumb though that larger solar panel sizes gives higher incomes, besides the investment costs.
This study has focused on investigating how the sun-based tariff affects the economical aspects of the customers and station owners. It has not included the construction- and material costs of the stations and solar panels, which are important factors in practice. The results show that the incomes of the station owners increase with larger solar panels, but since it does not take the investment price into account, it should not be seen as a calculation of the total result. With high prices on solar panels, it could not be taken as unreasonable that the station owner achieves higher expenses than incomes over a certain time. The calculations simply show how the solar panel size directly affects the incomes. A study including the construction- and material costs could be a good supplement to this study.
The developed model in this report focuses and tries to find an incentive to charge when the sun is shining and solar power can be used instantly. It does not take the peak hours of the grid into account. Due to chapter 2.3.2, there is a gain in encouraging customers to even the power consumption between high- and low peak hours. Therefore, it could be argued that there is a point in encouraging EV owners to charge at night-time, when the power consumption is low. This goes against the incentive given by the sun-based tariff, which encourages customers to charge at daytime. There is a potential in the direct use of solar energy for EV charging. Still, the results show that the installed PV power is not sufficient to cover the energy need in almost every case, and that the grid usage therefore is necessary. However, the sensitivity analysis showed that with larger solar panels the grid would be of less matter. How the charging should be balanced to optimize both the solar potential and the grid usage is complex and calls for further research.
Since the study is based on different estimated coverage, the results are presented through wide intervals. A big set of EV charging data would enable the study to be realized in a different way, giving more specific results. Anyhow, the purpose of the
34
model is not to satisfy current charging patterns, rather it tries to create new ones. Therefore a study of charging patterns when the model has been implemented is of interest.
A year average day is used for the tariff to create a constant incentive for daytime charging, regardless of seasonal change. The solar power produced changes over the year, during winter time there is less sun radiation in Uppsala and Sweden than in summer time. The summer then compensates for the less producing winter. This though is very different depending on where on earth the sun-based model is implemented. Closer to the equator the solar radiation is higher and the seasonal solar radiation change is smaller. Using solar radiation data from there would change the results and possibly show an even greater incentive to use the sun-based tariff.
This thesis treats the direct profit from charging fees, but there are other benefits that should be taken into account. For example in marketing and a sustainability perspective could be evaluated in further studies.
This study could be elaborated with more different kinds of tariff models. Ideas for future projects are firstly a model that changes the price with the real-time energy production. It was stated in chapter 4.1 that a real-time updated fee was to be too complex at this early phase, this however can be further investigated. Secondly, the concept of monthly subscriptions was refused for this study since the notion of giving incentives for daytime charging is disregarded. Anyhow, more advanced subscription systems could be investigated, for instance those which only allow daytime charging. That kind of subscription would both be easy to understand and encourage solar charging at appropriate times. The economical- and energy aspects of that kind of system are also interesting subjects for further studies.
35
8. Conclusions
With these results a couple of conclusions can be drawn,
§ The sun-based tariff model fulfils its purpose creating customer incentives to charge during daytime. For example, charging at the solar station with a specific power output during day rather than night-time, gives a price difference per 10 km by almost a factor of two.
§ The profit of the station is higher if the charging is taking place during night-time. Thus, it will not create an incentive for the station owners to implement the sun-based tariff, which is a weakness in the model.
§ The degree of self-consumption is naturally higher if charging is done during daytime. This study shows that if the sun-based tariff would be implemented in reality and customers would respond to the incentives, the degree of self-consumption would rise considerably.
§ Installing larger solar panels to the solar station makes the profit higher for both day and night-time charging. Simultaneously, the gap between the day and night charging income for the station decreases, which makes the incentive stronger for the station owner to implement the sun-based tariff.
Our gratitude
We would like to direct a special thanks to Joakim Munkhammar for guidance along the way and for supplying data. We would also like to thank Per Wickman and Patrik Norling at Solelia Greentech AB for their input, as well as Anders Hollinder at Uppsala municipality.
36
References
Balijepalli, M., Pradhan, V., Khaparde, S.A. and Shereef, R. M. (2011), Review of Demand Response under Smart Grid Paradigm. IEEE PES Innovative Smart Grid Technologies. http://ieeexplore.ieee.org/stamp/stamp.jsp?tp=&arnumber=6145388 Battery University (2016a), Electric Vehicle (EV). Available online:
http://batteryuniversity.com/learn/article/electric_vehicle_ev (2016-05-11) Battery University (2016b), Four Renegades of Battery Failure. Available online:
http://batteryuniversity.com/learn/article/four_renegades_of_battery_failure (2016-04-19)
Bengts Villablogg (2013), Värde solel. Available online: http://bengtsvillablogg.info/varde-solel/ (2016-05-03)
Center for Climate and Energy Solutions (2015), Outcomes of the UN Climate Change Conference in Paris. Available online:
http://www.c2es.org/international/negotiations/cop21-paris/summary, (2016-04-12) CEF, Conservative Energy Future (2016), Advantages and disadvantages of electric
cars. Available online: http://www.conserve-energy-future.com/advantages-and-disadvantages-of-electric-cars.php (14/4-2016)
Direct Energy (2012), Exempel på solcellsanläggningar. Available online:
http://www.lansstyrelsen.se/vastmanland/SiteCollectionDocuments/Sv/miljo-och-
klimat/klimat-och-energi/Direct%20Energy%20V%C3%A4ster%C3%A5s%20121002_del%202.pdf (2016-05-13)
Elbilsupphandling(2016), Vanliga frågor. Available online: http://www.elbilsupphandling.se/vanliga-fragor/ (2016-05-04)
Elbilsstatistik (2016), Se statistik. Available online: http://elbilsstatistik.se/startsida/se-statistik/ (2016-04-12)
Emobility (2016), Att välja rätt plats. Available online:
http://emobility.se/startsida/laddstationsguiden/forberedelser/1-6-att-valja-ratt-plats/ (2016-04-12)
The European Comission (2011), Europe 2020 targets. Available online:
http://ec.europa.eu/europe2020/targets/eu-targets/index_en.htm (2016-04-08) Fortum (2015a), Vi vägrar vara dinosaurien som dör ut med den gamla tekniken.
Available online: https://www.fortum.se/countries/se/om-fortum/karriar-och-student/dina-framtida-kollegor/markus-hokfelt/pages/default.aspx (12/4-2016) Fortum (2015b), Pricing the fast charging of electric vehicles correctly ensures the
availability of the service. Available online: https://www.chargedrive.com/?p=8 (2016-04-12)