for the
ECONOMY
In September 2013 IPCC reconfirmed that limiting climate change will require
substantial and sustained reductions of greenhouse gas emissions. The
transi-tion to a low-carbon society at reasonable costs will not be possible without
technological change. Society needs to develop and introduce new
technologi-es and see a rapid deployment of existing solutions. The required invtechnologi-estments
are massive, clearly orders of magnitude beyond what heavily indebted nation
states and budget constrained international pubic entities could mobilize.
Pri-vate capital investments are hence essential.
Besides the relevance for climate change, there are also commercial
opportu-nities in a green transition. In the aftermath of the global financial crisis,
im-proving industrial competitiveness and growth prospects is high on the
Euro-pean agenda. During 2012 a dramatic shift in the balance of renewable energy
investments worldwide occurred, with the centre for clean energy investment
shifting from West to East. China passed the US as the major clean energy
in-vestor and the EU is in the process of losing the high ground it previously had.
Regardless if the perspective is green growth or climate change, the public
debates in the EU member states are sparse or overly focused on
governme-ntal funds that clearly are too limited to meet the long-term financing needs.
Research show that entrepreneurs and small, new firms are important drivers
of economic development and innovative processes. It is also well known from
the literature that the single most prominent obstacle to entrepreneurial
ven-turing is finance. To make effective policies to mobilize and leverage private
funding for green tech innovation it is important to understand
entrepreneu-rial investment decisions and to look at policies from the perspective of the
investor and entrepreneur respectively. This ELF project studies private
invest-ment in green venturing, linking theory, empirics and policy and concluding by
suggesting future research.
Mobilising Private
FUNDS
TRANSITION
to a Sustainable
for the
ECONOMY
Mobilising Private
FUNDS
TRANSITION
to a Sustainable
© 2013
ISBN: 91-89301-50-1
Authors: Maria Adenfelt, Mark Sanders, Ulrika Stavlöt Print: TMG Tabergs
Preface
In the UN-led negotiations on climate change, climate finance is a main discussion theme. Developed countries in Copenhagen 2009 committed to mobilize 100 billion US dollars annually to help developing countries to adapt to climate change and to foster their transition to sustainable development.
Thus far, the commitments from developed countries are nowhere near the promised amount. Neither is there an agreement on where funds should come from. Some argue that all should be public donations, equalling support for adaptation and mitigation to aid. Others highlight the need for private capital to meet the significant climate change investment needs.
Not only developing countries need to invest in climate-relevant projects. A global technological shift is war-ranted to curb global temperature rise below 2 degree Celsius. The global warming finance gap is massive. The discussion on how to generate the massive investments needed for a shift of technology in high emitting developed countries is however missing in the global talks on climate.
On the other hand, governments are beginning to acknowledge the potentials of green growth and the strategic advantages of being a first-mover in these high impact sectors. Also, awareness is increasing of the limits to public funds for the scale of the financing needs for a timely energy transition. There is also a gro-wing understanding for the necessity of a well-designed public policy to attract private capital investments. In Europe strategic focus on renewable energy has, as a consequence of the European debt crisis, and pos-sibly also of the shale gas supply shock, turned into suspension and rollbacks of ambitious and progressive incentive programs. The European political agenda is unclear and private investors are turning to other markets.
Although a plethora of general recommendations and specific policy suggestions on how to mobilize the private capital are circulated in various forums there is a need for a more informed discussion, backing up policy with relevant research. This report aims to relate important theoretical and empirical findings on investment decisions and green technology promotion to recent developments in global cleantech industry and policy. Focusing on the Netherlands and Sweden the report discusses important policy differences and identifies key factors for policy makers to consider.
With this publication, the European Liberal Forum (ELF) hopes to stimulate the public debate on the pro-spects of the European energy- and cleantech industries and how public policy can leverage and direct private sector capital flows to promote green growth in Europe.
Felicita Medved
About the Authors
Maria Adenfelt
is associate professor in business studies and research director at Swedish Entrepreneurship Forum. Maria received her PhD in international business at the Department of Business Studies at Uppsala University in 2003 with a thesis titled “Creating and Sharing Subsidiary Knowledge within Multinational Corporations”. In 2004-2005, she was a visiting scholar at Stanford University. Her research interests cover strategic management of knowledge creation and sharing in multinational corporations, corporate entrepreneurship and internationalization and innovation in small- and medium sized firms.Mark Sanders
is assistant professor of international macroeconomics at Utrecht School of Economics. Mark got his PhD in the impacts of technical change on labour demand at Maastricht University in 2004. After his PhD, he started working on entrepreneurship and innovation at the Max Planck Institute of Economics in Jena, Germany. In 2006 he became an assistant professor at Utrecht School of Economics where he received tenure in 2010. He has published on topics such as skill-biased technical change, entrepreneurship and innovation in macroeconomic dynamics, and small business economics. He joined Utrecht Sustainability Institute’s Sustainable Finance Lab initiative early on to help develop a comprehensive research agenda to rethink the position and role of the financial sector from the real, macroeconomic perspective.Ulrika Stavlöt
is research director at Forum for Reforms, Entrepreneurship and Sustainability (FORES). Ulrika has a PhD in economics from the Institute for International Economic Studies (IIES) at Stockholm University. Before joining FORES she worked as a senior researcher at the Swedish Institute for European Policy Studies and as a consultant for the OECD Development Centre. Ulrika’s research focuses on international trade and macroeconomics. She is also working on various topics related to environmental policy.About European Liberal Forum
Founded in the fall of 2007, the European Liberal Forum asbl (ELF) is the non-profit European politi-cal foundation of the liberal family. ELF brings together liberal think tanks, politipoliti-cal foundations and institutes from around Europe to observe, analyse and contribute to the debate on European public policy issues and the process of European integration, through education training, research and the promotion of active citizenchip within the EU.
Square de Meeûs 38/40, 3rd floor, B-1000 Brussels www.liberalforum.eu
Published by the European Liberal Forum asbl with the support of FORES and Mr. Hans van Mierlo Stichting. Funded by the European Parliament. The European Parliament is not responsible for the con-tent of the publication. The views expressed in this publication are those of the authors alone. They do not necessarily reflect the views of the European Liberal Forum asbl.
Preface 3
About the Authors 4
Table of Contents 5
1. Introduction 7
1.1. Outline of the report 8
2. Theoretical Framework 9
2.1. Knowledge creation, technological change and market imperfections 9 2.2. From investment decisions to real options in greentech venturing 10 2.3. Risk, uncertainty and information 11
2.4. The behavioural finance approach to investment decisions 11 2.5. Investment, regional clusters and social networks 13
2.6. Summary 14
3. Green Technology Venturing 16
3.1. From global trends to local circumstances 16 3.2. A literature review for greentech venturing 30 3.3. Concluding remarks 31
4. Current Policies on Investments, SMEs and Environmental
Technologies in the Netherlands and Sweden 33
4.1. The role of public policy to boost entrepreneurship and investments 33 4.2. Energy policy in the Netherlands 34
4.3. Policies in Sweden 38
4.4. Exploring policies in early stage funding and entrepreneurship in environmental technologies 41
5. Summarising Discussion 43
5.1. Global outlook and looking ahead 44 5.2.Future research 45
References 46
Appendix 51
1
Introduction
1
Emissions of CO2 and other greenhouse gases need to be curbed, the world population is projected to grow to 9 billion by mid-century (UN 2005) and our global ecological footprint has overstepped our resource base since the early 1970s, currently stands at 1.5 and is projected to reach 3 by mid-century under the business-as usual-scenario (Footprint Network 2013). The use of fossil energy and natural resources is clearly on an unsustainable path, and there is a need to develop and introduce new techno-logies to ameliorate this, and for the increased diffusion of existing technotechno-logies. The estimated required investments vary greatly but without exception are enormous. To keep temperature rise below the 2 degree Celsius threshold alone, the IPCC estimated in 2009 that we would need to invest some 145 billion euro annually. In 2010 the World Economic Forum estimated this cost at 500 billion euro annually with existing technology. These numbers do not include the 50 billion euro annually adding up to another trillion euro needed to achieve access to modern energy for all by 2030 (IEA 2012) and excludes transition technologies, false starts and dead ends. On the other hand, a transition is certainly within our reach. Numerous technologies are available, and to put things in perspective less than 1 per cent of the global annual GDP (Koomey 2012) would be enough to address the climate change issue. It is clear, however, that the private sector will have to engage in order to make the transition.
As well as the relevance for climate change, there are also commercial opportunities in a green transition. In the aftermath of the global financial crisis, improving industrial competitiveness and growth prospects are high on the European agenda. However, in 2012 a dramatic shift in the balance of global renewable energy investments occurred, with the centre for renewable energy investment shifting from West to East. China passed the US as the major renewable energy investor and the EU is in the process of losing the high ground it previously held. Regardless of whether the perspective is that of green growth or climate change, the public policy debates in the EU member states are sparse or overly focused on governmental funds that clearly are too limited to meet the long-term financing needs.
Compelling environmental, strategic or political priorities does not necessarily translate into action as the private sector has its own logic. Private investors, corporations and banks all face hard budget constraints and will only commit their resources if a sound business case can be made (Brealey et al. 2011). They ope-rate in a global and competitive environment and cannot afford too many loss-making projects, to write off their ecologically stranded assets or take excessive risks onto their balance sheets (Cassimon et al. 2003).
It is increasingly recognised in the literature that new, small firms (Jovanovic 2001; Aghion et al. 2006) and in particular (high-impact) entrepreneurship (Audretsch et al. 2006; Acs and Armington 2006; Schramm 2006; Audretsch 2007) are important drivers of economic development in general and in inno-vative transformational processes in particular. Studies have investigated corporate investment and the diffusion of green technology (e.g. Hart 1995; Hart and Sharma 2004; Moore and Wuestenhagen 2004)
Ch a p t er 1 in t roduc t ion
but studies focusing on the role of entrepreneurs and new firm formation in this process are relatively rare (notable exceptions are Cohen and Winn 2007; Dean and McMullen 2007 and contributions col-lected in Wuestenhagen and Wuebker 2011). The focus of this report is on technological development and the diffusion of new technology in the so-called green sector, and early stage private investors and entrepreneurs are the main actors.
It is clear from the literature that the single most prominent obstacle to entrepreneurial venturing is finance (Evans and Jovanovich 1989). Seed and early stage venturing typically burns cash and involves high risks. Other obstacles identified in the literature include high capital demand, especially high up-front costs, heavy and erratic regulation, low levels of knowledge and the absence of exits (Grichnick and Koropp 2011; Marcus et al. 2011). Understanding entrepreneurial investment decisions from the perspective of the investor as well as from the entrepreneur is thus the starting point for any policy that hopes to effectively leverage public funds and mobilise private capital to accelerate a transition to sustainability. The literature on the interplay between finance and entrepreneurship in green venturing is emerging (e.g. Moore and Wuestenhagen 2004; Wuestenhagen and Teppo 2006; O’Rourke and Parker 2006; Buerer and Wuestenhagen 2009) where Wuestenhagen and Wuebker (2011) point out the rising importance of corporate venture capital.
Although climate finance is an increasingly hot topic in the global debate with international NGOs publishing numerous reports with cost assessments and policy recommendations, the national debates are in most countries sparse or overly focused on governmental funds that are clearly too limited to meet long-term financing needs. In general, the public debates and the policy recommendations offered are not framed by recent research on investments and entrepreneurship. This report intends to fill this gap by relating important theoretical and empirical findings on investment decisions and cleantech promotion to the recent developments in the global cleantech industry, as well as in a few key countries, and to the relevant government policy measures in place.
More specifically, the aim of this report is twofold:
(1) to outline a theoretical framework, backed by empirical evidence, of key factors that affect private investment decisions in green technology ventures; (2) to describe the policy-frameworks in the Netherlands and Sweden with the
purpose of discussing how they enable growth in the green technology sector.
We define “green technology” broadly as those technologies that reduce the footprint of our economy. Green technology, also referred to as “greentech”, is often, and also in this report, used interchangeably with “cleantech”, which is the term of choice by the financial markets for describing the environmental technology and renewable energy sectors. We concentrate specifically on the investment decisions in the early stages of adoption and market diffusion which puts a natural focus on new entrants, small and medium enterprises (SMEs) and SME growth in the greentech sector.
The Netherlands and Sweden are both small open countries relying on international trade, with a large and advanced knowledge base and a highly educated labour force. Despite strong traditions of R&D and a strong academic knowledge base in green technologies, both countries are less successful in turning this knowledge into practical applications delivered on a commercial scale. As we will see, the specific problems each country face look different, and the policies schemes applied to address these challenges are diverse. The policy analysis results in some general policy recommendations, not intended for specific policy advice but merely for indicating a general direction for new policy design and evaluation.
1.1. Outline of the report
This report is organised as follows. In Chapter 2, the theoretical framework is discussed, drawing upon the literature on technological development, investment decisions under uncertainty and entrepreneurship in greentech ventures. This results in a taxonomy of potentially important factors in greentech ventur-ing. In Chapter 3, descriptive statistics on the energy and environment technology sectors is presented, zooming in from the global to the European and Dutch-Swedish perspective. It ends with a summary of the empirical evidence on green venturing and the role of small firms. Chapter 4 looks at policies in the Netherlands and Sweden aiming at leveraging entrepreneurship and investments in the sectors studied using the framework we develop in Chapter 2. The final chapter discusses the results from the report and proposes areas of future research.
2
Theoretical Framework
2.1. Knowledge creation, technological change and market imperfections
One of the more prominent market failures preventing the rapid diffusion of green technology is the failure of markets to price environmental damages. Internalising such classic externalities by putting a price on emissions is the stated purpose of many policies. The aim is not only to hamper environmentally harmful activities in a cost effective, and static, way, but to induce dynamic efficiency by providing market incentives to develop and efficiently deploy technologies that prevent or reduce environmental damage, that is, they aim to create a positive net present value for investment projects that create benefits (or prevent costs) that cannot be recuperated otherwise. The underlying theoretical basis for doing so goes back to seminal work by Gordon (1954), Hardin (1968), Pigou (1924) and Coase (1960). Gordon (1954) and later Hardin (1968) described the tendency for commons to be overexploited and polluted exces-sively. Pigou (1924) argued that governments should intervene and internalise externalities through taxes and subsidies, whereas Coase (1960) showed that markets can reduce pollution to efficient levels when private property rights are established, enforced and tradable. Evidence shows that it is not sufficient to merely internalise the environmental externalities. Governments have introduced environmental taxes, subsidies and tradable permits with the aim of “getting the prices right”, anticipating that markets would then take off in the right direction.
It has long been acknowledged that markets for knowledge are imperfect, resulting in underprovision of knowledge and underinvestments in all stages of technological change (Arrow 1962). Since knowledge, at least in theory, is a public good with non-rivalry in consumption, there are positive spillovers from innovation. Without governmental protection, firms investing in R&D cannot keep other firms from also benefiting from their new knowledge and can therefore only capture part of the full social value of the innovation. Market forces therefore provide insufficient economic incentive for investments in innovation (Arrow 1962; Nadiri 1993). The government has thus an important role in implementing legal protection, for example patent legislation, to protect ideas and, at least temporarily, prevent other firms from copying them. However, complete protection is not optimal from a social welfare point of view, since new ideas and new technologies may not diffuse to firms and users other than the innovating firm. As for the adoption and diffusion of new technology, additional market failures may operate. The benefits for a user of a new technology are very much associated with the overall diffusion of the tech-nology. A phone’s value is connected and enlarged with an increased number of users, for example. This scale effect of technology adoption can be generated by learning-by-using, learning-by-doing and network externalities (Jaffe et al. 2005).
Market size externalities caused by economies of scale can lead to path-dependence and tech-nology lock-in effects. Traditional technologies will be more competitive than new techtech-nology and
Ch a p t er 2 t heor e t ic a l F r a Me wor k
profit-maximising investors will tend to invest where private profitability is highest. Thus, existing tech-nologies can maintain market dominance and suppress new, potentially socially superior, techtech-nologies (Acemoglu 2002; Acemoglu et al. 2002; Kalkuhl et al. 2012). A case in point is of course the fossil fuel internal combustion engine. Alternatives to that technology will not be profitable as long as our entire infrastructure is geared towards supporting this dominant design.
These market imperfections described above, knowledge spillovers, network externalities, learning-by-using and learning-by-doing effects, market size externalities etc., apply to all types of technology investments, although the latter two in particular, risk and path-dependence, are often argued to be stronger for green innovations. Traditional environmental externalities are specific reasons for under-investment in environmental ventures. With environmental costs not or only partially internalised, it is not possible to create viable business models that justify investment. In addition, environmental impacts are often long term, intrinsically stochastic, extending beyond national boundaries and largely unknown. Uncertainty and risk can also emanate from technologies, markets and policy, and cause substantial delay in investment, adoption and diffusion. To summarise, environmental, technology, market and policy risk increases the private risks of investing in green ventures and the resulting delay in diffusion reduces learning, scale and network effects that continue to benefit the incumbent technologies.
The macro-oriented research summarised above, typically assumes rational decision-making in mar-kets and assumes that green technologies will diffuse when externalities are adequately internalised and thus become competitive in the market place. However, it leads us to address the extent to which exter-nalities can be internalised and the role of risk and uncertainty in investment decisions. In the following sections, we discuss theories that highlight different perspectives on the behaviour of entrepreneurs and investors in investment decision-making situations.
2.2. From investment decisions to real options in greentech venturing
In the micro-based investment literature, investment opportunities are traditionally evaluated using a cost-benefit approach.2 The inherent limitations of such an approach are well documented. It assumes
a now-or-never decision and assumes the decision maker to follow a rigid path once the investment decision is taken (Feinstein and Lander 2002). In reality, in a competitive environment with uncertainty and change, ventures will not crystallise in the same shape as the decision maker initially envisioned (Cassimon et al. 2004). During the lifetime of the venture new information might arrive or certain sources of uncertainty might be resolved, making it valuable to adjust the venture (Trigeorgis 2000)3. This is
espe-cially true with respect to greentech venturing (Heal and Kristrom 2002).
Dixit and Pindyck (1994) stress the importance of timing an investment decision. Their approach implies that decision makers in actual investment ventures have the option to wait/postpone the final investment decision and they may rationally decide to do so if additional relevant information can be expected to reveal itself over time. An investment opportunity constitutes the right―not the obligation―to commit resources and reap future rewards. This gives most investment decisions an option character.4 The
stan-dard cost-benefit model cannot handle the option value that can be derived from operational flexibilities such as delaying, scaling-up/down, shutting down/restarting or abandoning a project (Guerrero 2007).
This option character is valuable in an investment environment characterised by the simultaneous existence of uncertainty, irreversibility of investment and some freedom in the timing of the investment. In theory, taking into account the value of flexibility implies that a firm will invest only if the net present value (NPV) of the project exceeds the value of keeping the option alive (i.e. not committing the resources).
2. Traditional approaches typically rely on the NPV-rule, such as Jorgenson’s (1963) “per period marginal product equals per period rental cost” approach and the equivalent Tobin’s q theory of investment. See e.g. Nickell (1978) and Abel (1983) for more details on the “user cost” and “Tobin’s q” theories of investment, respectively. 3. Knight (1921) defines uncertainty distinct from risk, where the latter refers to stochastic outcomes of which the
distribution is known and the former applies when even the distribution of possible outcomes is unknown. In real option theory typically the stochastic processes are assumed to be known and/or a known prior is assumed. This implies, where this literature follows Dixit and Pindyck (1994) and refers to “uncertainty”. Knight (1921) would call this “risk”. We use the terms interchangeably and refer to “deep uncertainty” when Knight’s concept of uncertainty is meant.
4. In general, an option can be defined as the right, but not the obligation, to buy (call-option) or sell (put-option) the underlying asset at an agreed price (strike price or exercise price) during a specific period (as in the case of American options) or at a predetermined expiration date (as in the case of European options). In contrast with financial options, real options refer to the application of the options concept to real physical investment opportunities.
Similarly, a firm will only disinvest in a project if its NPV falls sufficiently below zero to warrant giving up the option to continue operations in the future. Real options theory can thus explain the higher than expected hurdle rates that firms and investors typically apply when considering risky projects, and their reluctance to abandon stranded and ecologically obsolete assets in which they have already invested.
Options valuation and pricing models have originally been devised to value financial options (Black and Scholes 1973). Arrow and Fisher (1974) were among the pioneers incorporating irreversibility and uncertainty into a model where decisions about environmental preservation need to be made. Since then the applications to natural resources have been vast in real options theory. Paddock et al. (1988), for example, focus on undeveloped oil reserves and found that, empirically, the real option valuation performs better than the traditional discounted cash flow (DCF) method. Brennan and Schwartz (1985) investigated whether and when it is optimal to take a copper mine into operation when the price of copper follows a stochastic process. Similarly, Pindyck (1980) used real options to compute the optimal exploitation strategy for an exhaustible resource, but in this case it is not only the future cash flow, but also the level of the resource reserve that can vary stochastically.
From such applications it is very clear that ignoring the option value of investment projects can lead to inefficient investment decisions on the part of investors, and empirical research has verified that inves-tors indeed take option values into account. It is also clear, however, that not all invesinves-tors are equally sophisticated. Real option models perhaps do not yet capture all the relevant aspects of investment decisions (Sanders et al. 2014). It is all the more important that policy makers understand this well before designing policies that aim to mobilise private funds for investment in green ventures.
2.3. Risk, uncertainty and information
The behaviour of venture capitalists is often influenced by their perceived risk and uncertainty. Investment in innovation as well as in adoption of new technology is also impaired by information asymmetries bet-ween investors and entrepreneurs. Entrepreneurship is the process by which “opportunities to bring into existence ’future’ goods and services are discovered created and exploited” (Venkataraman 1997, p.120). Because people possess different information and beliefs, some individuals recognise opportunities that others cannot yet see (Shane 2000). Kirzner (1973) even argues that idiosyncratic information and beliefs are necessary for opportunities to exist. Entrepreneurs may thus have difficulties in credibly conveying the expected potential and pitfalls of their innovations or may act opportunistically in the search for venture capital. Thus the match between funding and ventures becomes a market with “peaches” and “lemons” (Akerloff 1970) and adverse selection and moral hazard will lead to an inefficient funding gap (Popp et al. 2009).
2.4. The behavioural finance approach to investment decisions
5Traditional investment theory assumes rational utility maximising individuals or profit maximising firms making investment decisions based on expected return and risk. Even the more sophisticated real option approach assumes that decision makers base their decision on the stochastic properties and regularities they face. This assumption implies that all investors and entrepreneurs would respond similarly to a given project and that policies can affect this behaviour by manipulating the properties of the project alone. That is policy makers can increase adoption of greentech by increasing its NPV through internalising externalities and by reducing private technological (costs), market (revenue) and policy risks on such ven-tures. However, evidence suggests that the ways humans arrive at economic decisions are inconsistent with standard economic rationality when faced with deep uncertainty (Tversky and Kahneman 1974).
In the field of traditional or corporate finance portfolio allocations, mergers and acquisitions and capital structure decisions do not seem to conform to rational manager behaviour as per the theories. Some deviations from optimal investment behaviour are conscious behaviours explained by, for example, principal-agent problems (e.g. Arrow 1971; Pauly 1968) and biased incentive systems (e.g. Weitzman Scheme (1976)). Other deviations result from unconscious behaviour such as cognitive biases or feelings. Perceptual biases, identified by psychologists and applied by researchers in finance and related disciplines, distort judgment and the actions of investors. When making judgments under conditions of uncertainty,
5. This section has benefited immensely from the excellent overview by Montgomery (2011) of the role of psychology in the financial crisis.
Ch a p t er 2 t heor e t ic a l F r a Me wor k
people often use a number of heuristics, sometimes associated with systematic errors in how informa-tion is evaluated (Kahneman 2003). That is, unconsciously, people tend to overreact to certain types of information and underreact to other types.
For example, when assessing the probability of an event occurring, people are guided by the ease of recalling similar examples of this event. However, sometimes availability is not related to the objec-tive probability. On the financial markets, the overweighting of easily available evidence in investment decisions will lead to overreactions, whereas underreactions occur when less available information is neglected (Shleifer 2000; Barberis et al. 1998). The availability bias is sometimes combined with a ten-dency to be over-optimistic about the future, which works in the same direction when times are good and cancel out when times are bad. In terms of investment decisions, research shows that forecasts made by financial analysts exhibit this precise pattern with overoptimistic forecasts in booms and more accurate forecast in busts (Lee et al. 2008).
Anchoring and adjustment heuristics (an initial value, an anchor, is adjusted to reach the final answer) can be useful when making fast assessments. However, research shows that adjustments typically are insufficient and the selected anchoring is typically irrelevant for the estimates (Kahneman and Tversky 1974). When adding probabilities and risk, insufficient adjustment could clearly result in underestimation of the true probability.
Research shows that affects and feelings also influence judgments prior to a cognitive analysis. As a rule, people like familiar objects more than unfamiliar ones (Zajonc 2001). This phenomenon may be related to the endowment effect, which implies that people value objects they own more highly than the price for which they bought the object (Kahneman et al. 1990). In the financial market this could lead to a status quo bias and reluctance to sell financial assets once invested. The resistance to abandoning loss-making projects when large investments are sunk is an example of such endowment effects.
Other heuristics and biases that are relevant for especially long term investment decisions include hyperbolic discounting which means that preferences are characterised by a relatively high discount rate over short time horizons and a relatively low discount rate over long horizons (Laibson 1997; Loewenstein and Thaler 1989). This preference structure implies that people lack self-control. In terms of investments, a decision an investor would make today for the near future would not correspond to the decision the investor would make tomorrow for the same time period, i.e. the preferences held today would be in conflict with preferences that will be held in the future. With such inconsistent preferences, investors prefer short-term gains, for example, although long-term risks are substantial. This type of present-bias results in dynamic inefficiencies and non-optimal investment decisions over time as it emphasises front-loading of financial returns and the need for early exits and high turnaround. It is clear that such biases typically work against investment in greentech industries.
The tendency for people to search for evidence that confirms what they believe is true and to neglect evidence that rejects their beliefs is called a confirmation bias. Such biases can strengthen trends for better and for worse and work both for and against the investment in greentech venturing.
Overconfidence implies that a person’s subjective confidence in making a correct assessment is greater than the objective probability of doing so. Törngren and Montgomery (2004) provide evidence of overconfidence in the financial markets, and entrepreneurs are found to be overconfident as a rule (Dushnitysky 2010). DeMeza and Southy (1996) show that (over)optimism strengthens the conventional implications of asymmetric information, adverse selection and moral hazard.
Prospect theory (Kahneman and Tversky 1979) was developed to describe how people make decisions under uncertainty as an alternative to expected utility theory. The theory stipulates that people’s eco-nomic choices are based on the potential value of losses and gains in relation to a reference point that could vary individually and be dependent on the situation at hand. In prospect theory it is assumed that people value those gains and losses using certain heuristics that can explain certain observations on the financial markets such as investors that tend to be risk avoidant for gains and risk seeking for losses, that losses loom larger than gains and the disposition effect, which implies that investors tend to sell winning assets too soon (risk avoidance) while keeping losing assets to long. Prospect theory implies that there could be a gap between financial institutions and their clients, where the clients behave more in line with prospect theory (Montgomery 2011). This approach also implies that different agents may respond differently to the same policies. Where rational decision theory makes behaviour predictable, prospect theory introduces an element of contingency and aggregate responses become more uncertain. Behavioural finance describes observed investment behaviour and distortions from optimal, rational investment decisions. The heuristics and cognitive biases depicted above apply to all types of investment
decisions, not only to green venturing. However, there might be reasons to believe that some of the distortive mechanisms could be more pronounced for decision making in a context that includes envi-ronmental concerns. Given that deep uncertainty exists concerning ecology, technology and politics, greentech investments are more prone to the behavioural biases above. These biases can speed up or delay the adoption of greentech at the aggregate level, but either way merit careful attention in shaping policies.
2.5. Investment, regional clusters and social networks
Having discussed the relevant properties of projects, potentially subjective perceptions of risks involved, and behavioural biases of individual decision makers, we now turn to the environment in which invest-ment decisions are made. New economic geography (Krugman 1998), regional (Richardson 1969) and urban (Henderson 1997) economics have all emphasised the importance of agglomeration, clustering and spatial patterns in innovation and technological change. In entrepreneurship research the importance of geographical proximity has also been established empirically and theoretically (Audretsch and Feldman 1996). Companies in similar sectors can gather regionally, in order to take advantage of any spillover effects or transfer abilities whether it is knowledge, innovation, or financial such as efficiency advan-cements (Johansson 2005; Maskell 2001). Firms engaged in regional clusters thus have a competitive advantage against those that are not (Feldman 1994; Porter 1998). The literature on the emergence of regional clusters is vast and successful clusters such as Silicon Valley and Route 128 have attracted exten-sive research, press and policy attention. Thus, the physical environment in which investment decisions are made creates opportunities, imposes limitations and, consequently, has a profound impact on the diffusion of green technologies.6
A similarly complex interplay of relevant factors characterises the socio-economic environment. Networks may create high trust environments in which transaction costs are lowered, information is more readily available and resources are consequently easier to mobilise. Social and business net-works are ways of overcoming knowledge imbalances and information asymmetry, especially for SMEs (Granovetter 1985; Szarka 1990). Actors in a network develop long-term relationships built on trust and mutual commitment through processes of information exchange, mutual adaptations and learning (Håkansson and Johanson 1993).
Anecdotal evidence (Sanders et al. 2014; Shane and Cable 2002) suggests that networks between investors and entrepreneurs play a key role in managing risks and deep uncertainty, especially in early stage finance. Personal ties and social skills can thus be essential success factors in creating and growing new ventures. In a study by Shane and Cable (2002) it was found that social ties are indeed important for information transfer between entrepreneurs and seed-stage investors. Reputation in the network was also found to mediate the effect of social ties as an information transfer mechanism. That is, networks can help to reduce the inertia that stems from rational individual option valuation. They allow for diversification and risk pooling, reduce information asymmetries and help entrepreneurs and investors turn deep uncertainty into manageable risk by promoting the diffusion of reliable market and technology information. Finally, networks can more effectively pool lobbying efforts to optimise and stabilise the policy environment.
Individual behavioural biases, however, can both be reinforced or cancelled out in regional clus-ters and social networks. Social psychology and behavioural finance, point to important collective phenomena that may characterise the financial markets. Parallel running, i.e. the tendency to fol-low other people’s behaviour, for example with respect to investments, is called herding behaviour (Sias 2004). Experiments show that people would follow the majority herd in a stock investment situation even when the herd members made apparent wrong predictions (Andersson et al. 2009). Synchronisation of the behaviours of people is also explained by the phenomena of shared reality, which could conflict with objective reality (Echterhoff et al. 2009). A related concept is groupthink (Janis 1972), defined as a type of in-group thinking by members who try to reach consensus wit-hout critically testing or analysing, while minimising conflict. A typical symptom of groupthink is suppression of dissent, exemplified by “whistle blowers” being ignored or even punished for their lack of loyalty to group norms (Baron 2005). Group polarisation refers to a situation that could be
6. Brachert and Hornych (2011) fruitfully apply the concept of a window of local opportunity (Storper and Walker 1989; Boschma 1997) to explain the emergence of the German Solar PV cluster in Eastern Germany.
Ch a p t er 2 t heor e t ic a l F r a Me wor k
of significance in the financial world, where group decisions are more extreme, for example with respect to risk taking, than would be the case for decisions made by individual members of the group (Myers and Arenson 1972). Related and reinforcing mechanisms are group-level confirmation bias and self-censorship, which will create an illusion of consensus about how a situation is perceived. There is a rapidly expanding literature that applies behavioural economics thinking to consumer behaviour in energy and greentech markets.
2.6. Summary
In this chapter we have reviewed the extant literature on investment and entrepreneurship with a special focus on what policy makers should keep in mind when formulating their policies on greentech ven-turing. We have discussed the internalisation of environmental externalities that will create markets in which social costs and benefits coincide with the private ones that investors consider. We then discussed rational decision-making under risk and uncertainty and the option value to delay investments. Rational decision-making models predict that all market participants will respond similarly to policy stimulae. When we consider the issue of deep uncertainty, information asymmetries, the importance of beha-vioural biases and the impacts of local clusters and social networks, however, we realise that investment decisions are highly context dependent and the same policies may have a wide range of impacts under different sets of circumstances. This leads us to a conceptual model of entrepreneurial venturing and investment as depicted in Figure 2.1 below.
Figure 2.1
In the figure we see the entrepreneur and investor as human actors connected to a specific project or venture. Characteristics of the venture, e.g. technical risk, influence the objective value of the venture. Obviously, characteristics in the venture’s environment, e.g. market and policy risks, also affect this objective value in the green sphere. Personal characteristics such as information and cognitive biases, as well as the subjective perception of risks and opportunities, affect the subjective value of the project to the decision makers, the entrepreneur and investor. Then both entrepreneur and investor operate in regional clusters and social networks, represented by the blue and red spheres that potentially overlap and interact with their subjective valuation of the venture. A venture is pursued and resources are com-mitted only when all elements in this model can be brought together and key thresholds for the venturer and the investor are cleared.
Venture
Entrepreneur
Private sector investments may be needed to make a timely transition to a more sustainable energy system in Europe, but as we have argued above investment decisions in the private sector follow a logic that policy makers must respect if they wish to leverage public and mobilise private funds. This logic first dictates that an investment yields a private return, exceeding the return on alternative investments and sufficient to compensate for risk. In addition to these standard NPV and CAPM-rules and according to real option theory rational investors will time their investment optimally, structure their projects such that operational flexibility is optimal and value options to delay, scale, abandon and grow the venture in time. Finally, policy makers have to consider the relevance of behavioural biases in investment behaviour. Investors and entrepreneurs are human actors, susceptible to availability, status quo and confirmation biases and will discount hyperbolically, whereas collectively they may show herding behaviour, groupthink and over-optimism/pessimism.
This implies that for a complete characterisation of actual policies we need to assess the intended and unintended effects of the venture’s NPV, perceived risk and real option value (ROV) the effects on the entrepreneur (Ent) and investor’s (Inv) individual information sets (INF) and behaviours (BEH), and finally the information and behaviour in the network. Table 2.1 below presents this proposed characterisation in a more structured way. Note that in the last row we separate the investor and entrepreneur because policies may increase the NPV or affect the information set or behaviour of these agents differently.
Table 2.1
The next chapter presents the empirical evidence to date on green venturing and finance. This will give us an idea of how big the private activity in these fields already is and what challenge still lies before us. Confronting this with a comparative analysis of current energy and environmental policies in Sweden and the Netherlands in Chapter 4 will allow us to draw conclusions on where policy can be improved and strengthened to engage this challenge.
Venture
Actor
Network
NPV Risk ROV INF BEH INF BEH
3
Ch a p t er 3 gr een t echnol ogy v en t ur ing
Green Technology Venturing
3.1. From global trends to local circumstances
3.1.1. Definitions of the green technology sector
Green technologies include activities and products that may appear under overlapping headings such as cleantech, clean energy, renewable energy, green goods, environmental goods or low carbon goods and services. Whereas the finance sector seems to focus on the cleantech, clean energy or renewably energy sectors, international and national statistics usually categorize markets in environmental, green or low-carbon goods and services.
Clean technology, or “cleantech”, does not have a clear-cut definition but is generally including all activities intended to reduce environmental impact and the use of natural resources.7 Eurostat (2009)
specify the environmental sector, in data labelled the environmental goods and services sector, as con-sisting of a heterogeneous set of producers of technologies, goods and services that:
• Measure, control, restore, prevent, treat, minimise, research and sensitise environmental damages to air, water and soil as well as problems related to waste, noise, biodiversity and landscapes. This includes ‘cleaner’ technologies, goods and services that prevent or minimise pollution.
• Measure, control, restore, prevent, minimise, research and sensitise resource depletion. This results mainly in resource-efficient technologies, goods and services that minimise the use of natural resources.
Even if the EU member states use the same definition of environmental goods and services, the data collection in practice does not necessarily conform, which presents obstacles when making international comparisons.
The UK has designed its own definition, termed the Low Carbon Environmental Goods and Services (LCEGS) sector, capturing a range of activities with the purpose of reducing environmental impact, inclu-ding subsectors more or less corresponinclu-ding to the cleantech segment (LCEGS 2013).8
7. As an example, the Cleantech Group, a consultancy providing cleantech market intelligence, collects data from 18 industry segments including transportations, water and wastewater, wind, recycling and waste, smart grid, solar, geothermal, hydro and marine power, nuclear, energy efficiency, energy storage, fuel cells and hydrogen, biofuels and biochemical, biomass generation, conventional fuels, advanced materials, agriculture and forestry and air. Clean energy and renewable energy are sub-sectors in the cleantech sector, excluding for example wastewater, waste, recycling and sometimes investments in energy efficiency.
8. Subsectors include Air Pollution, Contaminated Land Reclamation and Remediation, Environmental Consultancy and Related Services, Environmental Monitoring, Instrumentation and Analysis, Marine Pollution Control, Noise and Vibration control, Recovery and Recycling, Waste Management, Water Supply and Waste Water Treatment, Additional Energy sources, Alternative Fuel Vehicle, Alternative Fuels, Nuclear Power, Building Technologies, Carbon Capture and Storage, Carbon Finance, Energy Management, Biomass, Geothermal, Hydro, Photovoltaic, Renewable consulting, Wave and Tidal, Wind.
The US collects statistics termed green goods and services, defined as goods and services produced by an establishment that benefit the environment or conserve natural resources. Green goods and services fall into one or more of the following five groups: (1) production of energy from renewable sources; (2) energy efficiency; (3) pollution reduction and removal, greenhouse gas reduction, and recycling and reuse; (4) natural resources conservation; and (5) environmental compliance, education and training, and public awareness (BLS 2012).
The purpose of this chapter is to give an overview of the development and funding of green tech-nology sectors. Definitions and data collection practices differ, and in addition constantly evolve as new activities are identified or reach the market. Even if this section reports data under various labels, however, it still uncovers important trends and developments. We first discuss the sector in general, then turn to investment and finally start-up and growth stage investments, also zooming in from the global level to Sweden and the Netherlands.
3.1.2. The green technology sector
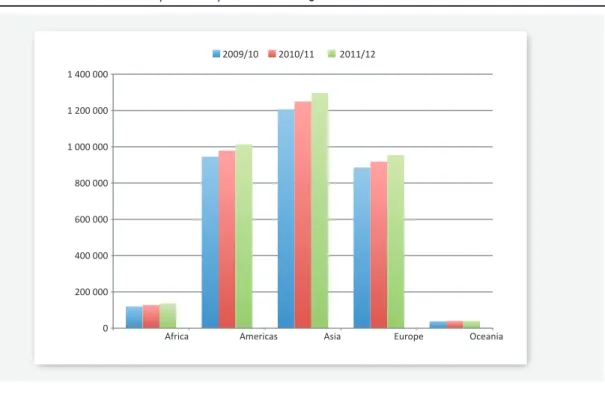
Using sales of low carbon environmental goods and services as a proxy for the economic activity of the green sector, Figure 3.1 shows the recent developments distributed over global regions. In all markets, global sales have increased over the last three years, with Asia accounting for 38%, followed by the Americas (29%) and Europe (28%).
Figure 3.1 Global Sales 2009/10 – 2011/12, low carbon goods and services sector, £M
Source: LCGC (2013)
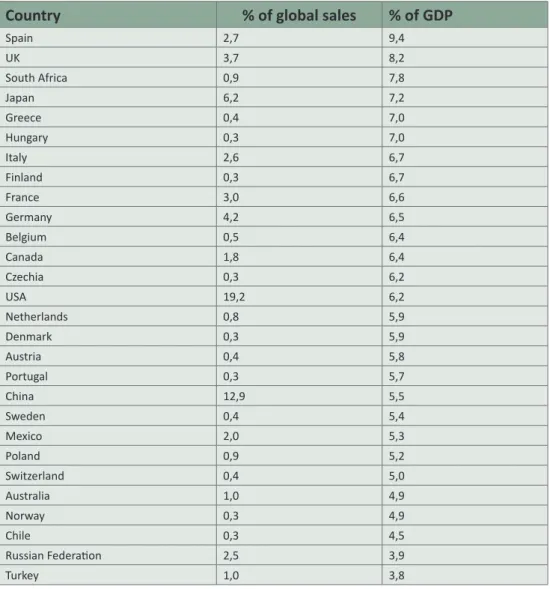
Table 3.1, the breakdown of sales to country level, shows that the US accounts for almost one fifth of glo-bal sales, followed by China (13%), Japan (6%), India (6%) and Germany (4%). The Netherlands are ranked as 24th with 0.8% of the global total, whereas Sweden is 34th with 0.4% of the global total. Relating sales to GDP (Tabler 3.2), the ranking changes with Spain in the lead (9.4%), followed by the UK (8%), South Africa (8%) and Japan, Greece, Hungary, Italy, Finland accounting for around 7%. LCGC sales account for 5.9% of the GDP in the Netherlands and 5.4% in Sweden.
1 400 000 1 200 000 1 000 000 800 000 600 000 400 000 200 000 0 2009/10
Africa Americas Asia Europe Oceania
Ch a p t er 3 gr een t echnol ogy v en t ur ing
Table 3.1 Sales 2011/12, low carbon goods and services sector
Source: LCGC (2013)
Country Sales £m Rank % of Total USA 660 760 1 19,2 China 444 324 2 12,9 Japan 213 295 3 6,2 India 210 815 4 6,1 Germany 145 267 5 4,2 UK 128 141 6 3,7 France 104 201 7 3,0 Brazil 103 583 8 3,0 Spain 92 136 9 2,7 Italy 89 485 10 2,6 Russian Federati on 87 327 11 2,5 Mexico 70 225 12 2,0 South Korea 61 651 13 1,8 Canada 61 146 14 1,8 Indonesia 54 070 15 1,6 Taiwan 36 327 16 1,1 Turkey 33 827 17 1,0 Australia 33 804 18 1,0 Iran 33 496 19 1,0 Thailand 33 228 20 1,0 Argenti na 31 087 21 0,9 Poland 29 526 22 0,9 South Africa 29 289 23 0,9 Netherlands 28 056 24 0,8 Philippines 27 243 25 0,8 Saudi Arabia 21 736 26 0,6 Pakistan 21 559 27 0,6 Egypt 20 099 28 0,6 Ukraine 20 062 29 0,6 Colombia 19 726 30 0,6 Belgium 18 826 31 0,5 Bangladesh 18 211 32 0,5 Vietnam 17 793 33 0,5 Sweden 14 675 34 0,4 Hong Kong 14 431 35 0,4 Malaysia 14 412 36 0,4 Austria 14 276 37 0,4 Switzerland 14 128 38 0,4 Algeria 13 554 39 0,4 Greece 13 260 40 0,4 Romania 11 955 41 0,3 Chile 11 700 42 0,3 Czechia 11 444 43 0,3 Norway 10 583 44 0,3 Peru 10 224 45 0,3 Portugal 10 084 46 0,3 Hungary 10 081 47 0,3 Venezuela 10 027 48 0,3 Finland 9 131 49 0,3 Denmark 9 117 50 0,3
Table 3.2 Sales 2011/12, related to global sales and GDP, low carbon goods and services sector
Source: LCGC (2013) and OECD.stat
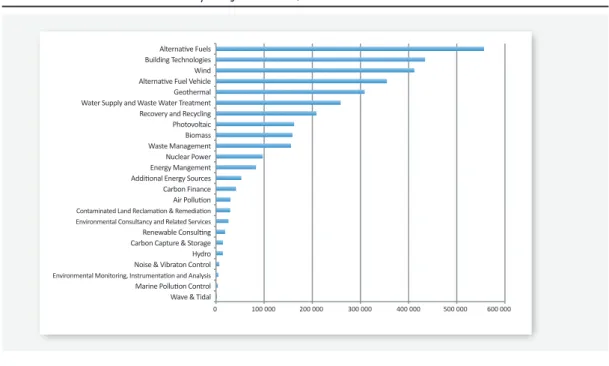
Figure 3.2 shows how global sales are distributed across the sub sectors for 2011/12, the largest sub sectors being Alternative Fuels (16%), Building Technologies (13%), Wind (12%), Alternative Fuel and Vehicles (10%), Geothermal (9%) and Water Supply and Waste Water Treatment (8%).
Country
% of global sales
% of GDP
Spain 2,7 9,4 UK 3,7 8,2 South Africa 0,9 7,8 Japan 6,2 7,2 Greece 0,4 7,0 Hungary 0,3 7,0 Italy 2,6 6,7 Finland 0,3 6,7 France 3,0 6,6 Germany 4,2 6,5 Belgium 0,5 6,4 Canada 1,8 6,4 Czechia 0,3 6,2 USA 19,2 6,2 Netherlands 0,8 5,9 Denmark 0,3 5,9 Austria 0,4 5,8 Portugal 0,3 5,7 China 12,9 5,5 Sweden 0,4 5,4 Mexico 2,0 5,3 Poland 0,9 5,2 Switzerland 0,4 5,0 Australia 1,0 4,9 Norway 0,3 4,9 Chile 0,3 4,5 Russian Federati on 2,5 3,9 Turkey 1,0 3,8
Ch a p t er 3 gr een t echnol ogy v en t ur ing
Figure 3.2 Global LCEGS Sales 2011/12 by sub sector, £M
Source: LCGC (2013)
Figure 3.3 Energy technologies PCT applications designated to the European Patent Office, (2001-2009),
number
Source: Eurostat [pat_ep_nrgpct]
Nuclear power accounts for 2.8% of the global total. Of course one can have a discussion about whether nuclear power should be included in cleantech, but however one defines and cuts the
Alternative Fuels Building Technologies Wind Alternative Fuel Vehicle Geothermal Water Supply and Waste Water Treatment Recovery and Recycling Photovoltaic Biomass Waste Management Nuclear Power Energy Mangement Additional Energy Sources Carbon Finance Air Pollution
Contaminated Land Reclamation & Remediation Environmental Consultancy and Related Services
Renewable Consulting Carbon Capture & Storage Hydro Noise & Vibraton Control
Environmental Monitoring, Instrumentation and Analysis
Marine Pollution Control Wave & Tidal
0 100 000 200 000 300 000 400 000 500 000 600 000 1 800,00 1 600,00 1 400,00 1 200,00 1 000,00 800,00 600,00 400,00 200,00 0,00 2001 2002 2003 2004 2005 2006 2007 2008 2009
Sweden Netherlands United Kingdom Germany Japan United States European Union (27 countries)
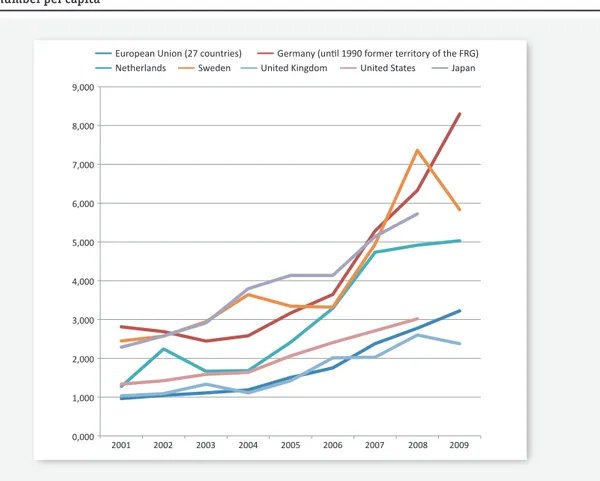
data, the general trend is that this is a growing sector, even in years of global recession, and this growth is concentrated in alternative fuels, construction and renewable electricity produc-tion. These sectors also show a strong and growing tendency to develop new technology and innovations. Innovative activity measured as patent applications designated to the European Patent Office for technologies or applications for mitigation or adaptation against climate change are depicted in Figure 3.3 and in Figure 3.4. Germany, Sweden, Japan and the Netherlands reveal higher intensity in terms of patents per capita, whereas the US, Japan and Germany obviously produce more patents in absolute terms. From the figures it is also clear that the European Union as a whole is still lagging behind the US and Japan when it comes to cleantech patenting.
Figure 3.4 Energy technologies PCT applications designated to the European Patent Office, (2001-2009),
number per capita
Source: Eurostat [pat_ep_nrgpct]
3.1.3. Investment in the green technology sector
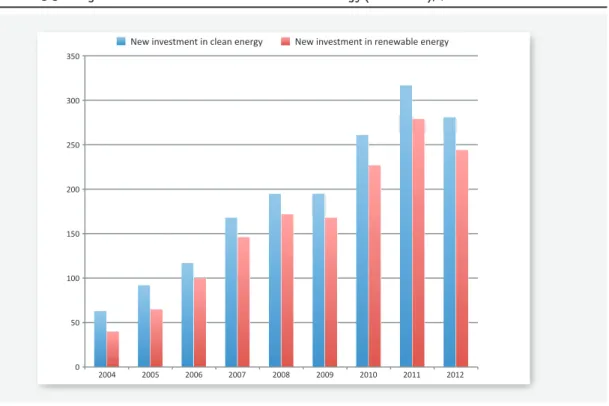
Production and sales typically follow investment in production capacity. In 2012, a shift in the balance of renewable energy investments worldwide occurred, with the centre for clean energy investment shifting from West to East. China passed the US as the major clean energy investor and the EU lost the high ground it held. While investments for former early-movers such as Germany, Italy, the UK and Spain, fell, there were sharp increases in investment from several emerging economies, including South Africa, Morocco, Mexico, Chile and Kenya. Globally, albeit still the second-highest absolute amount ever, total investment in renewable energy was down 12% in 2012, where crisis-hit developed economies accounted for a massive 29% reduction whereas developing economies experienced a 19% increase (Frankfurt School-UNEP Centre/BNEF, 2013). Low global energy prices due to the global recession and increasing pressure on public budgets in developed economies have clearly reduced the incentives to invest in energy transition technologies.
9,000 8,000 7,000 6,000 5,000 4,000 3,000 2,000 1,000 0,000 2001 2002 2003 2004 2005 2006 2007 2008 2009
European Union (27 countries) Germany (until 1990 former territory of the FRG)
Ch a p t er 3 gr een t echnol ogy v en t ur ing
Figure 3.5 New global investment in clean and renewable energy (2004-2012), $BN
Source: Frankfurt School-UNEP Centre/BNEF (2013) and BNEF (2013)
Figure 3.6 New global investment in renewable energy by geography (2004-2012), $BN
Source: Frankfurt School-UNEP Centre/BNEF (2013) 350 300 250 200 150 100 50 0 2004 2005 2006 2007 2008 2009 2010 2011 2012
New investment in renewable energy New investment in clean energy
300 250 200 150 100 50 0 2004 2005 2006 2007 2008 2009 2010 2011 2012
ASOC (excl. China & India) India China Middle East & Africa Europe AMER (excl. US & Brazil) Brazil United States
From Figure 3.6 we see these trends clearly illustrated. China and the developing world are increasing their share and investment volumes, whereas in Europe and the US the crisis has clearly taken its toll.
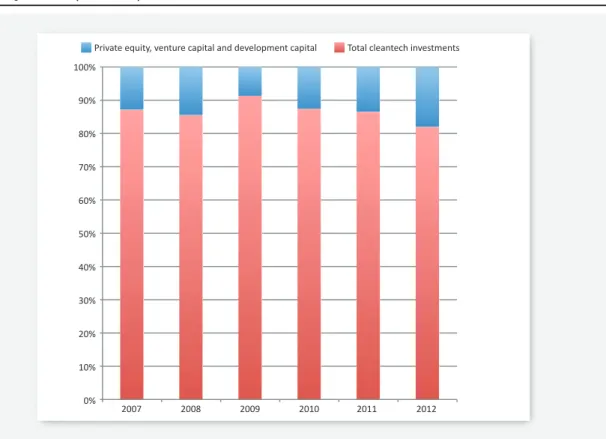
The role of venture capital, private equity, development capital and M&A investment has fluctuated in the clean-tech sector, hovering between 10 and 20% of the market total (Figure 3.7). This strongly sug-gests that much of the investment is in early stage activity. Of course this makes sense and is consistent with the sector being in its infancy, both technologically and commercially.
Figure 3.7 Global investments in cleantech companies, including VC, PE, development capital, M&A,
buy-outs etc (2007-2012), %
Source: ZEPHYR published by BvDEP, ZephyrAnnual Cleantech Report 2012
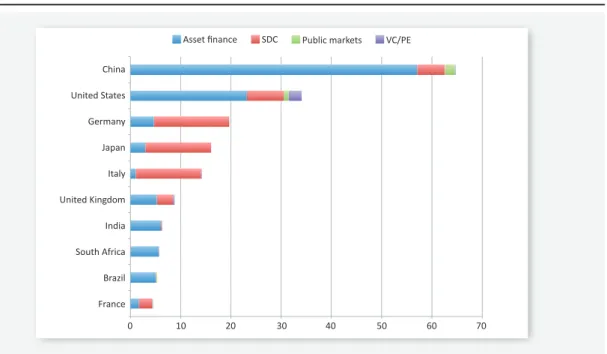
Figure 3.8 shows that asset finance is clearly dominant in share, with investments in small-distributed capacity being second. Investments in the early stages, such as venture capital, government R&D and corporate R&D, however, are a small share but perhaps a more important part of overall investments. As Figure 3.9 shows we also see a clear pattern in types of investments across countries. The US is the leader, and the only country with significant investment levels in venture capital and private equity financing, accounting for 78% of the G-20 total (Pew 2012). In Germany, Japan and Italy small-scale pro-jects dominate overall investments whereas China is clearly focusing on asset finance. This is consistent with a global specialisation pattern in which Europe invests in small demonstration projects and US investors are interested in financing the early stages of commercialising technologies, whereas China is scaling up more mature technology. As European countries compete at the global technology frontier and seem well positioned to develop the cleantech sector into a new engine of growth, we shall now turn to early stage investment.
100% 90% 80% 70% 60% 50% 40% 30% 20% 10% 0% 2007 2008 2009 2010 2011 2012 Total cleantech investments Private equity, venture capital and development capital
Ch a p t er 3 gr een t echnol ogy v en t ur ing
Figure 3.8 VC/PE, public markets, and asset finance investment in renewable energy (2004-2013), $BN
Source: Frankfurt School-UNEP Centre/BNEF (2013)
Figure 3.9. New Investment in renewable energy by top ten country and asset class, 2012, $BN
Source: Frankfurt School-UNEP Centre/BNEF (2013)
3.1.4. Early stage investment in the cleantech sector
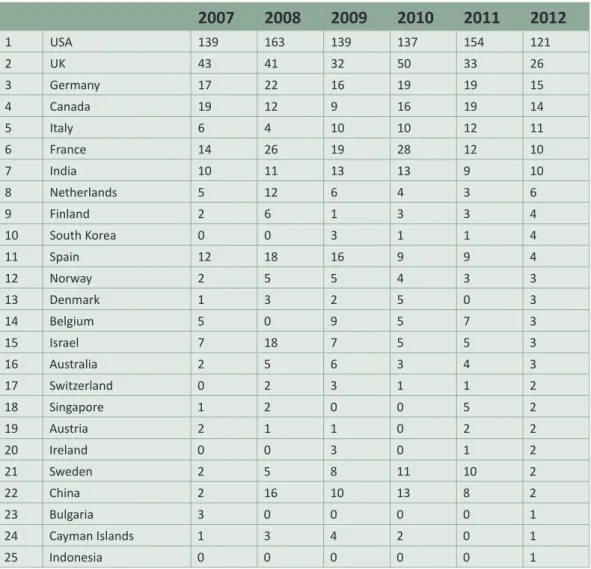
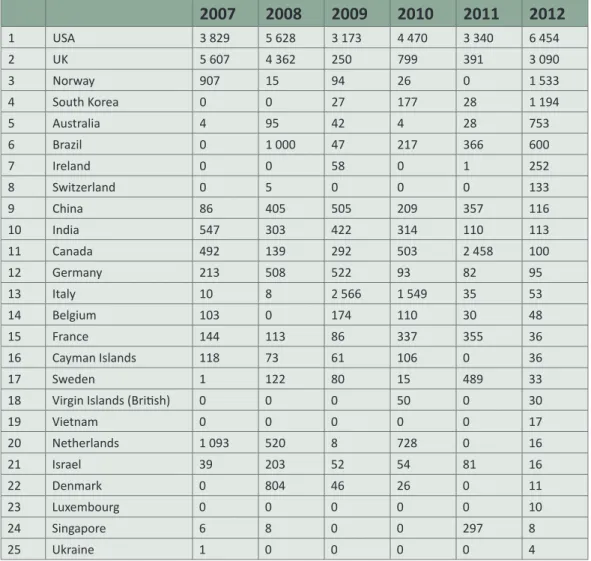
As Europe seems to be lagging behind in financing, especially the early commercialisation stages, a closer look at such investments is warranted, even if they account for only a small share of global cleantech investments. Table 3.3 shows the volume and value of private equity, venture capital and development capital deals. The US-based cleantech companies were the most valuable and most frequently targeted by (mostly US) private equity and venture capital investors in 2012. Second came the UK, before Norway and South Korea. By volume, China ranked second, followed by the UK and Canada. The Netherlands ranked 8 by volume and 20 by value, whereas Sweden ranked 21 and 17 by volume and value, respectively. This shows that Dutch and Swedish ventures apparently represent attractive targets for investment, but it is hard to raise such funding at home.
300 250 200 150 100 50 0 2004 2005 2006 2007 2008 2009 2010 2011 2012
Corporate R&D Government R&D VC/PE Public markets
Small distributed capacity Asset finance
Asset finance SDC Public markets VC/PE
China United States Germany Japan Italy United Kingdom India South Africa Brazil France 0 10 20 30 40 50 60 70
Table 3.3 Number of VC, PE and development capital deals targeting cleantech companies (2007-2012), top 25, $M
Source: ZEPHYR published by BvDEP, ZephyrAnnual Cleantech Report 2012
Focussing on Europe Figure 3.10 shows all private equity investments in the energy and environmental sector in Europe by stage. Looking at total private equity investments, including new investments (ven-ture capital and growth capital), and funds in circulation (buyout, rescue/turnaround, replacement capital), France was in the lead, followed by Spain, the UK, Norway and Germany. The Spanish green companies, however, attracted most growth capital, whereas most venture capital was invested in the UK. And while total new investments in Sweden and in the Netherlands are of similar magnitude, the amount of new venture capital is almost twice the size in the Netherlands. This is very different when we consider all venture capital investments. Figures 3.11 and 3.12 show the value of all new private equity investments, in all sectors, by stage, in Sweden and in the Netherlands. Figure 3.13 and 3.14 show the volume of all new private equity investments by stage in Sweden and in the Netherlands. It is interesting to note from these figures that Sweden typically has both a larger number of deals and a larger total value of deals. The average deal size fluctuates.
2007
2008
2009
2010
2011
2012
1 USA 139 163 139 137 154 121 2 UK 43 41 32 50 33 26 3 Germany 17 22 16 19 19 15 4 Canada 19 12 9 16 19 14 5 Italy 6 4 10 10 12 11 6 France 14 26 19 28 12 10 7 India 10 11 13 13 9 10 8 Netherlands 5 12 6 4 3 6 9 Finland 2 6 1 3 3 4 10 South Korea 0 0 3 1 1 4 11 Spain 12 18 16 9 9 4 12 Norway 2 5 5 4 3 3 13 Denmark 1 3 2 5 0 3 14 Belgium 5 0 9 5 7 3 15 Israel 7 18 7 5 5 3 16 Australia 2 5 6 3 4 3 17 Switzerland 0 2 3 1 1 2 18 Singapore 1 2 0 0 5 2 19 Austria 2 1 1 0 2 2 20 Ireland 0 0 3 0 1 2 21 Sweden 2 5 8 11 10 2 22 China 2 16 10 13 8 2 23 Bulgaria 3 0 0 0 0 1 24 Cayman Islands 1 3 4 2 0 1 25 Indonesia 0 0 0 0 0 1Ch a p t er 3 gr een t echnol ogy v en t ur ing
Table 3.4 Aggregate deal value of VC, PE and development capital targeting clean-tech companies (2007-2012), top 25, $M
Source: ZEPHYR published by BvDEP, ZephyrAnnual Cleantech Report 2012
From this one would conclude that Sweden has a more active and larger home supply of early stage finan-ce than the Netherlands, but somehow fails to mobilise these resourfinan-ces for the cleantech ventures to the same extent. That conclusion obviously also has important implications for policy. If the aim is to mobilise (more) private funding for early stage and growth finance in the cleantech sectors, Sweden should focus on attracting the attention of already active private equity investors, whereas the Netherlands may want to focus on mobilising more private equity in general.
Figure 3.15 compares the sources of funding for venture funds in the Netherlands and Sweden. Whereas the bulk of venture fundraising is from pension funds and governmental agencies in Sweden, insurance companies, family offices and corporate investors raise the bulk of Dutch venture capital. Given the vast untapped reserves of Dutch pension funds this suggests the Netherlands can mobilise much more private equity capital if policies were to be designed to accommodate pension funds engaging more in such investments. For Sweden one might conclude that the involvement of insurance, corporate and family partners can help direct available funds into the cleantech sector.
2007
2008
2009
2010
2011
2012
1 USA 3 829 5 628 3 173 4 470 3 340 6 454 2 UK 5 607 4 362 250 799 391 3 090 3 Norway 907 15 94 26 0 1 533 4 South Korea 0 0 27 177 28 1 194 5 Australia 4 95 42 4 28 753 6 Brazil 0 1 000 47 217 366 600 7 Ireland 0 0 58 0 1 252 8 Switzerland 0 5 0 0 0 133 9 China 86 405 505 209 357 116 10 India 547 303 422 314 110 113 11 Canada 492 139 292 503 2 458 100 12 Germany 213 508 522 93 82 95 13 Italy 10 8 2 566 1 549 35 53 14 Belgium 103 0 174 110 30 48 15 France 144 113 86 337 355 36 16 Cayman Islands 118 73 61 106 0 36 17 Sweden 1 122 80 15 489 3318 Virgin Islands (Briti sh) 0 0 0 50 0 30
19 Vietnam 0 0 0 0 0 17 20 Netherlands 1 093 520 8 728 0 16 21 Israel 39 203 52 54 81 16 22 Denmark 0 804 46 26 0 11 23 Luxembourg 0 0 0 0 0 10 24 Singapore 6 8 0 0 297 8 25 Ukraine 1 0 0 0 0 4
Figure 3.10 New investments (private equity) invested in the Energy and Environment sector (by country
of portfolio country) in Europe by stage, 2012, €k
Source: EVCA/PEREP_Analytics
Figure 3.11 Value of new private equity investments by country of private equity firm and by stages, all
sectors (2007-2012), the Netherlands, €k
Source: EVCA/PEREP_Analytics
Venture Growth Rescue/Turnaround/Replacement capital France Spain United Kingdom Norway Germany Netherland Sweden Belgium Finland Poland Hungary Italy Romania Portugal Denmark Baltics Austria Switzerland Ireland Ukraine Greece Czech Bulgaria 0 50000 100000 150000 200000 250000 300000 350000 400000 450000 500000 Buyout
Growth Later stage venture Start-up Seed
750000 650000 550000 450000 350000 250000 150000 50000 -50000 2007 2008 2009 2010 2011 2012
Ch a p t er 3 gr een t echnol ogy v en t ur ing
Figure 3.12. Value of new private equity investments by country of private equity firm and by stages, all
sectors (2007-2012), Sweden,€k
Source: EVCA/PEREP_Analytics
Figure 3.13 Volume of new private equity investments by country of private equity firm and by stages, all
sectors (2007-2012), the Netherlands,€k
Source: EVCA/PEREP_Analytics
Growth Later stage venture Start-up Seed
750000 650000 550000 450000 350000 250000 150000 50000 -50000 2007 2008 2009 2010 2011 2012
Growth Later stage venture Start-up Seed
500 450 400 350 300 250 200 150 100 50 0 2007 2008 2009 2010 2011 2012
Figure 3.14 Volume of new private equity investments by country of private equity firm and by stages, all
sectors (2007-2012), Sweden, €k
Source: EVCA/PEREP_Analytics
Figure 3.15 Venture funds raised by investor type, all sectors, the Netherlands and Sweden, 2012, €k
Source: EVCA/PEREP_Analytics
Growth Later stage venture Start-up Seed
500 450 400 350 300 250 200 150 100 50 0 2007 2008 2009 2010 2011 2012 Sweden Netherlands Unclassified Sovereign wealth funds Private individuals Pension funds Other asset managers (including PE houses other than fund of funds) Insurance companies Government agencies Fund of funds Family offices Endowments and foundations Corporate investors Capital markets Banks Academic institutions