Kalmar ECO-TECH '07 KALMAR, SWEDEN, November 26-28, 2007
ASSESSING THE RISK OF CONTAMINANT
SPREADING THROUGH SEDIMENT
PRODUCTION IN A TROPICAL ENVIRONMENT
Indrani Pal
Dr. Abir Al-Tabbaa
University of Cambridge, UK
ABSTRACTAgricultural sites have been of great concern for decades due to rainfall-induced soil detachment and transport of sediment materials, and their associated chemicals and/or nutrients, away from those sites during wet days resulting in significant environmental problems. The same phenomena could also be expected from bare contaminated site exposed for a long time before remediation. Exposed topsoil material which is disturbed by various land operations is much more prone to erosion. All of these problems are more pronounced when such land is situated in a tropical environment and especially during rainy seasons. This is because tropical storms are quite intense in nature, frequent and variable. Hence, contaminated sites in those regions should be given the same importance as agricultural land when addressing problems resulting from soil erosion. This paper attempts to highlight such problems through studying the impact of tropical monsoon data collected from India on the risk of soil erosion which could also be relevant to assessing risk of contaminant spreading from surface soil through erosion and transportation of the detached material to downstream. The most well known and most frequently used soil loss model, the Revised Universal Soil Loss Equation 2 (RUSLE2), was used for that purpose. It was found that soil erosion in this region is very high and does go far beyond the threshold suggested by the USDA and that the erosion process is very much sensitive to the climatological variabilities.
KEYWORDS
Monsoon; Soil Erosion; RUSLE2. I INTRODUCTION
The large number of raindrops in a rainstorm is the primary source of energy for the damaging floods and water-induced soil erosion problems in many locations. Erosion leads to environmental damage through on-site and off-site effects. The off-site effects arise from the production of sediment that is one of the major pollutants of our environment and through the chemicals adsorbed to it. Loss of soil from contaminated sites, construction sites, road banks, pipeline corridors, and old mining sites may also contribute to unwanted downstream damages; for example, contaminating surrounding land, watercourses, lakes and drains -resulting in significant environmental pollution [I], because such site activities result in disturbed and bare ground which is most vulnerable to soil erosion. Such phenomena are particularly problematic in tropical countries like India where soil erosion due to high monsoon rainfall and devastating floods taking place each year is more than a threshold value (4.5-11.2 ton/ha) [2, 3].
Of India's 328 million ha of land area, about 130 million ha (45% of total geographical area) is affected by serious soil erosion [4]; the most severe effect of which is found on lateritic soils especially because these kinds of soils are found in the regions of high monsoon rainfall such as Kerala and West Bengal and in the absence of soil conservation measures, Lateritic soils occupy around 72 million ha of land, lose around 40 ton/ha of top soil annually, Therefore, contaminated sites which are made of this type of soil and kept absolutely bare, exposed to high monsoon rainfall, and without any soil conservation practice should also be assessed whether any risk of surface soil erosion is present,
This study investigates the impact of monsoon rainfall on soil erosion through quantitative determination of soil erosion from bare lateritic soil in a region in Kerala ( I L5N, 75,5E), the extreme South Western state in India, The sensitivity of the soil detachment to variable monsoon rainfall quantity and intensity and possible implications of the effect of recent monsoonal climate change to future soil erosion are also studied. For the purpose of soil erosion, the Revised Universal Soil Loss Equation 2 (RUSLE2) was found to be the most useful for the region of interest, Full details of this study can be found elsewhere [5].
2 DESCRIPTION OF MODEL AND METHODOLOGY
RUSLE2 estimates rill and interrill erosion along a single overland flow path and integrating a number of factors that can be determined from available meteorological and site-specific data as the product of six factors. RUSLE2 is landuse independent and based mainly on the basic features on the soil surface and in the upper layer of soil and related factors affecting rill and interrill erosion. RUSLE2 computes fundamental net detachments of soil materials on a daily basis using the following equation:
ae= r k l S c p (I)
where: ae= daily net detachment expressed in ton/ha; when summed up gives the annual soil
detachment 'A' which when averaged over a number of years gives the average annual detachment 'Aa'; r = daily rainfall-runoff erosivity factor expressed in MJ-mm/ha-hr; when
summed up for a year gives the annual value 'R' which when averaged over a number of years gives the average annual erosivity 'Ra '; k daily soil erodibility factor expressed in=
= = =
ton/ha/(MJ-mm/ha-hr); I daily slope length factor; S annual slope steepness factor ; c daily cover management factor; p = daily supporting practices factor. I, S, c and p have no units.
2. I Rainfall erosivity factor
Rainfall-induced erosion results from the expenditure of energy of falling raindrops and flowing water when these two agents act either singularly or together. The quantity of soi I detachment by raindrop splash and transportation by runoff depends on rainfall characteristics such as size and velocity of raindrops, number of raindrops, intensity of rainfall, etc [6], The potential ability of rainfall to cause erosion is tern,ed as rainfall erosivity. Erosivity varies considerably over space and time, Among various parameters documented in the literature, a 'rational' parameter, total kinetic energy of rainstorm, explaining the ability of rainfall to cause erosion has been considered here because energy is a work process involving expenditure of energy in breaking down and splashing of soil particles,
Extensive regression analyses of basic soil-loss data for more than 30 years showed that when factors other than rainfall are held constant, storn1 soil losses are directly proportional to the
(3)
(5)
Kalmar ECO-TECH '07 KALMAR, SWEDEN, November 26-28, 2007
product value of two rainstonn characteristics: total kinetic energy of the stonn and its maximum 30-minutes rainfall intensity (in 'mm/hr'); as designated by EJ30 [7], Both components of the kinetic energy of rain -mass and velocity -are related to the diameter of the raindrops (assumed to be a sphere) because mass and velocity are functions of the raindrop volume (rrD3/6, where D is the diameter) and surface friction (surface area = rrD2), respectively, Raindrop sizes bear a certain relationship to the intensity of rainfall and are therefore related to the quantity of rain falling within a given period of time [8, 9]. Therefore, the nonnal method of calculating rainfall kinetic energy is from experimental record of the relationships between kinetic energy per mm of stonn rainfall (or referred to as unit energy of rainfall or 'e') with hourly stonn intensity, The kinetic energy values for rainfall recommended and used for RUSLE2 were based on the unit energy expression derived by [IO], which is as follows.
e = 0.29 [I -0,72 exp (- 0,05 I)) (2)
where: e = kinetic energy in MJ/ha-mm of rainfall and I = rainfall intensity in mm/hr, The assumption was that in any one locality the distribution of a certain raindrop size, and hence kinetic energy is characteristic of certain intensity and that equal increments of rainfall depth at the same intensity will have similar energies, In all the 'e-1' relationships, 'I' for a particular increment of a rainfall event can be calculated using the relationship:
I= l'.V / 1'.t
where: I'.V = depth of rain falling during that increment (mm) and 1'.t = duration of the increment (hours) over which rainfall intensity is considered to be constant,
The total stom1 kinetic energy (E) in MJ/ha is calculated using the relationship:
E=e, l'.Y (4)
In order to calculate 'r' (MJ-mm/ha-hr), the stom1 kinetic energies (E) in a day are multiplied by the corresponding maximum 30-minutes rainfall intensity, which hence ideally requires JO-minutes storm rainfall data. The expression for 'r' is as follows:
r = L(E),(1 10 ),
1=]
where: lio = maximum 30-minutes rainfall intensity (mm/hr); 1 index of the number of
stonns in each day; d = number of stonns in a day, 2,2 Soil erodibility factor
The average daily soil erodibility factor 'k' is the major soil variable in RUSLE2, which is defined as the ease with which soil is detached by splash during rainfall or by surface flow or both, Based on the physical characteristics of a soil, 'k' is also an estimate of the ability of soils to resist erosion, Various physical, chemical and mineralogical soil properties and their interactions affect 'k' values, Generally, soils with faster infiltration rates, higher levels of organic and improved soil structure have a greater resistance to erosion whereas soils with higher content of intem1ediate particle size fractions such as very fine sand and silt are easily eroded [ 11, 12], 'k' in the RUSLE2 is the rate of soil loss per rainfall erosion index unit with 'I', 'S', 'c' and 'p' factors equal to 1,0, representing effects of the inherent soil properties and local climate on soil erodibility as defined in RUSLE2, Of several attempts which have been made to correlate measured erodibility values to soil properties that are considered the only
detenninants of the erodibility factor, the most frequently cited relationship is the soil erodibility nomograph [13]. The 'RUSLE2 modified soil erodibility nomograph' has been used for this study for it can reliably be used to estimate 'k' values for most situations and including disturbed soils. Lateritic soil, which is mostly found in Kerala, is considered for this study. This soil comprises of a texture of loam with high silt content.
2.3 Topographical factor
Soil loss increases with increase in slope length and steepness. Runoff that accumulates on long slopes is highly erodible, especially when it flows through steep slopes. Thus, slope length and steepness represent how topography affects soil erosion. Slope shape also affects erosion by evidence of deposition that occurs on concave slopes. Slope length is considered by the slope length factor (!) in RUSLE2. Slope length is defined as the horizontal distance from the origin of overland flow to the point where either (i) soil starts depositing where the slope gradient decreases or (ii) rainwater flows through a well defined channel [14]. The slope steepness factor (S) reflects the influence of slope gradient (0) on erosion. These factors are detennined by the RUSLE2 depending on the user selected slope length, slope steepness, ground cover and the rill to interrill soil erodibility ratios (function of soil texture).
2.4 Cover management factor
The cover management factor 'c' in RUSLE2 is the ratio of soil loss from an area with specified cover management condition to soil loss from a unit plot. This factor represents how landuse and management affect soil loss. The parameters which are universally important in the impact of cover management systems on erosion and used in RUSLE2 to detem1ine cover management factor are: above ground vegetative material (both live or dead); ground cover directly in contact with the soil surface (rock fragments, live/dead plant material, external mulch or manure applied, manufactured erosion control products); soil-surface roughness and ridge height created randomly by mechanical disturbance; soil biomass and consolidation introduced by the mechanical disturbance or roots grown there; and in some cases impact of antecedent soil moisture on reduction of runoff. All of these parameters are taken into account as sub-factors to detennine 'c' by RUSLE2 depending on the data one inputs.
2.5 Support practice factor
The support practice factor (p) in RUSLE2 is to take the erosion control practices, if any, into account in the erosion computation. These support practices affect erosion by modifying flow pattern, direction of surface runoff and reducing its transport capacity resulting in deposition and reduced erosion [ 15]. The 'p' value in RUSLE2 is assumed equal to l for the purpose of this research assuming no erosion control 'practice' available for the land, meaning that the land is always tilled 'up and downslope', making ridges run parallel to overland flow path representing the worst case scenario.
3 POSSIBLE CONTAMINANT ASSOCIATION WITH ERODED SOILS
Applying the principle of mass conservation, and assuming that contaminant attachment to soil is unifonn and that the contaminants are sorbed onto the soil, rather than being in the soil water, the contaminant association with eroded soils is directly proportional to the soil quantity detached. The relation is as in Equation 6 for a known contaminant concentration:
3
Kalmar ECO-TECH '07 KALMAR, SWEDEN, November 26-28, 2007
where: M, = the mass of contaminants released via sediment production (kg/ha), C, = contaminant concentration in the site soil material (mg/kg), A = annual soil loss estimated by
3
RUSLE2 (ton/ha), and 10- = unit conversion factor. Therefore, contaminant erosion is also directly proportional to the rainfall erosivity values at any location and also depends on other parameters affecting erosion,
4 DESCRIPTION OF THE DATA
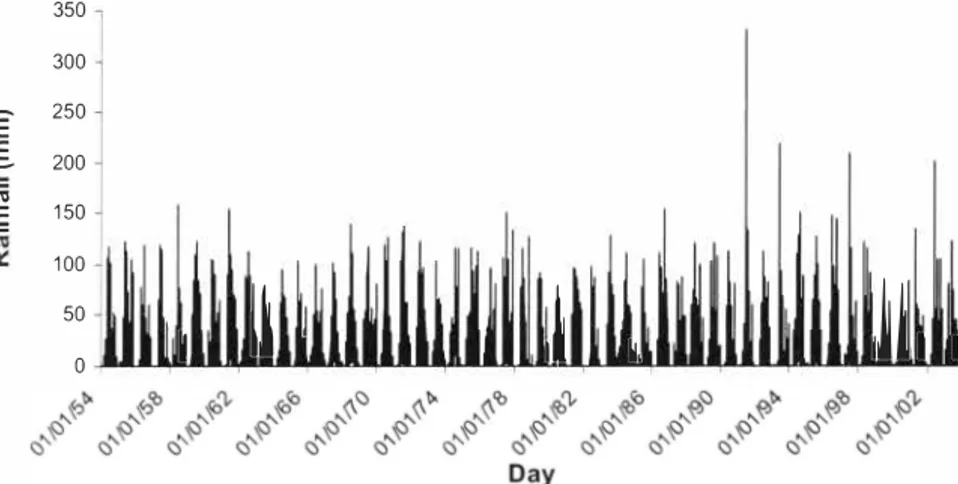
50-years of daily rainfall data were collected from the Indian Meteorological Department, which is shown in Figure I. Figure 2 shows a frequency distribution of the 24-hour maximum precipitations which occurred in each of the 50 years. It is only since the ! 990's that the 24-hour maximum precipitation with magnitude of more than 200 mm has been observed for the four times with return periods varying from 12-51 years (Figures I and 2). Therefore, there is significant possibility of such highly intense rainfall to occur in the coming decades - the higher the rainfall intensity the higher the risk of the susceptibility of a soil to erosion. IO-year 24-hour precipitation as marked in Figure 2 is used as an input in RUSLE2 to compute runoff.
An average of 3235 mm of rainfall has occurred every year in Kerala, and out of that around 77% comes from the summer monsoon (June-Sept) with a comparatively dry season during the winter with a I 0-15% contribution from the winter monsoon (Oct-Feb) as seen in Figure 3 of the mean monthly precipitation variations in Kerala. Since the heaviest rainfall occurs during the summer monsoon months and mostly in June/July, the rainfall in the other seasons will have a very small effect on soil erosion; and therefore, the annual erosion of the soil can be based on this summer monsoon season rainfall.
350 300
E
250.s
200�
.!: 150 100 50 0i
�1
l
1l
!,
1U
I I
Figure 1. The 50-year daily time series of rainfall in Kera/a, India.
�
350 300-�
250E
E
200E
·x
.§.
150...
100 50 N 0 10 100Return period T in years
Figure 2. The 50-year 24-hour maximum rainfallfi'equency distribution in Kera/a, India.
900 800 700
e
600.§.
500 400 300 'iii 200 100 0Jan Feb Mar Apr May Jun Jul Aug Sep Oct Nov Dec Months
Figure 3. Mean monthly precipitation in Kera/a, India.
5 SOIL EROSION ESTIMATION USING RUSLE2
This section presents the results of soil erosion obtained from using the RUSLE2 model based on Equation I. A uniform slope with homogeneous soil conditions is considered here in this study for all the RUSLE2 analyses. Other data, soil and temperature, were collected from relevant websites [16, 17]. In RUSLE2, rainfall erosivity computation ideally requires 30-minutes rainstonn data and that kinetic energy of rainfall is a function of the hourly rainstonn intensity. Therefore, daily data can not directly be used for the purpose of erosivity estimation. Due to the unavailability of the required dataset, the daily rainfall data series available for the study region, Kerala, had to be disaggregated in order to apply the 'e-1' relationship (Equation 2) using the assumptions summarised below [5].
l. Each rain day in a year has a single stom1;
2. The duration of every rainstorm in a year is the same and taken as average storm duration per rain-day per year; and
Kalmar ECO-TECH '07 KALMAR, SWEDEN, November 26-28, 2007
3, The 30-minute maximum rainfall intensity (130 in mm/hour) is equal to the average
hourly storm intensity,
The first assumption is very reasonable since there has been evidence that 91 % of the daily precipitation in a year in tropical regions consists of a single storm event [ 18), The average storm duration per rain-day per year and daily erosivity factor 'r' were detennined using the following steps [5]:
I) Single stom1s/day with various possible average durations of I hr, 2 hr, 3 hr and 6 hr were assumed initially; 2) Considering the assumptions stated above, erosivity factors were calculated for each wet-day using the Kerala data, which are summed up for a year to estimate the annual erosivity factor 'R' for each of the 50 years under consideration; 3) The average annual erosivities (Ra) were detennined for every scenario; 4) Using the iso-erosivity map available for India [ 19], an average annual erosivity for the study region was obtained; 5) This average value obtained from the iso-erosivity map was used in an interpolation between 2 scenario-averages (2 hr and 3 hr here) to determine the average stonn duration per wet-day; 6) This duration is utilised to compute the daily, monthly and yearly erosivities for the Kerala data, The annual rainfall erosivities (R) so estimated are shown in Figure 4,
To capture the effect of rainfall characteristics such as rainfall quantity and intensity variabilities on soil erosion, the five factors namely k, I, S, c and p in Equation I are kept constant Only rainfall factor is varied here_ Other parameters, as selected in RUSLE2, are illustrated below,
k-factor: soil type, as considered to estimate soil loss in Equation I is: lateritic soil which is of loamy nature [Ref websites: 16, 20, 21] with texture, as recommended by the RUSLE2 are, clay= 18%, silt 41%, sand= 41%; permeability class B i,e, moderate or low runoff = =
Average annual erodibility value as estimated by the RUSLE2 modified nomograph is 0,038; which is very much consistent with Ootacamund deep lateritic soil erodibility (0,04) as mentioned in [4], Ootacamund (a place in the state Tamilnadu) soil is likely to be of similar nature to Kerala lateritic soil since Kerala and Tamilnadu states are immediate neighbours, IS factor: topographical factors, as considered here are - slope length = 5m (user selected value) and slope steepness mild slope with an average 3% steepness (user selected value; mild = slope is chosen since most Kerala slope steepnesses vary between 0,5% and 3,5%; [22), c factor: RUSLE2 computes the c-factor based on user selected land cover conditions, Continuous fallow soil with no operations is considered i,e, the soil lay absolutely idle, Therefore, c = I, p-factor: 'p' factor was assumed I, as stated before,
The soil loss results, as shown in Figure 5, show that the calculations perfom1ed by RUSLE2
suggest an average 50-year soil loss 'Aa ' of 79 ton/ha due to the conditions stated above,
which is far more than the threshold value suggested by the USDA (6, 7 ton/ha/yr) and therefore of concern, The figure also shows that soil erosion increases with increase in the erosivity factor, Soil loss is the maximum at 150 ton/ha when rainfall erosivity is the maximum at 30,000 MJ-mm/ha-hr, as shown in Figure 4 and 5 for the year 1961, when annual rainfall was the highest in the 50-year period of 6,075 111111, In 1990s many erosive rainfalls are noticed occurring frequently (in 1991, 1994 and 1997), as in Figure 1, and therefore soil loss values are much higher ( 140, 120, 120 ton/ha) than the 50-year average (79 ton/ha) though having minimal changes in total annual rainfall amounts (Figure 4), Therefore, any increase in rainfall intensity due to climate change, observed since the last 90's decade, no matter whether the total rainfall amount is the same, is an implication to high level of soil
�
��
I
erosion. Furthennore, due to less erosive rainfall in 1992 than in 1991 (Figure 4 and 5),
erosivity is lower in 1992 and so is the soil loss despite having more annual rainfall than in 1991. Therefore, soil loss depends both on the rainfall quantity and the intensity.
35000 -+- Erosivity
.c:
30000 ---x-· - Precipitation ] 25000 Xl
20000 15000 .!: 10000 5000 7000 6000 ::I )> 5000 :, C:2!.
40003
3000E-
-5·
2000�
-1000o·
:, 1954 1958 1962 1966 1970 1974 1978 1982 1986 1990 1994 1998 2002 YearFigure 4. Inter-year variation of annual rainfall erosivity and precipitation.
160 -0-A 35000 140 �R 30000 120 ;:c .5 25000
s·
100 20000�
rn Qi rn C: 803
C: 15000 0�
...
60 '::I"·5
10000 QI II) 40 5000 20 1954 1958 1962 1966 1970 1974 1978 1982 1986 1990 1994 1998 2002 YearKalmar ECO-TECH ·07
KALMAR, SWEDEN, November 26-28, 2007
Years
Figure 6. The 50-year contaminant release with eroded soils.
Since all other parameters are kept constant, variation in the soil loss should always be consistent with the varieation in the erosivitiees. However, it is not always the case. For example, in 1955 and 1975, while 'R' values increased by 19% and 4% respectively from the previous year, soil losses are seen declining by 8% and 18% respectively from the previous year. Again, in 1965 and 1989 when 'R' values decreased from the previous year, 'A' values are seen increasing from the previous year's value. Furthermore, 'A' values are also noticed unchanged in 1964 and 2003 while 'R' values decreased from the previous year. There could only be one reason for this observation; that is, the average daily soil erodibility factor (k) value, which is a function of computed annual nomograph soil erodibility (is actually unchanged here), average daily temperature, average temperature for the RUSLE2 summer months, average daily precipitation and average summer precipitation values for the RUSLE2 summer months. Any change in these climatological variables brings changes in the 'k' -factor values. Although average seasonal temperatures of Kerala are kept unchanged in all the 50 years, seasonal variabilities of rainfall in different years brought these changes. Hence, it could be concluded that, the same soil behaves differently in different climatological condietions resulting in changes in soil erodibility values and in tum soil loss estimations. Following Equation 6, an example is also shown here of quantity of contaminants likely to become available to transport for known soil loss estimates. If one assumes all the soil at a place, comprising of lateritic soil in Kerala, is contaminated by organiec/inorganic pollutants and some mobile contaminants, which could be adhered to the silt (32-41 %), has an average concentration of I 0,000 mg/kg, considering other conditions as above, Figure 6 shows sensitivity of contaminants available to transport for various quantities of rainfall in 50-years. Since the availability of contaminants through sediment production is directly proportional to the soil eroded, contaminant erosion also varies with rainfall quantity and intensity and therefore is the highest in 1961 corresponding to highest soil erosion and followed by 199 1, 1968 respectively, as in Figure 6. These calculations are clearly very simplistic and based on large simpliefying assumptions. A more detailed study taking many of the factors that affect availability of contaminants to transport with detached soil materials will be carried out for a more accurate estimate of contaminant transport via soil erosion.
6 CONCLUSIONS
This study confinns that, monsoon and total annual rainfalls are highly variable in the region of Kerala. Very rare and high magnitude precipitations have been noticed returning several times since 90's (4 times in 1991-2003), Therefore, intense and high frequent storms which could be expected in near future due to climate change are likely to give rise to increased erosion, more frequent flooding and therefore increase in risk of contaminant spreading from contaminated surface soil for the quantity of contaminants available in eroded soil is directly proportional to the quantity of soil eroded and the rainfall factor. Around 77% of rainfall contribution in Kerala comes alone from the summer monsoons and that most of the erosive rainstorms occur in this season, erosion in other seasons is insignificant since highest rain intensities and cumulative amounts are observed in the month of June/July. Rainfall erosivity varies from year to year depending largely on rainfall intensity and amount, Soil loss increases with increase in erosivity, is maximum when erosivity is maximum; and depends both on rainfall amount and intensity. This study also concludes that, same soil can behave differently in different climatological conditions resulting in different soil erodibility values and in tum soil loss computations. So, collectively, soil erosion process and in tum the risk of pollutant spreading from the surface soil is very much sensitive to any climatological changes and that the risk of contaminant transport is the highest from bare ground exposed to high monsoon rainfall,
REFERENCES
[I] Brady, L M., Gray, F., Wissler, C A., Guertin, D. P., 200 L Spatial variability of sediment erosion processes using GIS analysis within watersheds in a historically mined region, Open-File-Report 01-267, U.S Department of the Interior and U,S Geological Survey,
[2] Lal, R,, 200 I , Soil degradation by erosion, Land Degradation and Development, 12, 519-539,
[3] Narayana, V,V, D , , Babu, R,, I 983, Estimation of soil erosion in India, Journal of
Irrigation and Drainage Engineering, A SCE, I 09( 4 ), 419-433.
[4] Singh, G,, Babu, R,, Chandra, S,, 1985, Research on the Universal Soil Loss Equation in India, In: Soil Erosion and Conservation, 496-508,
[5] Pal, L, 2007. Impact of monsoon rainfall on soil erosion, MPhil thesis, Department of Engineering, University of Cambridge,
[6] Elwell, H ,A,, Stocking, M.A., 1973. Rainfall parameters for soil loss estimation in a sub-tropical climate, l, Agricultural Engineering Research, 18, 169-177.
[7] Wischmeier, W.H., Smith, D.D., 1958. Rainfall energy and its relationship to soil loss, Trans. A GU, 39, 285-291,
[8] Laws, J. O., Parsons, D.A, I 943. The relation of raindrop size with intensity, Trans. A GU, 24, 452-459,
[9] Mason, B J , , Andrews, J,B,, I 960, Drop size distributions from various types of rain, Quart. J Roy, Met. Soc., 86, 346-353.
[ I OJ Brown, LC, Foster, GK, 1987, Stonn erosivity using idealized intensity distributions,
Trans. ASA£, 30, 379-386.
[11] Morgan, R. P.C, 2006. Soil Erosion and Conservation, 3rd Edition, Blackwell Publishing, Oxford, UK,
[ I 2] Mukhopadhyay, K,, Seal, A., Bera, R., Bhattacharyya, P., 2006. Comparative study of erodibility factor in different agro-ecological sub-regions of eastern India, Archives of Agronomy and Soil Science, 52(3), 281-287.
Kalmar ECO-TECH '07 KALMAR, SWEDEN, November 26-28, 2007
[13] Wischmeier, W,H,, Johnson, C.B,, Cross, V., 1971. A soil erodibility nomograph for
farmland and construction sites', Journal of Soil and Water Conservation, 26(5), I
89-193. (Abstract only)
[ 14] Wischmeier, W.H., Smith, D.D., 1978. Predicting rainfall-erosion losses - a guide to conservation planning, Agricultural Handbook 53 7, USDA.
[15] Renard, K.G., Foster, G.R., Weesies, G.A., McCool, D.K., Yoder, D.C. ( 1997) Predicting Soil Erosion by Water: A guide to conseervation planning with the Revised Universal Soil Loss Equation (RUSLE), Agriculture Handbook 703. USDA-ARS, South West Watershed Research Center, Tucson, AZ.
[16] http://www.ekissankeerala.neet/kissan/kissancontents/soil.jesp [17] http://www.kol.eto/temperature.htm
[18] Calles, B. and Ku lander, L.. 1994. Rainfall erosivity at Roma, Lesotho, Geograjiska Anna/er, series A. Physical Geography, 76( 1/2), 121- 129.
[19] Babu, R., Tejwani, K.G., Agarwal, M.C., 1978, Distribution of erosion index and
lso-Erodent map of India, Indian Journal of Soil Conservation, 6 ( I ), 1-14. [20] http://www.keralaagriculture.gov.in/htmle/soils/SOIL TYPESDW.htm [21] http://www.kerala.gov.ein/statistical/panchayat_statistics200 I /ekm_shis.htm
[22] Chattopadhyay, S., Chattopadhyay, M., 1997. Sustainable land management in Kerala, India: a biophysical approach, Centre for earth science studies.