SKI Report 02:53
Research
SFR 1 Vault Database
David Savage
Mike Stenhouse
April 2002
SKI perspective
BackgroundAs part of the license for SFR 1 a renewed safety assessment should be carried out at least every ten years for the continued operation of the SFR 1 repository. SKB has at mid-year 2001 finalised their renewed safety assessment (project SAFE) which evaluates the performance of the SFR 1 repository system.
As part of SKI’s own capability to perform radionuclide transport calculations a need to develop a database for the near-field of SFR 1 repository was identified.
Purpose of the project
The purpose of this project is to make a compilation of physical and chemical data for the engineered barriers plus near-field rock of the SFR 1 repository.
Results
The parameters in the SFR 1 vault database has successfully been used in SKI’s own radionuclide transport calculations and in the review of SKB’s safety assessment for SFR 1.
Effect on SKI’s work
This project has given SKI not only an updated parameter database for SFR 1 but also partly an useful database for the low and intermediate level waste repository SFL 3-5.
Project information
Responsible at SKI has been Bo Strömberg. SKI ref.: 14.9-991010/99136
Relevant SKI report:
Savage, D., Stenhouse, M., Benbow, S., Evolution of Near-Field Physico-Chemical Characteristics of the SFR Repository, SKI Report 00:49, Swedish Nuclear Power Inspectorate, Stockholm, Sweden, 2000.
Chapman, N. A., Maul, P. R., Robinson, P. C., Savage D., SKB’s Project SAFE for the SFR 1 Repository - A Review by Consultants to SKI -, SKI Report 02:61, Swedish Nuclear Power Inspectorate, Stockholm, Sweden, 2002.
Maul P. R., Robinson P. C., Exploration of Important Issues for the Safety of SFR 1 using Performance Assessment Calculations, SKI Report 02:62, Swedish Nuclear Power Inspectorate, Stockholm, Sweden, 2002.
SKI Report 02:53
Research
SFR 1 Vault Database
David Savage¹
Mike Stenhouse²
¹Quintessa Ltd.
24 Trevor Road
West Bridgford
Nottingham NG2 6FS
UK
²Monitor Scientific LLC
3900 S. Wadsworth Boulevard
Denver
Colorado 80235
USA
April 2002
This report concerns a study which has been conducted for the Swedish Nuclear Power Inspectorate (SKI). The conclusions and viewpoints presented in the report are those of the author/authors and do not
Summary
SKB is carrying out a safety assessment of the operational SFR 1 repository under the auspices of the ‘SAFE’ (Safety Assessment of Final Repository for Radioactive Operational Waste) project (SKB, 1998a; SKB, 1998b). SKI in turn, is carrying out its own review of SFR 1.
The work presented here is a compilation of physical and chemical data for the SFR 1 repository which will be used in radionuclide transport and assessment calculations by SKI. This compilation has focused on the repository itself (engineered barriers plus near-field rock).
Data have been compiled for the following:
• Physical properties (porosity, hydraulic conductivity, bulk density, effective diffusivity);
• Sorption of radionuclides (on concrete, sand, bentonite, sand-bentonite, and rock); • Radionuclide solubility.
In addition, issues affecting gas generation at SFR 1 have been reviewed and placed in context with research conducted for the SFL 3-5 repository.
Sammanfattning
SKB har utfört en säkerhetsanalys på slutförvaret för radioaktivt driftavfall, SFR 1, under ledning av projektet “SAFE” (Safety Assessment of Final Repository for
Radioactive Operational Waste) (SKB, 1998a; SKB, 1998b). SKI i sin tur utför sin egen granskning av SFR 1.
I denna rapport presenteras en sammanställning av fysikaliska och kemiska data för SFR 1-förvaret vilka kommer att användas i SKI:s egna radionuklidtransport och analys beräkningar. Denna sammanställningen har sitt fokus på själva förvaret (tekniska barriärer och berget närmast förvaret).
Data har sammanställts för följande områden:
• Fysikaliska egenskaper (porositet, hydraulisk konduktivitet, bulkdensitet, effektiv diffusivitet).
• Sorption av radionuklider (på betong, sand, bentonit och sand-bentonit blandning och berg).
• Löslighet för radionuklider.
Dessutom har frågor som påverkar bildandet av gas i SFR 1 granskats och satt i sitt sammanhang med den forskning som utförts för SFL 3-5-förvaret.
Contents
1 Introduction ... 1
2 Physical properties data... 3
2.1 Porosity... 3
2.1.1 Waste matrices... 3
2.1.2 Concrete... 3
2.1.3 Bentonite, sand-bentonite, sand, backfill ... 3
2.1.4 Near-field rock... 4
2.2 Hydraulic conductivity ... 4
2.2.1 Waste matrices... 4
2.2.2 Concrete... 5
2.2.3 Bentonite, sand-bentonite, sand, backfill ... 5
2.2.4 Near-field rock... 6 2.3 Bulk density... 7 2.3.1 Waste matrices... 8 2.3.2 Concrete... 8 2.3.3 Bentonite... 8 2.3.4 Near-field rock... 8 2.4 Effective diffusivity... 8 2.4.1 Waste matrices... 9 2.4.2 Concrete... 9
2.4.3 Bentonite, sand-bentonite, sand, backfill ... 9
2.4.4 Near-field rock... 10
3 Sorption data... 13
3.1 Sorption on Waste Matrix (Porous Concrete) ... 13
3.2 Sorption on Cementitious Materials... 14
3.3 Sorption on Sand ... 14
3.4 Sorption on Compacted Bentonite and Sand-Bentonite... 14
3.5 Influence of Organic Complexants... 15
3.6 Sorption on Near-Field and Far-Field Rock... 15
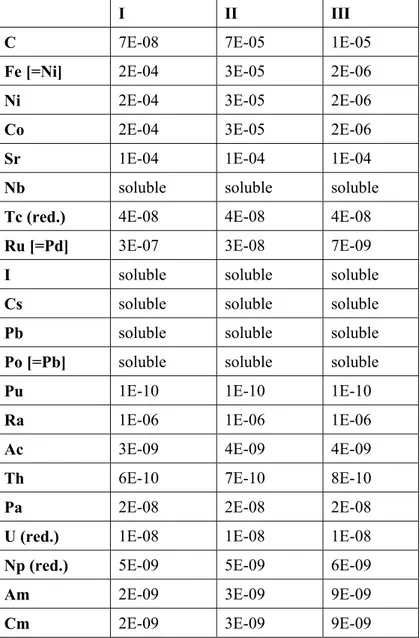
4 Solubility data... 27
5 Gas issues ... 29
5.1 Factors affecting gas generation rates ... 29
5.1.1 Will gas be produced? ... 29
5.1.2 Under what conditions will gas be generated? ... 29
5.1.3 How much gas will be generated?... 30
5.1.4 At what rate will gases be generated? ... 30
5.1.5 What are the impacts from gases generated in the repository? ... 30
5.2 Review of “Gas generation in SFL 3-5 and effects on radionuclide release” (Skagius et al., 1999) ... 35
5.2.1 Comments/Queries - General ... 35
5.2.2 Comments/Queries – More Specific ... 36
1
Introduction
SKB is carrying out a safety assessment of the operational SFR 1 repository under the auspices of the ‘SAFE’ (Safety Assessment of Final Repository for Radioactive Operational Waste) project (SKB, 1998a; SKB, 1998b). SKI in turn, is carrying out its own review of SFR 1.
The work presented here is a compilation of physical and chemical data for the SFR 1 repository which will be used in radionuclide transport and assessment calculations by SKI. This compilation has focused on the repository itself (engineered barriers plus near-field rock).
Consideration has been given to the changes in physical and chemical properties of barriers with time due either to physicochemical degradation of the engineered barrier system resulting from groundwater flow and chemical reaction, and/or geological evolution of the site resulting in uplift/subsidence and consequent emergence or submergence beneath the Baltic Sea. These latter processes are thought to induce changes in groundwater chemistry. Consequently, evolution of the SFR 1 site has been divided into the time-dependent stages, according to processes described elsewhere (Savage et al., 2000).
Stage I, which is representative of 'fresh' cementitious barriers and cement pore fluid
conditions of pH 12.5-13. Portlandite [CaOH)2] and CSH gel are present in the system.
Stage II, which is representative of partially degraded cementitious barriers,
corresponding to cement pore fluid conditions controlled by the solubility of portlandite (pH 12.5). Partial removal of portlandite is assumed to have occurred.
Stage III, which is representative of partially degraded cementitious barriers, corresponding to cement pore fluid conditions controlled by CSH gel (pH < 12).
Portlandite has been removed. Partial removal of CSH gel is assumed to have occurred. Since different parts of SFR 1 have different amounts of concrete, this time-evolution of physicochemical conditions will not occur at the same rate throughout SFR 1. Savage et al. (Savage et al., 2000) have pointed out that although the Silo, BMA and BTF vaults
may have pore fluids with pH > 10 for upwards of 106 a, the BLA vault may be exposed
to ambient groundwater conditions almost immediately after closure.
Superimposed upon each of the three stages identified above are the effects of subsidence and uplift and concomitant effects upon groundwater composition.
Consequently, each of the stages could be accompanied by the presence of 'fresh' and 'saline' groundwater. These different groundwater types could affect sorption, solubility and diffusivity of radionuclides.
For the most part, Swedish data for the various barrier properties have been selected for inclusion in the database, because of their relevance to the specific materials concerned. Where possible, the selection of data for inclusion in the database has taken into
account relevant data from safety assessments conducted elsewhere, e.g. the United Kingdom, Switzerland, USA etc. However, care has been taken that any data thus obtained should be relevant to disposal conditions at SFR 1.
2
Physical properties data
This section of the report considers data availability for porosity, hydraulic
conductivity, density, and diffusivity of radionuclides in the engineered barriers and near-field rock of SFR 1. For the most part, these data are obtained from previous work by SKB either specifically for SFR 1, or relevant portions of the planned SFL 3-5 repository for intermediate-level radioactive wastes.
2.1
Porosity
Porosity data for the SFR 1 system are presented in Table 2.1.
2.1.1 Waste matrices
Data for the porosity of waste matrices was taken from SKB data (Allard et al., 1991, as quoted by Höglund and Bengtsson, 1991). It is considered that these data are the most relevant for the different materials within the waste containers at SFR 1. The initial porosity values range from 0.1 to 0.7, depending upon the precise nature of the concrete. Changes to initial porosity values due to partial dissolution of portlandite (Stage II) and CSH gel (Stage III) were also taken from Höglund and Bengtsson (Höglund and Bengtsson, 1991). As concluded by Höglund and Bengtsson (1991), it is assumed that dissolution of portlandite produces negligible changes to porosity. The uncertainty quoted for each porosity value reflects the range of values quoted by Höglund and Bengtsson (1991).
The porosity value considered by Nagra (Nagra, 1994b) for concrete inside waste containers was 0.25. Nagra did not consider explicitly changes in porosity values due to concrete degradation.
2.1.2 Concrete
Data for the porosity of porous and structural concrete were taken from SKB data (Allard et al., 1991, as quoted by Höglund and Bengtsson, 1991), with provisos as described under Section 2.1.1.
Porosity values considered by Nagra (1994b) for structural and porous concrete in the planned Wellenberg repository for intermediate-level waste were 0.05 and 0.35, respectively. Time-dependent variation of porosity was not considered.
UK Nirex Ltd quote a value of 0.5 for the porosity of their 'Nirex Reference Vault Backfill' (NRVB) cement (Francis et al., 1997).
2.1.3 Bentonite, sand-bentonite, sand, backfill
Data for the porosities of bentonite, sand-bentonite, and sand were taken from Allard et al., (1991) [as quoted by Höglund and Bengtsson, 1991], and the porosity value for rock backfill was taken from the analysis of the SFL 3-5 repository by Skagius et al. (1999).
These sources do not quote uncertainties for porosity values, but it is estimated that the values could vary by ± 10 % due to potential variations in materials and emplacement methods. In the absence of any data concerning the interaction of these materials with cement pore fluids, it is assumed that the porosity of these materials does not change with time.
From its review of a number of safety assessments of the disposal of HLW in fractured hard rock, Safety Assessment Management Ltd (SAM, 1996) presented the following porosity values for bentonite: SKB 91 (Sweden) 0.25; TVO 92 (Finland) 0.43;
Kristallin-1 (Switzerland) 0.38; PNC H-3 (Japan) 0.33; AECL 94 (Canada) 0.40. The value selected for SFR 1 (0.25) is thus at the lower end of this range.
Note that for some elements, specifically those that exist in solution as anions, a reduced transport porosity is normally provided to account for anion exclusion in compacted bentonite. Thus, for SKB 91 reduced porosities of 0.05 were provided for Cl, Tc (oxidising conditions) and I; for TVO 92, reduced porosities of 0.05 were provided for C, Cl, Se, Tc (oxidising conditions) and I.
2.1.4 Near-field rock
The porosity values for near-field rock fractures and near-field rock matrix were taken from the typical values for Swedish rock used in the analysis of the SFL 3-5 repository (Ohlsson and Neretnieks, 1997, as quoted by Skagius et al., 1999). These range from 0.001 to 0.01 for the rock matrix and from 0.0004 to 0.02 for the rock fractures.
Ohlsson and Neretnieks (1997) suggest that the porosity available for anions should be less than that available for cations, due to so-called 'anion exclusion' processes and
propose porosity values a factor of 10 less for radionuclides such as 14C, 36Cl and 129I.
These potential porosity differences for anions and cations have not been included in the study described here.
For its safety assessment of the disposal of HLW in fractured hard rock in Switzerland, Nagra (1994b) considered that the porosity of fracture fills was 0.02-0.03, depending upon the mineralogical alteration of the infill. The porosity of the wall-rock was considered to be 0.0025-0.05, depending upon its state of alteration. These values are both somewhat greater than those adopted here, but clearly, Nagra's values relate to site-specific rock material in Switzerland.
2.2
Hydraulic conductivity
Hydraulic conductivity data for the SFR 1 system are presented in Table 2.1.
2.2.1 Waste matrices
No hydraulic conductivity data specific to the materials within the waste containers at SFR 1 could be found. In the absence of these data it is suggested that the hydraulic
conductivity data for porous concrete (below) are adopted for safety assessment
calculations (0.3 ± 0.2 m y-1).
2.2.2 Concrete
Höglund and Bengtsson (1991) quote a hydraulic conductivity value for unfractured,
fresh concrete as < 3×10⁻⁴ m y-1, and that for fractured concrete as > 3×10⁻¹ m y-1.
'Porous' and 'structural' concrete types were not distinguished.
Nagra (Nagra, 1994a) considered three different sets of hydraulic conductivity values for concrete according to their degree of understanding for their safety assessment of an intermediate-level waste repository at the Wellenberg site in Switzerland. These
different values were termed 'optimistic', 'realistic' and 'pessimistic'. Time-dependent variation of this parameter was not considered as such. For structural concrete, these
values ranged from 3×10⁻³ to 3×10⁻⁴ m y-1 ('optimistic') through 3×10⁻³ to 3×10⁻² m y-1
('realistic'), to 3×10⁻¹ m y-1 ('pessimistic'). For relatively porous concrete backfill
(porosity = 0.35), Nagra suggest a hydraulic conductivity value of 3×10⁻¹ m y-1
(identical in 'optimistic', 'realistic' and 'pessimistic' cases).
UK Nirex Ltd quote a value of 3×10⁻² m y-1 for the hydraulic conductivity of their
'Nirex Reference Vault Backfill' (NRVB) cement (Francis et al., 1997). NRVB has a relatively high porosity of 0.5.
In view of the sparseness of data specific to SFR 1, it is suggested that hydraulic conductivity data for stages I, II, and III are similar to those suggested by Nagra
(1994a), namely, for structural concrete 3×10⁻³ ± 2×10⁻³, 3×10⁻² ± 2×10⁻², and
3×10⁻¹ ± 2×10⁻¹ m y-1, respectively, and for porous concrete, a value of 3×10⁻¹ ± 2×10⁻¹
m y-1 throughout stages I, II and III.
2.2.3 Bentonite, sand-bentonite, sand, backfill
From its review of safety assessments of the disposal of HLW in fractured hard rock in Switzerland, SAM (1996) report hydraulic conductivity values for bentonite measured
by high-pressure techniques as < 3×10⁻⁶ m y-1 (Sweden, Switzerland, Finland, Japan) or
< 3×10⁻⁴ m y-1 (Canada).
Hydraulic conductivity measurements carried out using ultracentrifuge methods (e.g.
Conca et al., 1993) report values below detection limits (3×10⁻⁶ m y-1), emphasising that
once water-saturation is achieved, bentonite is water impermeable and that solute transport occurs by diffusion only.
The value quoted by Conca et al. (1993) is proposed for both bentonite and sand-bentonite mixes at SFR 1. It is assumed that this value is time-invariant in the absence of any SFR 1-specific data concerning the potential interaction of cement pore fluids with bentonite. It is considered that these interactions could increase or decrease hydraulic conductivity.
2.2.4 Near-field rock
Höglund and Bengtsson (1991) quote a value for the hydraulic conductivity of the rock
around SFR 1 as 0.5 m y-1. Skagius et al. (1999) quote hydraulic conductivity values for
Swedish rock in the range 3×10⁻³ to 2×10² m y-1. It is assumed that hydraulic
conductivities for the rock matrix are at the lower end of this range, whereas those for fractures are at the higher end of the range. Values of 0.3 (range 0.003 to 3) and 10
(range 1 to 100) m y-1 were therefore selected for the rock matrix and near-field
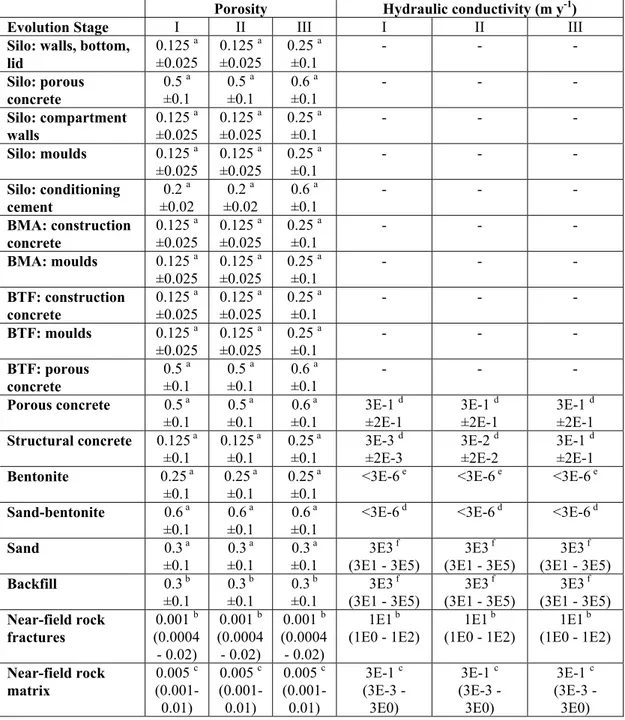
Table 2.1 Porosity and hydraulic conductivity data during 'Stages I, II, and III' of
repository evolution.
Porosity Hydraulic conductivity (m y-1)
Evolution Stage I II III I II III
Silo: walls, bottom, lid 0.125 a ±0.025 0.125 a ±0.025 0.25 a ±0.1 - - -Silo: porous concrete 0.5 a ±0.1 0.5 a ±0.1 0.6 a ±0.1 - - -Silo: compartment walls 0.125 a ±0.025 0.125 a ±0.025 0.25 a ±0.1 - - -Silo: moulds 0.125 a ±0.025 0.125 a ±0.025 0.25 a ±0.1 - - -Silo: conditioning cement 0.2 a ±0.02 0.2 a ±0.02 0.6 a ±0.1 - - -BMA: construction concrete 0.125 a ±0.025 0.125 a ±0.025 0.25 a ±0.1 - - -BMA: moulds 0.125 a ±0.025 0.125 a ±0.025 0.25 a ±0.1 - - -BTF: construction concrete 0.125 a ±0.025 0.125 a ±0.025 0.25 a ±0.1 - - -BTF: moulds 0.125 a ±0.025 0.125 a ±0.025 0.25 a ±0.1 - - -BTF: porous concrete 0.5 a ±0.1 0.5 a ±0.1 0.6 a ±0.1 - - -Porous concrete 0.5 a ±0.1 0.5 a ±0.1 0.6 a ±0.1 3E-1 d ±2E-1 3E-1 d ±2E-1 3E-1 d ±2E-1 Structural concrete 0.125 a ±0.1 0.125 a ±0.1 0.25 a ±0.1 3E-3 d ±2E-3 3E-2 d ±2E-2 3E-1 d ±2E-1 Bentonite 0.25 a ±0.1 0.25 a ±0.1 0.25 a ±0.1
<3E-6 e <3E-6 e <3E-6 e
Sand-bentonite 0.6 a ±0.1 0.6 a ±0.1 0.6 a ±0.1 <3E-6 d <3E-6 d <3E-6 d Sand 0.3 a ±0.1 0.3 a ±0.1 0.3 a ±0.1 3E3 f
(3E1 - 3E5) 3E3
f
(3E1 - 3E5) 3E3
f (3E1 - 3E5) Backfill 0.3 b ±0.1 0.3 b ±0.1 0.3 b ±0.1 3E3 f
(3E1 - 3E5) 3E3
f
(3E1 - 3E5) 3E3
f (3E1 - 3E5) Near-field rock fractures 0.001 b (0.0004 - 0.02) 0.001 b (0.0004 - 0.02) 0.001 b (0.0004 - 0.02) 1E1 b (1E0 - 1E2) 1E1 b (1E0 - 1E2) 1E1 b (1E0 - 1E2) Near-field rock matrix 0.005 c (0.001-0.01) 0.005 c (0.001-0.01) 0.005 c (0.001-0.01) 3E-1 c (3E3 -3E0) 3E-1 c (3E3 -3E0) 3E-1 c (3E3 -3E0)
a Allard et al. (1991), as quoted by Höglund and Bengtsson (1991). b Skagius et al. (1999). c Ohlsson
and Neretnieks, 1997, as quoted by Skagius et al. (1999). d See text. e Conca et al. (1993). f Freeze and
Cherry, 1979, as quoted by Skagius et al. (1999).
2.3
Bulk density
Bulk density values of materials in the SFR 1 repository are presented in Table 2.2. Densities are quoted taking into account porosity values from Table 2.1. It is assumed that porosity is filled with air.
2.3.1 Waste matrices
The densities of concrete filling the various waste structures in SFR 1 were calculated using the porosity values from Table 2.1 (from Höglund and Bengtsson, 1991) and a
density of concrete of 2400 kg m-3 (from Skagius et al., 1999). Density values are
identical for repository evolution stages I and II, but decrease according to changes in porosity (Table 2.1) for stage III.
The density value considered by Nagra (1994a) for concrete inside waste containers
was 1350 kg m-3 which is at the lower end of the range of initial values used here
(1200-2100 kg m-3).
2.3.2 Concrete
Generic densities for 'porous' and 'structural' concrete included in Table 2.2 are those calculated using porosity data from Table 2.1 (from Höglund and Bengtsson, 1991) and
a density of concrete of 2400 kg m-3 (from Skagius et al., 1999).
For their safety assessment of an intermediate-level waste repository at the Wellenberg site in Switzerland (Nagra, 1994b) considered density values for various concretes in the repository structure. For cavern linings and container walls, the density was 500
kg m-3, whereas the density of cavern infill and container lids was 1700 kg m-3.
The density of UK Nirex's NRVB (50 % porosity) is 1095 kg m-3 (Francis et al., 1997).
2.3.3 Bentonite
For its safety assessment of the disposal of HLW in fractured hard rock in Switzerland, Nagra (1994b) considered that the solid density ('specific density') of bentonite was
2760 kg m-3. This value translates to a bulk density of 1767 kg m-3 assuming a porosity
of 0.36. This value has been used to calculate the density of bentonite at SFR 1, using the porosity data from Table 2.1.
2.3.4 Near-field rock
The density of granitic rock was assumed to be 2700 kg m-3 (Krauskopf and Bird, 1995)
with values in Table 2.2 being calculated from the porosity values in Table 2.1.
2.4
Effective diffusivity
Effective diffusivity data are presented in Table 2.2. Data are compatible with the following formula:
De=εD0 δd
where De is the effective diffusivity (m2 y-1), ε is porosity (m3/m3), D0 is the diffusivity
in unconfined pore water (m2 y-1) δd is a constrictivity factor describing the number of
narrow passages in the pore structure, and τ2 is a tortuosity factor describing the
tortuosity of pores.
It can be seen from equation [2.1] that effective diffusivity is directly proportional to
porosity and the 'geometric factor', δd /τ2. Consequently, each effective diffusivity value
in Table 2.2 has an associated porosity and geometric factor (apart from those for the near-field rock matrix and near-field rock fractures where geometric factor data are missing).
Effective diffusivity values presented in Table 2.2 were calculated assuming a uniform
diffusivity in unconfined water (D0) of 6×10⁻² m2 y-1 (Höglund and Bengtsson, 1991).
2.4.1 Waste matrices
Effective diffusivity data for concretes used as waste matrices in Table 2.2 were
calculated using the porosity data from Table 2.1, a free pore water diffusion coefficient
of 6×10⁻² m2 y-1, and 'geometric factors' of 0.01, 0.1 and 0.25 for stages I, II and III
respectively for 'structural' concrete (in lids, compartment walls etc), and a 'geometric factor' of 0.5 for stages I - III for 'porous' concrete. The values for geometric factors for fresh and degraded concrete are as recommended by Höglund and Bengtsson (1991).
2.4.2 Concrete
As above, effective diffusivity data for porous and structural concretes in Table 2.2 were calculated using the porosity data from Table 2.1, a free pore water diffusion
coefficient of 6×10⁻² m2 y-1, and 'geometric factors' of 0.01, 0.1 and 0.25 for stages I, II
and III respectively for 'structural' concrete (in lids, compartment walls etc), and a 'geometric factor' of 0.5 for stages I - III for 'porous' concrete. The values for geometric factors for fresh and degraded concrete are as recommended by Höglund and Bengtsson (1991).
For their safety assessment of an intermediate-level waste repository at the Wellenberg site in Switzerland Nagra (1994a) considered 'pore diffusion constants' for various
concretes in the repository structure to be in the range 0.003 to 1.3 m2 y-1, which are
generally greater than those presented in Table 2.2.
UK Nirex Ltd measured effective diffusion coefficients in the range 3×10⁻³ to 2×10⁻²
m2y-1 for their (porous) NRVB concrete backfill. These values are very similar to those
presented in Table 2.2.
2.4.3 Bentonite, sand-bentonite, sand, backfill
Data for the effective diffusivity of bentonite and sand-bentonite mixes were taken from the work of Höglund and Bengtsson (1991) which are regarded as the most relevant for materials used in SFR 1. These authors quote 'geometric factors' for bentonite and
sand-bentonite as 0.2 and 0.08, respectively. Uncertainties quoted for effective diffusivity values are those associated with porosity estimates.
From its review of safety assessments of the disposal of HLW in fractured hard rock, Safety Assessment Management Ltd. (1996) quote values for the effective diffusivity of
bentonite in the range 1×10⁻⁵ to 9×10⁻³ m2 y-1. The value selected here for SFR 1
(3×10⁻³ m2 y-1) is at the upper end of this range and corresponds to the value used in
SKB 91 (Brandberg and Skagius, 1991).
Data for the effective diffusivity of sand and rock backfill were taken from the work of Skagius et al. (1999) for the SFL 3-5 repository. A geometric factor of unity was assumed for both materials.
In the absence of any data concerning the interaction of cement pore fluids with these materials (bentonite, sand-bentonite, sand, rock backfill), time-invariant values were chosen.
2.4.4 Near-field rock
Data for the effective diffusivity of the near-field rock matrix were taken from the work of Skagius et al. (1999) for generic Swedish rock. However, these data were re-worked
assuming a free pore water diffusion coefficient of 6×10⁻² m2 y-1 to achieve consistency
with data used for diffusion in the EBS, rather than the value of 3×10⁻² m2 y-1 chosen by
Skagius et al. (1999). Interestingly, Skagius et al. (1999) chose a different free pore
water diffusion coefficient value for the engineered barrier materials (6×10⁻² m2 y-1)
from that employed for the near-field rock (3×10⁻² m2 y-1) for their assessment of the
behaviour of the SFL 3-5 repository. A rather large diffusion depth of 2-20 m into the rock matrix was employed by Skagius et al. (1999). A more realistic value for diffusion distances in fractured hard rock would be 5-10 cms (e.g. Nagra, 1994b).
Skagius et al. (1999) also present different effective diffusivity data for different radionuclides as well as different data for 'fresh' and 'saline' groundwater. Some
radionuclides were considered to have a ten times greater effective diffusion coefficient in saline groundwater due to 'anion exclusion' (inorganic carbon, Cl, I), whereas others were assumed to have a diffusion coefficient ten times lower (Cs, Sr). Diffusion coefficients for other radionuclides were identical in the two groundwater types. Such differences for different radionuclides and different pore waters are not reproduced here. Instead, note has been taken of the range of data presented by Skagius et al. (1999)
and a mean value selected in Table 2.2 (2×10⁻⁶ m2 y-1). The range of data identified by
Skagius et al. (1999) is here used as a range of uncertainty for safety calculations. Unlike other effective diffusivity data, these values are not linked to specific porosity and geometric factor data.
In the absence of any other data, the effective diffusivity data for the near-field rock matrix were also used for near-field rock fractures.
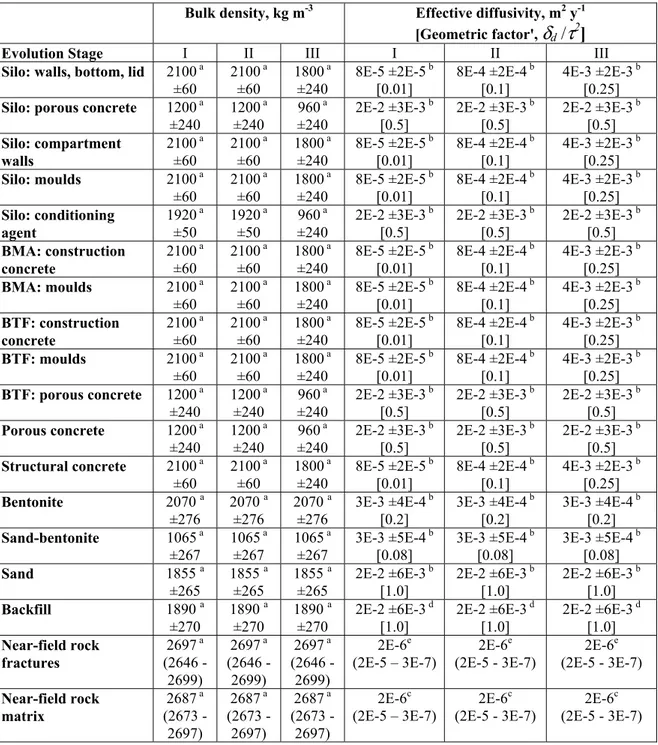
Table 2.2 Bulk density and effective diffusivity data during 'Stages I, II, and III' of
repository evolution.
Bulk density, kg m-3 Effective diffusivity, m2 y-1
[Geometric factor', δd /τ2]
Evolution Stage I II III I II III
Silo: walls, bottom, lid 2100 a
±60 2100 a ±60 1800 a ±240 8E-5 ±2E-5 b [0.01] 8E-4 ±2E-4 b [0.1] 4E-3 ±2E-3 b [0.25]
Silo: porous concrete 1200 a
±240 1200 a ±240 960 a ±240 2E-2 ±3E-3 b [0.5] 2E-2 ±3E-3 b [0.5] 2E-2 ±3E-3 b [0.5] Silo: compartment walls 2100 a ±60 2100 a ±60 1800 a ±240 8E-5 ±2E-5 b [0.01] 8E-4 ±2E-4 b [0.1] 4E-3 ±2E-3 b [0.25] Silo: moulds 2100 a ±60 2100 a ±60 1800 a ±240 8E-5 ±2E-5 b [0.01] 8E-4 ±2E-4 b [0.1] 4E-3 ±2E-3 b [0.25] Silo: conditioning agent 1920 a ±50 1920 a ±50 960 a ±240 2E-2 ±3E-3 b [0.5] 2E-2 ±3E-3 b [0.5] 2E-2 ±3E-3 b [0.5] BMA: construction concrete 2100 a ±60 2100 a ±60 1800 a ±240 8E-5 ±2E-5 b [0.01] 8E-4 ±2E-4 b [0.1] 4E-3 ±2E-3 b [0.25] BMA: moulds 2100 a ±60 2100 a ±60 1800 a ±240 8E-5 ±2E-5 b [0.01] 8E-4 ±2E-4 b [0.1] 4E-3 ±2E-3 b [0.25] BTF: construction concrete 2100 a ±60 2100 a ±60 1800 a ±240 8E-5 ±2E-5 b [0.01] 8E-4 ±2E-4 b [0.1] 4E-3 ±2E-3 b [0.25] BTF: moulds 2100 a ±60 2100 a ±60 1800 a ±240 8E-5 ±2E-5 b [0.01] 8E-4 ±2E-4 b [0.1] 4E-3 ±2E-3 b [0.25] BTF: porous concrete 1200 a ±240 1200 a ±240 960 a ±240 2E-2 ±3E-3 b [0.5] 2E-2 ±3E-3 b [0.5] 2E-2 ±3E-3 b [0.5] Porous concrete 1200 a ±240 1200 a ±240 960 a ±240 2E-2 ±3E-3 b [0.5] 2E-2 ±3E-3 b [0.5] 2E-2 ±3E-3 b [0.5] Structural concrete 2100 a ±60 2100 a ±60 1800 a ±240 8E-5 ±2E-5 b [0.01] 8E-4 ±2E-4 b [0.1] 4E-3 ±2E-3 b [0.25] Bentonite 2070 a ±276 2070 a ±276 2070 a ±276 3E-3 ±4E-4 b [0.2] 3E-3 ±4E-4 b [0.2] 3E-3 ±4E-4 b [0.2] Sand-bentonite 1065 a ±267 1065 a ±267 1065 a ±267 3E-3 ±5E-4 b [0.08] 3E-3 ±5E-4 b [0.08] 3E-3 ±5E-4 b [0.08] Sand 1855 a ±265 1855 a ±265 1855 a ±265 2E-2 ±6E-3 b [1.0] 2E-2 ±6E-3 b [1.0] 2E-2 ±6E-3 b [1.0] Backfill 1890 a ±270 1890 a ±270 1890 a ±270 2E-2 ±6E-3 d [1.0] 2E-2 ±6E-3 d [1.0] 2E-2 ±6E-3 d [1.0] Near-field rock fractures 2697 a (2646 -2699) 2697 a (2646 -2699) 2697 a (2646 -2699) 2E-6e (2E-5 – 3E-7) 2E-6e (2E-5 - 3E-7) 2E-6e (2E-5 - 3E-7) Near-field rock matrix 2687 a (2673 -2697) 2687 a (2673 -2697) 2687 a (2673 -2697) 2E-6c (2E-5 – 3E-7) 2E-6c (2E-5 - 3E-7) 2E-6c (2E-5 - 3E-7)
a Assumes the following solid densities (kg m-3): concrete = 2400 (Skagius et al., 1999); sand = 2650 (Deer
et al., 1992); bentonite = 2760 (Nagra, 1994b); backfill, rock = 2700 (Krauskopf and Bird, 1995).
Uncertainties are assumed to be those associated with porosity. b Höglund and Bengtsson (1991), but with
repository evolutionary stages as defined in Section 1 of this report. Uncertainties are assumed to be those associated with porosity. c Skagius et al. (1999), but assuming a free diffusion coefficient (D
0) of 6×10⁻² m2
3 Sorption data
Sorption databases in the form of best estimate and pessimistic Kd values, have been
provided for sorption of selected radioelements on the following substrates: • porous concrete (waste matrix);
• structural concrete; • bentonite;
• sand-bentonite (90%:10% mixture); • sand;
• backfill (crushed rock); • near-field rock fractures; • near-field rock matrix; • far-field rock fractures; • far-field rock matrix.
The corresponding databases are shown in Table 3.1. All values are clearly referenced to a specific database or report, with the exception of those elements for which a chemical analogue was used.
The vaults have been subdivided according to different components of the Silo,
BMA/BLA and BTF vaults, thereby accounting for different near-field barriers in each section of the repository. Best estimate values are taken from Stenhouse (Stenhouse,
2000). Pessimistic values provided for each element are either based on a Kd value
provided in a similar database elsewhere, or are a reflection of the lack of data for a particular element. These (pessimistic) values are always equal to, or smaller than, the
lowest corresponding database Kd. Thus, such values, in concert with sensitivity
analysis, may be used to highlight those radioelements for which more experimental work is merited.
3.1
Sorption on Waste Matrix (Porous Concrete)
For those wastes immobilised in cement, Kd values are provided for sorption on
cementitious material (porous concrete). Certain types of waste, e.g. ion exchange resins, are expected to provide additional immobilisation for the radionuclides they contain, but no credit has been given to this possibility.
Similarly, for those waste immobilised in bitumen, no credit for sorption is given to this matrix. Finally, no sorption is credited for those wastes not immobilised.
3.2
Sorption on Cementitious Materials
The bulk of the best estimate Kd values for cementitious materials have been taken from
Savage et al. (Savage et al., 2000). Some elements for which Kd values are required,
were not included in the original report, but are included in Table 3.1. Values for these elements were assigned by chemical analogy, viz.
• Fe: Ni used as chemical analogue; • Co: Ni used as chemical analogue; • Ru: Pd used as chemical analogue; • Po: Pb/Sn used as chemical analogue.
Low (pessimistic) Kd values have been selected specifically for sensitivity analysis. The
influence of different types of cement on sorption behaviour is discussed in Savage et al. (2000). Essentially, the conclusion in this report and elsewhere (Bradbury and Sarott, 1995; Krupka and Serne, 1998) is that the cement phases which dominate sorption are CSH phases which are common to all types of cement, at least during Stages I and II.
Thus, identical Kd values are provided for sorption on different cements/concrete, so
that differences in radionuclide transport through different cementitious materials will be governed only by differences in physical parameters (tortuosity, constrictivity, porosity; these parameters expressed through diffusivity) for each cement/concrete.
3.3
Sorption on Sand
Since sand consists primarily of silica, best estimate Kd values for sorption of
radioelements on quartz have been used to compile this database. Most of these data were obtained from Stenhouse (Stenhouse, 1995). Note, however, that Bradbury and
Sarott (1995) conservatively used Kd values for sorption on quartz/sand for Stage III in
the evolution of cement, during which CSH phases were unstable, i.e. being dissolved.
3.4
Sorption on Compacted Bentonite and Sand-Bentonite
Compacted bentonite and sand-bentonite act as component barriers around different parts of the Silo section of the repository.
Kd values for sorption on compacted bentonite for the Safety Report 97 ('SR 97' ) are
given in Andersson (1999) and these values and their sources (Yu and Neretnieks, 1997; Ochs, 1997) were reviewed by Stenhouse (2000). We also take into account the findings of Ochs (1997) who modelled the bentonite pore water composition when pore water was equilibrated with saline and freshwater groundwaters. His findings indicate that the influence of the groundwater composition is small relative to the effects of (natural) impurities in the bentonite. This conclusion is supported by the modelling
conducted by Bruno et al. (1999). Thus, best estimate and pessimistic Kd values relate
The sand-bentonite barrier is assumed to consist of 10 % bentonite and 90 % sand (Appendix 2, SKI, 1994). The issue here is whether the extent of radioelement sorption
is a ‘composite Kd’ for bentonite + sand (i.e. = 0.1 Kd compacted bentonite + 0.9 Kd
sand), reflecting the reduced proportion of bentonite in the barrier. We believe that a
factor of 10 reduction in Kd values for sorption on compacted bentonite will probably
understimate the extent of sorption because not all sorption sites will be occupied. However, as a basis for developing the database, the composite approach is reasonable and conservative. This is also the approach taken by SKI (1994; Appendix 2) and
Andersson (1999). Again, best estimate and pessimistic Kd values relate to reducing
conditions and a saline groundwater.
3.5
Influence of Organic Complexants
The effect of organic complexants on radionuclide sorption behaviour is discussed in detail in Savage et al. (2000). The conclusion from this report is that, at the
concentrations of organic complexants predicted in the SFR 1 repository, only degradation products of cellulose, specifically iso-saccharanic acid (ISA) would influence the sorption of certain elements, specifically actinides, lanthanides and transition elements. Note is also taken of the conclusions of a previous Working Group established by SKI to assess the impact of cellulose degradation products on sorption (SKI, 1994).
The calculational basis described in Bradbury and Sarott (1995) is used here to determine the estimated maximum ISA concentration in waste packages, and the associated sorption reduction factors for Pu.
For a cellulose loading of ~ 1 wt. % (BMA), the maximum local ISA concentration is
estimated to be ~10-4 M, equivalent to a sorption reduction factor of ~ 500 (cf. 300
estimated in SKI, 1994). The elements affected, besides Pu, are Ac, Th, Am, and Cm, and, to a lesser extent, Pa, U and Np. Similarly, for a cellulose loading of ~ 0.1 wt. %
(BTF and Silo), the maximum local ISA concentration is estimated to be ~10-5 M,
equivalent to a sorption reduction factor of ~ 20 (cf. 30 estimated in SKI, 1994). The elements affected, besides Pu, are in this case only Ac, Th, Am, and Cm.
The above reduction factors are considered conservative and, for this reason, are taken
into account in the best estimate and pessimistic Kd values for the cementitious waste
conditioning matrix and grouting material, and, for other materials, only in the
pessimistic Kd values.
3.6
Sorption on Near-Field and Far-Field Rock
Near-field and far-field rock are treated in a similar way as no major differences in minerals are expected between these two barriers.
The geology of the Forsmark area comprises two main types of rock: granite gneiss and sedimentary gneiss, both fine- to medium-grained. The predominant minerals of the fractures are calcite, chlorite, quartz, laumontite, biotite and clay minerals (SKI, 1984). In these respects, the geology of the Forsmark area is similar to that of SFL 3-5
(Andersson, 1999).
Kd values for sorption on the near-field rock matrix are taken from the Kd database for
SR 97, taking account of the original values provided by Carbol and Engkvist (1997), the review of this work by Bruno et al. (1997) and the associated review by Stenhouse (2000).
Again, the nature of the near-field rock for the SFR 1 repository is similar to that for the SFL repository. Secondary minerals in fractures are assumed to contain higher sorbing minerals, e.g. a greater clay component, than those of the rock matrix. Here, the best
estimate Kd values for fracture minerals are taken from Table 10 of Stenhouse (1995)
since the reference mineralogy of the crystalline rock in Switzerland is qualitatively similar to that of the Swedish rock. In fact, these values are either the same as, or smaller than values compiled by Andersson (1996) for SITE-94, with one exception –
the Kd value for I is taken from the latter reference. The pessimistic Kd values, however,
are taken to be the same as those for the rock matrix, for the benefit of sensitivity analysis.
Pb was not included in the database of Carbol and Engkvist (1997) and a best estimate
Kd value for this element is taken from Albinsson (1991).
In all cases (near-field and far-field rock; fractures and matrix), the interacting groundwater is assumed conservatively to be saline. For a few elements (Sr, Cs, Ra),
17
Table 3.1
Best estim
ate and pessim
istic K
d
values for sorption on different substrates (m
3 /kg).
Best Estimate and Pessimistic K
d Values (m 3 /kg ) Silo : wa lls, b otto m, lid Silo : p or ou s co nc rete Silo : co mp ar tmen t wa lls Silo : mo ul ds Silo : co nd itio ni ng cemen t I II III I II III I II III I II III I II III C 0.5 a 0.01 d 0.5 a 0.01 d 0.01 a 0 d 0.5 a 0.01 d 0.5 a 0.01 d 0.01 a 0 d 0.5 a 0.01 d 0.5 a 0.01 d 0.01 a 0 d 0.5 a 0.01 d 0.5 a 0.01 d 0.01 a 0 d 0.5 a 0.01 d 0.5 a 0.01 d 0.01 a 0 d Fe [=Ni] 0.1 0.01 0.1 0.01 0.01 0.001 0.1 0.01 0.1 0.01 0.01 0.001 0.1 0.01 0.1 0.01 0.01 0.001 0.1 0.01 0.1 0.01 0.01 0.001 0.1 0.01 0.1 0.01 0.01 0.001 Ni 0.1 a 0.01 d 0.1 a 0.01 d 0.01 a 0.001 d 0.1 a 0.01 d 0.1 a 0.01 d 0.01 a 0.001 d 0.1 a 0.01 d 0.1 a 0.01 d 0.01 a 0.001 d 0.1 a 0.01 d 0.1 a 0.01 d 0.01 a .001 d 0.1 a 0.01 d 0.1 a 0.01 d 0.01 a 0.001 d Co [=Ni] 0.1 0.01 0.1 0.01 0.01 0.001 0.1 0.01 0.1 0.01 0.01 0.001 0.1 0.01 0.1 0.01 0.01 0.001 0.1 0.01 0.1 0.01 0.01 0.001 0.1 0.01 0.1 0.01 0.01 0.001 Sr 0.005 a 0.001 b 0.005 a 0.001 b 0.005 a 0.001 b 0.005 a 0.001 b 0.005 a 0.001 b 0.005 a 0.001 b 0.005 a 0.001 b 0.005 a 0.001 b 0.005 a 0.001 b 0.005 a 0.001 b 0.005 a 0.001 b 0.005 a 0.001 b 0.005 a 0.001 b 0.005 a 0.001 b 0.005 a 0.001 b Nb 0.5 a 0.01 d 0.5 a 0.01 d 0.1 a 0.01 d 0.5 a 0.01 d 0.5 a 0.01 d 0.1 a 0.01 d 0.5 a 0.01 d 0.5 a 0.01 d 0.1 a 0.01 d 0.5 a 0.01 d 0.5 a 0.01 d 0.1 a 0.01 d 0.5 a 0.01 d 0.5 a 0.01 d 0.1 a 0.01 d Tc (red.) Tc (ox.) 1 a 0.1 d 0.001 b 0 c 1 a 0.1 d 0.001 b 0 c 1 a 0.1 d 0 b ---1 a 0.1 d 0.001 b 0 c 1 a 0.1 d 0.001 b 0 c 1 a 0.1 d 0 b ---1 a 0.1 d 0.001 b 0 c 1 a 0.1 d 0.001 b 0 c 1 a 0.1 d 0 b ---1 a 0.1 d 0.001 b 0 c 1 a 0.1 d 0.001 b 0 c 1 a 0.1 d 0 b ---1 a 0.1 d 0.001 b 0 c 1 a 0.1 d 0.001 b 0 c 1 a 0.1 d 0 b ---Ru [=Pd] 0.5 a 0.001 b 0.5 a 0.001 b 0.1 a 0.001 b 0.5 a 0.001 b 0.5 a 0.001 b 0.1 a 0.001 b 0.5 a 0.001 b 0.5 a 0.001 b 0.1 a 0.001 b 0.5 a 0.001 b 0.5 a 0.001 b 0.1 a 0.001 b 0.5 a 0.001 b 0.5 a 0.001 b 0.1 a 0.001 b I 0.02 a 0 d 0.02 a 0 d 0.01 a 0 d 0.02 a 0 d 0.02 a 0 d 0.01 a 0 d 0.02 a 0 d 0.02 a 0 d 0.01 a 0 d 0.02 a 0 d 0.02 a 0 d 0.01 a 0 d 0.02 a 0 d 0.02 a 0 d 0.01 a 0 d Cs 0.001 a 0.0005 d 0.001 a 0.0005 d 0.005 a 0.001 d 0.001 a 0.0005 d 0.001 a 0.0005 d 0.005 a 0.001 d 0.001 a 0.0005 d 0.001 a 0.0005 d 0.005 a 0.001 d 0.001 a 0.0005 d 0.001 a 0.0005 d 0.005 a 0.001 d 0.001 a 0.0005 d 0.001 a 0.0005 d 0.005 a 0.001 d Pb 0.5 a 0.05 b 0.5 a 0.05 b 0.1 a 0.01 d 0.5 a 0.05 b 0.5 a 0.05 b 0.1 a 0.01 d 0.5 a 0.05 b 0.5 a 0.05 b 0.1 a 0.01 d 0.5 a 0.05 b 0.5 a 0.05 b 0.1 a 0.01 d 0.5 a 0.05 b 0.5 a 0.05 b 0.1 a 0.01 d Po [=Pb] 0.5 a 0.05 b 0.5 a 0.05 b 0.1 a 0.01 d 0.5 a 0.05 b 0.5 a 0.05 b 0.1 a 0.01 d 0.5 a 0.05 b 0.5 a 0.05 b 0.1 a 0.01 d 0.5 a 0.05 b 0.5 a 0.05 b 0.1 a 0.01 d 0.5 a 0.05 b 0.5 a 0.05 b 0.1 a 0.01 d
a Table 2.4, Savage et al. (2000); b Table 4, Bradbury
and Sarott (1995);
c Table 5.1, Krupka and Serne (1999); d arbitrary
value for sensitivity
analy
sis;
e Table 9-3, Vieno and Nordman,
18
Table 3.1 (continued)
Best estim
ate and pessim
istic K
d
values for sorption on different substrates (m
3 /kg).
Best Estimate and Pessimistic K
d Values (m 3 /kg ) Silo : wa lls, b otto m, lid Silo : p or ou s co nc rete Silo : co mp ar tmen t wa lls Silo : mo ul ds Silo : co nd itio ni ng cemen t I II III I II III I II III I II III I II III Pu 5 a 0.005 p 5 a 0.005 p 1 a 0.005 p 0.25 q 0.005 p 0.25 q 0.005 p 0.05 q 0.005 p 5 a 0.005 p 5 a 0.005 p 1 a 0.005 p 5 a 0.005 p 5 a 0.005 p 1 a 0.005 p 0.25 q 0.005 p 0.25 q 0.005 p 0.05 q 0.005 p Ra 0.05 a 0.005 d 0.05 a 0.005 d 0.05 a 0.005 d 0.05 a 0.005 d 0.05 a 0.005 d 0.05 a 0.005 d 0.05 a 0.005 d 0.05 a 0.005 d 0.05 a 0.005 d 0.05 a 0.005 d 0.05 a 0.005 d 0.05 a 0.005 d 0.05 a 0.005 d 0.05 a 0.005 d 0.05 a 0.005 d Ac 5 a 0.0025 t 5 a 0.0025 t 1 a 0.0025 t 0.25 q 0.0025 t 0.25 q 0.0025 t 0.05 q 0.005 t 5 a 0.0025 p 5 a 0.0025 p 1 a 0.0025 p 5 a 0.0025 p 5 a 0.0025 p 1 a 0.0025 p 0.25 q 0.0025 p 0.25 q 0.0025 p 0.05 q 0.0025 p Th 5 a 0.005 p 5 a 0.005 p 1 a 0.005 p 0.25 q 0.005 p 0.25 q 0.005 p 0.05 q 0.005 p 5 a 0.005 p 5 a 0.005 p 1 a 0.005 p 5 a 0.005 p 5 a 0.005 p 1 a 0.005 p 0.25 q 0.005 p 0.25 q 0.005 p 0.05 q 0.005 p Pa 0.5 a 0.1 d 0.5 a 0.1 d 0.1 a 0.01 d 0.5 a 0.1 d 0.5 a 0.1 d 0.1 a 0.01 d 0.5 a 0.1 d 0.5 a 0.1 d 0.1 a 0.01 d 0.5 a 0.1 d 0.5 a 0.1 d 0.1 a 0.01 d 0.5 a 0.1 d 0.5 a 0.1 d 0.1 a 0.01 d U (red.) U (ox.) 5 a 0.1 d 1 c 0.01 d 5 a 0.1 d 1 c 0.01 d 1 a 0.1 d 0.1 c 0.01 d 5 a 0.1 d 1 c 0.01 d 5 a 0.1 d 1 c 0.01 d 1 a 0.1 d 0.1 c 0.01 d 5 a 0.1 d 1 c 0.01 d 5 a 0.1 d 1 c 0.01 d 1 a 0.1 d 0.1 c 0.01 d 5 a 0.1 d 1 c 0.01 d 5 a 0.1 d 1 c 0.01 d 1 a 0.1 d 0.1 c 0.01 d 5 a 0.1 d 1 c 0.01 d 5 a 0.1 d 1 c 0.01 d 1 a 0.1 d 0.1 c 0.01 d Np (red.) Np (ox.) 5 a 0.1 d 2 c 0.01 d 5 a 0.1 d 2 c 0.01 d 1 a 0.1 d 0.1 b 0.01 d 5 a 0.1 d 2 c 0.01 d 5 a 0.1 d 2 c 0.01 d 1 a 0.1 d 0.1 b 0.01 d 5 a 0.1 d 2 c 0.01 d 5 a 0.1 d 2 c 0.01 d 1 a 0.1 d 0.1 b 0.01 d 5 a 0.1 d 2 c 0.01 d 5 a 0.1 d 2 c 0.01 d 1 a 0.1 d 0.1 b 0.01 d 5 a 0.1 d 2 c 0.01 d 5 a 0.1 d 2 c 0.01 d 1 a 0.1 d 0.1 b 0.01 d Am 5 a 0.0025 p 5 a 0.0025 p 1 a 0.0025 p 0.25 q 0.0025 p 0.25 q 0.0025 p 0.05 q 0.0025 p 5 a 0.0025 p 5 a 0.0025 p 1 a 0.0025 p 5 a 0.0025 p 5 a 0.0025 p 1 a 0.0025 p 0.25 q 0.0025 p 0.25 q 0.0025 p 0.05 q 0.0025 p Cm 5 a 0.0025 p 5 a 0.0025 p 1 a 0.0025 p 0.25 q 0.0025 p 0.25 q 0.0025 p 0.05 q 0.0025 p 5 a 0.0025 p 5 a 0.0025 p 1 a 0.0025 p 5 a 0.0025 p 5 a 0.0025 p 1 a 0.0025 p 0.25 q 0.0025 p 0.25 q 0.0025 p 0.05 q 0.0025 p
a : Table 2.4, Savage et al. (2000); c : Table 5.1, Krupka and Serne (1999); d : arbitrary
value for sensitivity
analy
sis;
e : Table 9-3, Vieno and Nordman (1998);
m :
Effect of organics
:
sorption reduction factors for Pu (Table 5) and certain other
elements relative to Pu (Table
9), Bradbury and Sarott (1995); p : = e + m ; q : = a + m .
19
Table 3.1 (continued)
Best estim
ate and pessim
istic K
d
values for sorption on different substrates (m
3 /kg).
Best Estimate and Pessimistic K
d Values (m 3 /kg ) BMA: const ruct ion concret e BMA: moul ds BTF: cons tr uct ion concret e BTF: moul ds BTF: porous concret e I II III I II III I II III I II III I II III C 0.5 a 0.01 d 0.5 a 0.01 d 0.01 a 0 d 0.5 a 0.01 d 0.5 a 0.01 d 0.01 a 0 d 0.5 a 0.01 d 0.5 a 0.01 d 0.01 a 0 d 0.5 a 0.01 d 0.5 a 0.01 d 0.01 a 0 d 0.5 a 0.01 d 0.5 a 0.01 d 0.01 a 0 d Fe [=Ni] 0.1 0.01 0.1 0.01 0.01 0.001 0.1 0.01 0.1 0.01 0.01 0.001 0.1 0.01 0.1 0.01 0.01 0.001 0.1 0.01 0.1 0.01 0.01 0.001 0.1 0.01 0.1 0.01 0.01 0.001 Ni 0.1 a 0.01 d 0.1 a 0.01 d 0.01 a 0.001 d 0.1 a 0.01 d 0.1 a 0.01 d 0.01 a 0.001 d 0.1 a 0.01 d 0.1 a 0.01 d 0.01 a 0.001 d 0.1 a 0.01 d 0.1 a 0.01 d 0.01 a 0.001 d 0.1 a 0.01 d 0.1 a 0.01 d 0.01 a 0.001 d Co [=Ni] 0.1 0.01 0.1 0.01 0.01 0.001 0.1 0.01 0.1 0.01 0.01 0.001 0.1 0.01 0.1 0.01 0.01 0.001 0.1 0.01 0.1 0.01 0.01 0.001 0.1 0.01 0.1 0.01 0.01 0.001 Sr 0.005 a 0.001 b 0.005 a 0.001 b 0.005 a 0.001 b 0.005 a 0.001 b 0.005 a 0.001 b 0.005 a 0.001 b 0.005 a 0.001 b 0.005 a 0.001 b 0.005 a 0.001 b 0.005 a 0.001 b 0.005 a 0.001 b 0.005 a 0.001 b 0.005 a 0.001 b 0.005 a 0.001 b 0.005 a 0.001 b Nb 0.5 a 0.01 d 0.5 a 0.01 d 0.1 a 0.01 d 0.5 a 0.01 d 0.5 a 0.01 d 0.1 a 0.01 d 0.5 a 0.01 d 0.5 a 0.01 d 0.1 a 0.01 d 0.5 a 0.01 d 0.5 a 0.01 d 0.1 a 0.01 d 0.5 a 0.01 d 0.5 a 0.01 d 0.1 a 0.01 d Tc (red.) Tc (ox.) 1 a 0.1 d 0.001 b 0 c 1 a 0.1 d 0.001 b 0 c 1 a 0.1 d 0 b ---1 a 0.1 d 0.001 b 0 c 1 a 0.1 d 0.001 b 0 c 1 a 0.1 d 0 b ---1 a 0.1 d 0.001 b 0 c 1 a 0.1 d 0.001 b 0 c 1 a 0.1 d 0 b ---1 a 0.1 d 0.001 b 0 c 1 a 0.1 d 0.001 b 0 c 1 a 0.1 d 0 b ---1 a 0.1 d 0.001 b 0 c 1 a 0.1 d 0.001 b 0 c 1 a 0.1 d 0 b ---Ru [=Pd] 0.5 a 0.001 b 0.5 a 0.001 b 0.1 a 0.001 b 0.5 a 0.001 b 0.5 a 0.001 b 0.1 a 0.001 b 0.5 a 0.001 b 0.5 a 0.001 b 0.1 a 0.001 b 0.5 a 0.001 b 0.5 a 0.001 b 0.1 a 0.001 b 0.5 a 0.001 b 0.5 a 0.001 b 0.1 a 0.001 b I 0.02 a 0 d 0.02 a 0 d 0.01 a 0 d 0.02 a 0 d 0.02 a 0 d 0.01 a 0 d 0.02 a 0 d 0.02 a 0 d 0.01 a 0 d 0.02 a 0 d 0.02 a 0 d 0.01 a 0 d 0.02 a 0 d 0.02 a 0 d 0.01 a 0 d Cs 0.001 a 0.0005 d 0.001 a 0.0005 d 0.005 a 0.001 d 0.001 a 0.0005 d 0.001 a 0.0005 d 0.005 a 0.001 d 0.001 a 0.0005 d 0.001 a 0.0005 d 0.005 a 0.001 d 0.001 a 0.0005 d 0.001 a 0.0005 d 0.005 a 0.001 d 0.001 a 0.0005 d 0.001 a 0.0005 d 0.005 a 0.001 d Pb 0.5 a 0.05 b 0.5 a 0.05 b 0.1 a 0.01 d 0.5 a 0.05 b 0.5 a 0.05 b 0.1 a 0.01 d 0.5 a 0.05 b 0.5 a 0.05 b 0.1 a 0.01 d 0.5 a 0.05 b 0.5 a 0.05 b 0.1 a 0.01 d 0.5 a 0.05 b 0.5 a 0.05 b 0.1 a 0.01 d Po [=Pb] 0.5 a 0.05 b 0.5 a 0.05 b 0.1 a 0.01 d 0.5 a 0.05 b 0.5 a 0.05 b 0.1 a 0.01 d 0.5 a 0.05 b 0.5 a 0.05 b 0.1 a 0.01 d 0.5 a 0.05 b 0.5 a 0.05 b 0.1 a 0.01 d 0.5 a 0.05 b 0.5 a 0.05 b 0.1 a 0.01 d
a : Table 2.4, Savage et al. (2000); b : Table 4, Bradbury
and Sarott (1995);
c : Table 5.1, Krupka and Serne (1999); d : arbitrary
value for sensitivity
analy
sis;
20
Table 3.1 (continued)
Best estim
ate and pessim
istic K
d
values for sorption on different substrates (m
3 /kg).
Best Estimate and Pessimistic K
d Values (m 3 /kg ) BMA: const ruct ion concret e BMA: moul ds BTF: cons tr uct ion concret e BTF: moul ds BTF: porous concret e I II III I II III I II III I II III I II III Pu 5 a 2E-04 p 5 a 2E-04 p 1 a 2E-04 p 5 a 2E-04 p 5 a 2E-04 p 1 a 2E-04 p 5 a 0.005 p 5 a 0.005 p 1 a 0.005 p 5 a 0.005 p 5 a 0.005 p 1 a 0.005 p 0.25 q 0.005 p 0.25 q 0.005 p 0.05 q 0.005 p Ra 0.05 a 0.005 d 0.05 a 0.005 d 0.05 a 0.005 d 0.05 a 0.005 d 0.05 a 0.005 d 0.05 a .005 d 0.05 a 0.005 d 0.05 a 0.005 d 0.05 a 0.005 d 0.05 a 0.005 d 0.05 a 0.005 d 0.05 a .005 d 0.05 a 0.005 d 0.05 a 0.005 d 0.05 a 0.005 d Ac 5 a 1E-04 v 5 a 1E-04 v 1 a 1E-04 v 5 a 1E-04 v 5 a 1E-04 v 1 a 1E-04 v 5 a 0.0025 v 5 a 0.0025 v 1 a 0.0025 v 5 a 0.0025 v 5 a 0.0025 v 1 a 0.0025 v 0.25 q 0.0025 v 0.25 q 0.0025 v 0.05 q 0.0025 v Th 5 a 2E-04 v 5 a 2E-04 v 1 a 2E-04 v 5 a 2E-04 v 5 a 2E-04 v 1 a 2E-04 v 5 a 0.005 v 5 a 0.005 v 1 a 0.005 v 5 a 0.005 v 5 a 0.005 v 1 a 0.005 v 0.25 q 0.005 v 0.25 q 0.005 v 0.05 q 0.005 v Pa 0.5 a 0.04 v 0.5 a 0.04 v 0.1 a 0.04 v 0.5 a 0.04 v 0.5 a 0.04 v 0.1 a 0.04 v 0.5 a 0.1 d 0.5 a 0.1 d 0.1 a 0.01 d 0.5 a 0.1 d 0.5 a 0.1 d 0.1 a 0.01 d 0.5 a 0.1 d 0.5 a 0.1 d 0.1 a 0.01 d U (red.) U (ox.) 5 a 0.04 v 1 c 0.004 v 5 a 0.04 v 1 c 0.004 v 1 a 0.04 v 0.1 c 0.004 v 5 a 0.04 v 1 c 0.004 v 5 a 0.04 v 1 c 0.004 v 1 a 0.04 v 0.1 c 0.004 v 5 a 0.1 d 1 c 0.01 d 5 a 0.1 d 1 c 0.01 d 1 a 0.1 d 0.1 c 0.01 d 5 a 0.1 d 1 c 0.01 d 5 a 0.1 d 1 c 0.01 d 1 a 0.1 d 0.1 c 0.01 d 5 a 0.1 d 1 c 0.01 d 5 a 0.1 d 1 c 0.01 d 1 a 0.1 d 0.1 c 0.01 d Np (red.) Np (ox.) 5 a 0.04 v 2 c 0.004 v 5 a 0.04 v 2 c 0.004 v 1 a 0.04 v 0.2 c 0.004 v 5 a 0.04 v 2 c 0.004 v 5 a 0.04 v 2 c 0.004 v 1 a 0.04 v 0.2 c 0.004 v 5 a 0.1 d 2 c 0.01 d 5 a 0.1 d 2 c 0.01 d 1 a 0.1 d 0.2 c 0.01 d 5 a 0.1 d 2 c 0.01 d 5 a 0.1 d 2 c 0.01 d 1 a 0.1 d 0.2 c 0.01 d 5 a 0.1 d 2 c 0.01 d 5 a 0.1 d 2 c 0.01 d 1 a 0.1 d 0.2 c 0.01 d Am 5 a 1E-04 p 5 a 1E-04 p 1 a 1E-04 p 5 a 1E-04 p 5 a 1E-04 p 1 a 1E-04 p 5 a 0.0025 p 5 a 0.0025 p 1 a 0.0025 p 5 a 0.0025 p 5 a 0.0025 p 1 a 0.0025 p 0.25 q 0.0025 p 0.25 q 0.0025 p 0.05 q 0.0025 p Cm 5 a 1E-04 p 5 a 1E-04 p 1 a 1E-04 p 5 a 1E-04 p 5 a 1E-04 p 1 a 1E-04 p 5 a 0.0025 p 5 a 0.0025 p 1 a 0.0025 p 5 a 0.0025 p 5 a 0.0025 p 1 a 0.0025 p 0.25 q 0.0025 p 0.25 q 0.0025 p 0.05 q 0.0025 p
Table 2.4, Savage et al. (2000);
b Table 4, Bradbury
and Sarott (1995);
c Table 5.1, Krupka and Serne (1999); d arbitrary
value for sensitivity
analy
sis;
Table 9-3, Vieno and Nordman (1998);
m :
Effect of organics
:
sorption reduction factors for Pu (Table 5) and for certa
in other elements (Table 9), Bradbury
and Sarott (1995); : = e + m ; q : = a + m ; v : = d + m ; w := c + m .
21
Table 3.1 (continued)
Best estim
ate and pessim
istic K
d
values for sorption on different substrates (m
3 /kg).
Best Estimate and Pessimistic K
d Values (m 3 /kg ) Wa ste ma trix [S ilo , BMA, BTF] ( porous concret e) St ruct ural concret e Bent oni te Sand-Bent oni te ( 90% :10% ) Sand I II III I II III I II III I II III I II III C 0.5 a 0.01 d 0.5 a 0.01 d 0.01 a 0 d 0.5 a 0.01 d 0.5 a 0.01 d 0.01 a 0 d 0 g ---0 g ---0 g ---0 h ---0 h ---0 h ---0 f ---0 f ---0 f ---Fe [=Ni] 0.1 0.01 0.1 0.01 0.01 0.001 0.1 0.01 0.1 0.01 0.01 0.001 0.1 0.02 0.1 0.02 0.1 0.02 0.05 0.003 0.05 0.003 0.05 0.003 0.04 0.001 0.04 0.001 0.04 0.001 Ni 0.1 a 0.01 d 0.1 a 0.01 d 0.01 a 0.001 d 0.1 a 0.01 d 0.1 a 0.01 d 0.01 a 0.001 d 0.1 g 0.02 g 0.1 g 0.02 g 0.1 g 0.02 g 0.05 h 0.003 h 0.05 h 0.003 h 0.05 h 0.003 h 0.04 f 0.001 d 0.04 f 0.001 d 0.04 f 0.001 d Co [=Ni] 0.1 0.01 0.1 0.01 0.01 0.001 0.1 0.01 0.1 0.01 0.01 0.001 0.1 0.02 0.1 0.02 0.1 0.02 0.05 0.003 0.05 0.003 0.05 0.003 0.04 0.001 0.04 0.001 0.04 0.001 Sr 0.005 a 0.001 b 0.005 a 0.001 b 0.005 a 0.001 b 0.005 a 0.001 b 0.005 a 0.001 b 0.005 a 0.001 b 0.01 g 0.001 g 0.01 g 0.001 g 0.01 g 0.001 g 0.002 h 0.0002 h 0.002 h 0.0002 h 0.002 h 0.0002 h 0.001 f 0.0001 d 0.001 f 0.0001 d 0.001 f 0.0001 d Nb 0.5 a 0.01 d 0.5 a 0.01 d 0.1 a 0.01 d 0.5 a 0.01 d 0.5 a 0.01 d 0.1 a 0.01 d 0.2 g 0 g 0.2 g 0 g 0.2 g 0 g 0.065 h 0 h 0.065 h 0 h 0.065 h 0 h 0.05 f 0 d 0.05 f 0 d 0.05 f 0 d Tc (red.) Tc (ox.) 1 a 0.1 d 0.001 b 0 c 1 a 0.1 d 0.001 b 0 c 1 a 0.1 d 0 b ---1 a 0.1 d 0.001 b 0 c 1 a 0.1 d 0.001 b 0 c 1 a 0.1 d 0 b ---0.1 g 0.01 g 0 f ---0.1 g 0.01 g 0 f ---0.1 g 0.01 g 0 f ---0.06 h 0.01 h 0 h ---0.06 h 0.01 h 0 h ---0.06 h 0.01 h 0 h ---0.05 f 0.01 f 0 f ---0.05 f 0.01 f 0 f ---0.05 f 0.01 f 0 f ---Ru [=Pd] 0.5 a 0.001 b 0.5 a 0.001 b 0.1 a 0.001 b 0.5 a 0.001 b 0.5 a 0.001 b 0.1 a 0.001 b 0.01 g 0 g 0.01 g 0 g 0.01 g 0 g 0.05 h 0 h 0.05 h 0 h 0.05 h 0 h 0.05 f 0 d 0.05 f 0 d 0.05 f 0 d I 0.02 a 0 d 0.02 a 0 d 0.01 a 0 d 0.02 a 0 d 0.02 a 0 d 0.01 a 0 d 0 g ---0 g ---0 g ---0 h ---0 h ---0 h ---0 f ---0 f ---0 f ---Cs 0.001 a 0.0001 d 0.001 a 0.0001 d 0.005 a 0.001 d 0.001 a 0.0001 d 0.001 a 0.0001 d 0.005 a 0.001 d 0.05 g 0.005 g 0.05 g 0.005 g 0.05 g 0.005 g 0.006 h 0.0006 h 0.006 h 0.0006 h 0.006 h 0.0006 h 0.001 f 0.0001 d 0.001 f 0.0001 d 0.001 f 0.0001 d Pb 0.5 a 0.05 b 0.5 a 0.05 b 0.1 a 0.01 d 0.5 a 0.05 b 0.5 a 0.05 b 0.1 a 0.01 d 0.5 g 0 g 0.5 g 0 g 0.5 g 0 g 0.1 h 0 h 0.1 h 0 h 0.1 h 0 h 0.05 f 0 d 0.05 f 0 d 0.05 f 0 d Po [=Pb] 0.5 0.05 0.5 0.05 0.1 0.01 0.5 0.05 0.5 0.05 0.1 0.01 0.5 0 0.5 0 0.5 0 0.1 0 0.1 0 0.1 0 0.05 0 0.05 0 0.05 0
a Table 2.4, Savage et al. (2000); b Table 4, Bradbury
and Sarott (1995);
c Table 5.1, Krupka and Serne (1999); d arbitrary
value for sensitivity
analy
sis;
e Table 9-3, Vieno and Nordman
(1998);
f : Appendix B, Stenhouse (1995); g : Tables A.2.3.2 (compacted
bentonite), Anderson (1999); h : = 0.9*K d (sand) + 0.1*K d (compacted bentonite).
22
Best estim
ate and pessim
istic K
d
values for sorption on different substrates (m
3 /kg).
Best Estimate and Pessimistic K
d Values (m 3 /kg ) Wa ste ma trix [S ilo , BTF] (p or ou s concret e St ruct ural concret e Bent oni te Sand-Bent oni te ( 90% :10% ) Sand I II III I II III I II III I II III I II III 0.25 q 0.005 p 0.25 q 0.005 p 0.05 q 0.005 p 5 a 0.005 p 5 a 0.005 p 1 a 0.005 p 3 g 0.05 r 3 g 0.05 r 3 g 0.05 r 0.75 h 0.01 s 0.75 h 0.01 s 0.75 h 0.01 s 0.5 f 0.005 t 0.5 f 0.005 t 0.5 f 0.005 t 0.05 a 0.005 d 0.05 a 0.005 d 0.05 a 0.005 d 0.05 a 0.005 d 0.05 a 0.005 d 0.05 a 0.005 d 0.01 g 0.001 g 0.01 g 0.001 g 0.01 g 0.001 g 0.004 h 0.0006 h 0.004 h 0.0006 h 0.004 h 0.0006 h 0.003 f 0.0005 d 0.003 f 0.0005 d 0.003 f 0.0005 d ] 0.25 q 0.0025 p 0.25 q 0.0025 p 0.05 q 0.0025 p 5 a 0.0025 p 5 a 0.0025 p 1 a 0.0025 p 3 0.05 3 0.05 3 0.05 1 h 0.005 h 1 h 0.005 h 1 h 0.005 h 1 f 5E-04 v 1 f 5E-04 v 1 f 5E-04 v 0.25 q 0.005 v 0.25 q 0.005 v 0.05 q 0.005 v 5 a 0.005 v 5 a 0.005 v 1 a 0.005 v 3 g 0.005 r 3 g 0.005 r 3 g 0.005 r 1 h 0.001 w 1 h 0.001 w 1 h 0.001 w 1 f 5E-04 v 1 f 5E-04 v 1 f 5E-04 v 0.5 a 0.1 d 0.5 a 0.1 d 0.1 a 0.01 d 0.5 a 0.1 d 0.5 a 0.1 d 0.1 a 0.01 d 0.3 g 0.001 g 0.3 g 0.001 g 0.3 g 0.001 g 0.1 h 0.009 h 0.1 h 0.009 h 0.1 h 0.009 h 0.1 f 0.01 d 0.1 f 0.01 d 0.1 f 0.01 d 5 a 0.1 d 1 c 0.01 d 5 a 0.1 d 1 c 0.01 d 1 a 0.1 d 0.1 c 0.01 d 5 a 0.1 d 1 c 0.01 d 5 a 0.1 d 1 c 0.01 d 1 a 0.1 d 0.1 c 0.01 d 1 g 0.01 g 1 g 0.01 g 1 g 0.01 g 1 h 0.01 h 1 h 0.01 h 1 h 0.01 h 1 f 0.01 d 0.02 f 0.001 d 1 f 0.01 d 0.02 f 0.001 d 1 f 0.01 d 0.02 f 0.001 d 5 a 0.1 d 2 c 0.01 d 5 a 0.1 d 2 c 0.01 d 1 a 0.1 d 0.2 c 0.01 d 5 a 0.1 d 2 c 0.01 d 5 a 0.1 d 2 c 0.01 d 1 a 0.1 d 0.2 c 0.01 d 3 g 0.1 g 3 g 0.1 g 3 g 0.1 g 1 h 0.02 h 1 h 0.02 h 1 h 0.02 h 1 f 0.01 d 0.02 f 0.001 d 1 f 0.01 d 0.02 f 0.001 d 1 f 0.01 d 0.02 f 0.001 d 0.25 q 0.0025 p 0.25 q 0.0025 p 0.05 q 0.0025 p 5 a 0.0025 p 5 a 0.0025 p 1 a 0.0025 p 3 g 0.05 r 3 g 0.05 r 3 g 0.05 r 1 h 0.005 h 1 h 0.005 h 1 h 0.005 h 1 f 5E-04 v 1 f 5E-04 v 1 f 5E-04 v 0.25 q 0.0025 p 0.25 q 0.0025 p 0.05 q 0.0025 p 5 a 0.0025 p 5 a 0.0025 p 1 a 0.0025 p 3 g 0.05 r 3 g 0.05 r 3 g 0.05 r 1 h 0.005 h 1 h 0.005 h 1 h 0.005 h 1 f 5E-04 v 1 f 5E-04 v 1 f 5E-04 v b Table 4, Bradbury and Sarott (1995);
c Table 5.1, Krupka and Serne (1999); d arbitrary
value for sensitivity
analy
sis;
f Stenhouse (1995); g Table A2.3.2, Anderson (1999); h = 0.9*K d (sand) + 0.1*K d (compacted bentonite); m : Effect of organics : sorption reduction
ts relative to Pu (Table 9), Bradbury
and Sarott (1995); p : = e + m ; q : = a + m ; r : = g + m ; v : = d + m .
23
Table 3.1 (continued)
Best estim
ate and pessim
istic K
d
values for sorption on different substrates (m
3 /kg).
Best Estimate and Pessimistic
Kd Values (m 3 /kg ) Waste matrix [ B MA] (porous concret e) I II III Pu 0.01 q 2E-04 v 0.01 q 2E-04 v 0.002 q 2E-04 v Ra 0.05 a 0.005 d 0.05 a 0.005 d 0.05 a 0.005 d Ac [=Am ] 0.01 1E-04 0.01 1E-04 0.002 1E-04 Th 0.01 q 2E-04 v 0.01 q 2E-04 v 0.002 q 2E-04 v Pa 0.2 q 0.04 v 0.2 q 0.04 v 0.04 q 0.004 v U (red.) U (ox.) 2 q 0.04 v 0.4 w 0.004 v 2 q 0.04 v 0.4 w 0.004 v 0.4 q 0.04 v 0.04 w 0.004 v Np (red.) Np (ox.) 2 q 0.04 v 0.8 w 0.004 v 2 q 0.04 v 0.8 w 0.004 v 0.4 q 0.04 v 0.08 w 0.004 v Am 0.01 q 1E-04 p 0.01 q 1E-04 p 0.002 q 1E-04 p Cm 0.01 q 1E-04 p 0.01 q 1E-04 p 0.002 q 1E-04 p
a Table 2.4, Savage et al. (2000); d arbitrary
value for sensitivity
analy
sis
;
e Table 9-3, Vieno and Nordman (1998);
m :
Effect of organics
:
sorption reduction factors for Pu (Table 5)
and for certain other elements rela
tive to Pu (Table 9), Bradbury
and Sarott (1995); p : = e + m ; q : = a + m ; v : = d + m ; w := c + m .
24
Best estim
ate and pessim
istic K
d
values for sorption on different substrates (m
3 /kg): saline conditions.
Best Estimate and Pessimistic K
d Values (m 3 /kg ) Ba ckfill (cru sh ed ro ck) Nea r-field ro ck: fra ctu res N ea r-field ro ck: ma trix Fa r-field ro ck: fra ctu res F ar -field ro ck: ma trix I II III I II III I II III I II III I II III 0.001 g 0 d 0.001 g 0 d 0.001 g 0 d 0.001 o 0 o 0.001 o 0 o 0.001 o 0 o 0.001 g 0 d 0.001 g 0 d 0.001 g 0 d 0.001 o 0 o 0.001 o 0 o 0.001 o 0 o 0.001 g 0 d 0.001 g 0 d 0.001 g 0 d 0.02 0.005 0.02 0.005 0.02 0.005 0.5 0.005 0.5 0.005 0.5 0.005 0.02 0.005 0.02 0.005 0.02 0.005 0.5 0.005 0.5 0.005 0.5 0.005 0.02 0.005 0.02 0.005 0.02 0.005 0.02 k 0.005 d 0.02 k 0.005 d 0.02 k 0.005 d 0.5 o 0.005 d 0.5 o 0.005 d 0.5 o 0.005 d 0.02 k 0.005 d 0.02 k 0.005 d 0.02 k 0.005 d 0.5 o 0.005 d 0.5 o 0.005 d 0.5 o 0.005 d 0.02 k 0.005 d 0.02 k 0.005 d 0.02 k 0.005 d 0.02 0.005 0.02 0.005 0.02 0.005 0.5 0.005 0.5 0.005 0.5 0.005 0.02 0.005 0.02 0.005 0.02 0.005 0.5 0.005 0.5 0.005 0.5 0.005 0.02 0.005 0.02 0.005 0.02 0.005 5 ) 2 i i 1 2 i i 1 2 i i 1 500 f 1 d 500 f 1 d 500 f 1 d 2 i i 1 2 i 1 i 2 i 1 i 500 f 1 d 500 f 1 d 500 f 1 d 2 i 1 i 2 i 1 i 2 i 1 i 1 k 0.1 d 1 k 0.1 d 1 k 0.1 d 1 o 0.1 o 1 o 0.1 o 1 o 0.1 o 1 k 0.1 d 1 k 0.1 d 1 k 0.1 d 1 o 0.1 o 1 o 0.1 o 1 o 0.1 o 1 k 0.1 d 1 k 0.1 d 1 k 0.1 d 1 k 0.1 d 0 k ---1 k 0.1 d 0 k ---1 k 0.1 d 0 k ---0.5 o 0.05 o 0 k ---0.5 o 0.05 o 0 k ---0.5 o 0.05 o 0 k ---1 k 0.1 d 0 k ---1 k 0.1 d 0 k ---1 k 0.1 d 0 k ---0.5 o 0.05 o 0 k ---0.5 o 0.05 o 0 k ---0.5 o 0.05 o 0 k ---1 k 0.1 d 0 k ---1 k 0.1 d 0 k ---1 k 0.1 d 0 k ---0.01 k 0.001 k 0.01 k 0.001 k 0.01 k 0.001 k 0.5 o 0.001 d 0.5 o 0.001 d 0.5 o 0.001 d 0.01 k 0.001 k 0.01 k 0.001 k 0.01 k 0.001 k 0.5 o 0.001 d 0.5 o 0.001 d 0.5 o 0.001 d 0.01 k 0.001 k 0.01 k 0.001 k 0.01 k 0.001 k 0 k ---0 k ---0 k ---0.0005 l 0 o 0.0005 l 0 o 0.0005 l 0 o 0 k ---0 k ---0 k ---0.0005 l 0 o 0.0005 l 0 o 0.0005 l 0 o 0 k ---0 k ---0 k ---0.05 k 0.01 k 0.05 k 0.01 k 0.05 k 0.01 k 0.1 o 0.01 o 0.1 o 0.01 o 0.1 o 0.01 o 0.05 k 0.01 k 0.05 k 0.01 k 0.05 k 0.01 k 0.1 o 0.01 o 0.1 o 0.01 o 0.1 o 0.01 o 0.05 k 0.01 k 0.05 k 0.01 k 0.05 k 0.01 k 1 j 0.05 d 1 j 0.05 d 1 j 0.05 d 0.5 o 0.05 o 0.5 o 0.05 o 0.5 o 0.05 o 1 j 0.05 d 1 j 0.05 d 1 j 0.05 d 0.5 o 0.05 o 0.5 o 0.05 o 0.5 o 0.05 o 1 j 0.05 d 1 j 0.05 d 1 j 0.05 d 1 0.05 1 0.05 1 0 05 0.5 0.05 0.5 0.05 0.5 0.05 1 0.05 1 0.05 1 0.05 0.5 0.05 0.5 0.05 0.5 0.05 1 0.05 1 0.05 1 0.05 b Table 4, Bradbury and Sarott (1995);
c Table 5.1, Krupka and Serne (1999); d arbitrary
value for sensitivity
analy
sis;
e Table 9-3, Vieno and Nordman (1998);
f
i : Bruno and Duro (1997); j : Albinsson (1991); k Table 12-1, Carbol and Engkvist (1997) - also Table A2.6.2, Andersson (1999);
l
:Andersson (1996);
m : Effect of
in other elements relative to Pu (Table 9), Bradbury
and Saro
tt (1995);
25
Table 3.1 (continued)
Best estim
ate and pessim
istic K
d
values for sorption on different substrates (m
3 /kg).
Best Estimate and Pessimistic K
d Values (m 3 /kg ) Ba ckfill (cru sh ed ro ck) Nea r-field ro ck: fra ctu res N ea r-field ro ck: ma trix Fa r-field ro ck: fra ctu res F ar -field ro ck: ma trix I II III I II III I II III I II III I II III Pu 5 k 0.005 v 5 k 0.005 v 5 k 0.005 v 5 o 0.005 v 5 o 0.005 v 5 o 0.005 v 5 k 0.005 v 5 k 0.005 v 5 k 0.005 v 5 o 0.005 v 5 o 0.005 v 5 o 0.005 v 5 k 0.005 v 5 k 0.005 v 5 k 0.005 v Ra 0.02 g 0.005 d 0.02 g 0.005 d 0.02 g 0.005 d 0.2 o 0.005 d 0.2 o 0.005 d 0.2 o 0.005 d 0.02 g 0.005 d 0.02 g 0.005 d 0.02 g 0.005 d 0.2 o 0.005 d 0.2 o 0.005 d 0.2 o 0.005 d 0.02 g 0.005 d 0.02 g 0.005 d 0.02 g 0.005 d Ac [=A m ] 3 k 0.005 v 3 k 0.005 v 3 k 0.005 v 5 o 0.005 v 5 o 0.005 v 5 o 0.005 v 3 k 0.005 v 3 k 0.005 v 3 k 0.005 v 5 o 0.005 v 5 o 0.005 v 5 o 0.005 v 3 k 0.005 v 3 k 0.005 v 3 k 0.005 v Th 5 k 0.005 v 5 k 0.005 v 5 k 0.005 v 1 o 0.005 u 1 o 0.005 u 1 o 0.005 u 5 k 0.005 v 5 k 0.005 v 5 k 0.005 v 1 o 0.005 u 1 o 0.005 u 1 o 0.005 u 5 k 0.005 v 5 k 0.005 v 5 k 0.005 v Pa 1 k 0.1 d 1 k 0.1 d 1 k 0.1 d 1 o 0.1 o 1 o 0.1 o 1 o 0.1 o 1 k 0.1 d 1 k 0.1 d 1 k 0.1 d 1 o 0.1 o 1 o 0.1 o 1 o 0.1 o 1 k 0.1 d 1 k 0.1 d 1 k 0.1 d U (red.) U (ox.) 5 k 0.1 d 0.005 k 0.001 k 5 k 0.1 d 0.005 k 0.001 k 5 k 0.1 d 0.005 k 0.001 k 1 o 0.1 o 0.005 k 0.001 k 1 o 0.1 o 0.005 k 0.001 k 1 o 0.1 o 0.005 k 0.001 k 5 k 0.1 d 0.005 k 0.001 k 5 k 0.1 d 0.005 k 0.001 k 5 k 0.1 d 0.005 k 0.001 k 1 o 0.1 o 0.005 k 0.001 k 1 o 0.1 o 0.005 k 0.001 k 1 o 0.1 o 0.005 k 0.001 k 5 k 0.1 d 0.005 k 0.001 k 5 k 0.1 d 0.005 k 0.001 k 5 k 0.1 d 0.005 k 0.001 k Np (red.) Np (ox.) 5 k 0.1 d 0.005 k 0.001 k 5 k 0.1 d 0.005 k 0.001 k 5 k 0.1 d 0.005 k 0.001 k 1 o 0.1 o 0.005 k 0.001 k 1 o 0.1 o 0.005 k 0.001 k 1 o 0.1 o 0.005 k 0.001 k 5 k 0.1 d 0.005 k 0.001 k 5 k 0.1 d 0.005 k 0.001 k 5 k 0.1 d 0.005 k 0.001 k 1 o 0.1 o 0.005 k 0.001 k 1 o 0.1 o 0.005 k 0.001 k 1 o 0.1 o 0.005 k 0.001 k 5 k 0.1 d 0.005 k 0.001 k 5 k 0.1 d 0.005 k 0.001 k 5 k 0.1 d 0.005 k 0.001 k Am 3 k 0.005 v 3 k 0.005 v 3 k 0.005 v 5 o 0.005 v 5 o 0.005 v 5 o 0.005 v 3 k 0.005 v 3 k 0.005 v 3 k 0.005 v 5 o 0.005 v 5 o 0.005 v 5 o 0.005 v 3 k 0.005 v 3 k 0.005 v 3 k 0.005 v Cm 3 k 0.005 v 3 k 0.005 v 3 k 0.005 v 5 o 0.005 v 5 o 0.005 v 5 o 0.005 v 3 k 0.005 v 3 k 0.005 v 3 k 0.005 v 5 o 0.005 v 5 o 0.005 v 5 o 0.005 v 3 k 0.005 v 3 k 0.005 v 3 k 0.005 v a Savage et al. (2000); b : Table 4, Bradbury and Sarott (1995);
c Table 5.1, Krupka and Serne (1999); d arbitrary
value for sensitivity
analy
sis;
e Table 9-3, Vieno and Nordman (1998); (1998); f Appendix B, Stenhouse (1995); g Tables A.2.3.2 (com
pacted bentonite) a
nd A.2.6.2 (granitic rock), Anderson (1999);
h Table 10, Stenhouse (1995); i : Bruno and Duro (1997); j : Albinsson (1991); k Table 12-1, Carbol and Engkvist (1997); l Andersson (1996); m :
Effect of organics
:
sorption reduction
factors for Pu (Table 5) and for certain other elemen
ts relative to Pu (Table 9), Bradbury
and Sarott (1995); o : Table 10, Stenhouse (1995); r : = g + m ; s : = k + m ; u : = o + m ; v : = d + m .