Report number: 2019:16 ISSN: 2000-0456 Available at www.stralsakerhetsmyndigheten.se
2019:16
SSM’s external experts’ reviews of
SKB’s safety assessment SR-PSU –
consequence analysis and hydrogeological aspects
Main review phase
SSM 2019:16
SSM perspective
BackgroundThe Swedish Radiation Safety Authority (SSM) received an application
for the expansion of SKB’s final repository for low and intermediate level
waste at Forsmark (SFR) on the 19 December 2014. SSM is tasked with
the review of the application and will issue a statement to the
govern-ment who will decide on the matter. An important part of the
applica-tion is SKB’s assessment of the long-term safety of the repository, which
is documented in the safety analysis named SR-PSU.
The present report compiles results from SSM’s external experts’ reviews
of SR-PSU during the main review phase. The general objective of these
reviews has been to give support to SSM’s assessment of the license
application. More specifically, the instructions to the external experts
have been to make an in depth assessment of the specific issues defined
for the different disciplines.
Project information
Contact person at SSM: Henrik Öberg
Contact persons and registration numbers for the different review
con-tributions are given in the report.
Table of contents
1. Further review of 1BMA and updated 2BMA design – Main review
phase Rebecca Newson and George Towler
2. Assessment of transport parameters and hydrogeological aspects of
future human actions – Main review phase – Joel Geier
3. Evaluation of hydrogeological risks associated with water-supply
wells in a future warmer climate – Main review phase – Joel Geier
2019:16
Date: October 2019Report number: 2019:16 ISSN: 2000-0456 Available at www.stralsakerhetsmyndigheten.se
SSM’s external experts’ reviews of
SKB’s safety assessment SR-PSU –
consequence analysis and hydrogeological aspects
Main review phase
SSM 2019:16
This report concerns a study which has been conducted for the
Swedish Radiation Safety Authority, SSM. The conclusions and
view-points presented in the report are those of the author/authors and
do not necessarily coincide with those of the SSM.
Authors: Rebecca Newson1) and George Towler1)
1)Quintessa Limited, Henley on Thames, UK
Further review of 1BMA and
updated 2BMA design –
Main review phase
Activity number: 3030014-1037
Registration number: SSSM2018-3015 Contact person at SSM: Henrik Öberg
3
Abstract
The Swedish Radiation Safety Authority (SSM) received an application for the expansion of SKB’s final repository for low and intermediate level waste at Forsmark (SFR) on 19 December 2014. SSM is tasked with the review of the application and will issue a statement to the government who will decide on the matter. An important part of the application is SKB’s assessment of the long-term safety of the repository, which is documented in the safety analysis named SR-PSU. SSM’s review is divided into an initial review phase and a main review phase. This assignment contributes to the main review phase. In a study already undertaken as part of the main review phase, some of SKB’s radionuclide transport models were reimplemented using the information provided in the SR-PSU documentation. The results were compared with the results of SKB’s models, and model sensitivity and reasons for differences in the results were explored. The models reimplemented were SKB’s near-field model for the proposed 2BMA vault, and SKB’s model for the geosphere. SKB used the ECOLEGO code. The models were reimplemented using the AMBER code.
This assignment explores key issues that have emerged during the main review phase, and the implications of recent further design and assessment work undertaken by SKB for the 2BMA vault. This assignment includes two tasks:
1. Reimplementing SKB’s models for the 1BMA vault to explore some of the key SR-PSU results. In particular, to explore the role of the 1BMA concrete structure as a barrier to radionuclide release from the vault.
2. Reimplementing SKB’s models of an updated design for the 2BMA vault. An additional task was then undertaken to investigate the effect of removing the grout around the bitumen-solidified wastes in the 1BMA vault.
For both tasks SKB’s models have been reimplemented in AMBER. The AMBER models used in this assignment represent a single concrete compartment (1BMA) or caisson (2BMA). The 1BMA AMBER models broadly reproduce SKB’s results, but generally give higher peak fluxes than SKB’s ECOLGEO models. This may be an artefact of only representing a single concrete compartment, so retardation of radionuclides by transport through downgradient compartments is not modelled. (This process is likely less significant for 2BMA, where the caissons are separated by Macadam backfill).
The AMBER models confirm that the concrete walls in the 1BMA vault are a key barrier to radionuclide transport. However, the radionuclide fluxes from the 1BMA vault to the geosphere are less sensitive to fracturing of the walls than for the 2BMA vault. The difference seems to be due to the greater concentrations of organic complexing agents in 1BMA compared with 2BMA. Cracking of the concrete walls results in transport through the walls without sorption. Complexing agents reduce sorption onto the concrete walls, and therefore as complexation increases, sensitivity to cracking of the walls decreases. The treatment of organic complexation in SKB’s models, particularly apparent differences in the treatment of complexation in 1BMA and 2BMA, would benefit from clarification.
Removal of grout from around the bitumen-solidified waste packages in the 1BMA vault increases the flux of high-sorbing radionuclides to the geosphere.
Radionuclides which do not sorb strongly to cement are not significantly affected by removal of the grout. However, the calculations do not include the impact of
4
removing the grout on water flows through the wastes. Removing the grout could increase water flows through the wastes, and further increase the releases of all radionuclides.
SKB’s assessment shows that the new design for 2BMA has little impact on the radionuclide fluxes from the near-field to the geosphere. Therefore, the calculated doses are little changed compared with SR-PSU. We found that the new design results in increased radionuclide fluxes from the near-field to the geosphere. The magnitude of the increase is small for radionuclides that do not sorb onto cement, but larger for radionuclides that sorb strongly onto cement. The main cause of the increased fluxes is removal of the grout fill around the waste packages, inside the caisson. So, there is no grout for radionuclides to sorb onto. It is not clear whether the grout has been removed from SKB’s models of the new 2BMA design.
5
Contents
1 Introduction ... 6
2 Single-Caisson Model of the 1BMA Vault... 8
2.1 Description of the Vault ... 8
2.1.1 Layout ... 8
2.1.2 Wastes ... 8
2.1.3 Material Properties ... 10
2.2 Global Warming Calculation Case (CCM_GW) ... 11
2.2.1 Model Implementation ... 11
2.2.2 Fracture Model ... 12
2.2.3 Results ... 13
2.2.4 Conclusions ... 15
2.3 Accelerated Concrete Degradation (CCL_BC) ... 16
2.3.1 Results ... 16 2.3.2 Conclusions ... 18 2.4 Bitumen-Solidified Waste ... 19 2.4.1 Inventory ... 19 2.4.2 Results ... 20 2.4.3 Conclusions ... 24
3 Updated Single-Caisson Model of 2BMA Vault with New Design ... 25
3.1 Single-Caisson Model of 2BMA for the Global Warming Calculation Case (CCM_GW) ... 25
3.1.1 Description ... 25
3.1.2 Results ... 25
3.1.3 Conclusions ... 28
3.2 Organic Complexants Sensitivity Analysis ... 28
3.2.1 Description ... 28
3.2.2 Results ... 29
3.2.3 Conclusions ... 30
3.3 Updated 2BMA Design ... 30
3.3.1 Description of the Updated Design ... 30
3.3.2 Results ... 32
3.3.3 Conclusions ... 35
4 Summary of Findings ... 37
6
1
Introduction
The Swedish Radiation Safety Authority (SSM) has received an application for the expansion of SKB’s final repository for low and intermediate level waste at Forsmark (SFR) on 19 December 2014. SSM is tasked with the review of the application and will issue a statement to the government who will decide on the matter. An important part of the application is SKB’s assessment of the long-term safety of the repository, which is documented in the safety analysis named SR-PSU. SSM’s review is divided into an initial review phase and a main review phase. This assignment contributes to the main review phase.
Earlier in the main review phase, Towler and Penfold (2017a) reimplemented some of SKB’s radionuclide transport models using the information provided in the SR-PSU documentation. The results were compared with the results of SKB’s models, and model sensitivity and reasons for differences in the results were explored. Towler and Penfold (2017a) reimplemented SKB’s near-field model for the proposed 2BMA vault, and SKB’s model for the geosphere. Towler and Penfold (2017a) implemented the models using the AMBER code (Quintessa, 2016), while SKB used the ECOLEGO code1.
This assignment explores key issues that have emerged during the main review phase, and the implications of recent further design and assessment work, undertaken by SKB for the 2BMA vault. This assignment includes two tasks. The 1BMA vault concrete structure and 2BMA concrete caissons have been identified as key features for containment of radionuclides. Defects have been identified in the concrete structure in the existing 1BMA vault. The scope of the first task is to understand the potential impacts of the defects further, by reimplementing SKB’s near-field radionuclide transport model for a single concrete compartment in the 1BMA vault and:
a. Comparing the radionuclide fluxes from the near-field to the geosphere with those calculated by SKB in SR-PSU for the Global Warming calculation case (CCM_GW).
b. Modifying the radionuclide transport model by adding the concrete fracture model, which was included in subsequent complementary information provided by SKB (2017), and comparing the impact on the radionuclide fluxes from the near-field with SKB’s findings.
c. Running the model for SKB’s Accelerated Concrete Degradation calculation case (CCM_BC) and reporting the impact on the radionuclide fluxes from the near-field.
An additional task was then undertaken to investigate the effect of removing the grout around the bitumen-solidified wastes. This was done by running a new AMBER model in which the 1BMA single compartment model was adapted to contain only bitumen-solidified wastes with no surrounding grout. The radionuclide fluxes from the near-field were compared with the model in (b).
SKB have recently proposed a revised design for the 2BMA vault. SKB’s radionuclide transport model for the 2BMA design that was assessed in SR-PSU, has already been reimplemented in the AMBER code (Towler and Penfold, 2017a). This included development of a simplified model that considers a single caisson for
7
the Global Warming calculation case. The scope of the second task in this assignment is to modify the AMBER single caisson model to reflect the new engineering design. The impact of the new design on the radionuclide fluxes from the near-field is assessed and compared against the results of SKB’s calculations.
Approach
There are two tasks in this assignment: reimplementing SKB’s models for 1BMA, and reimplementing SKB’s models for the new 2BMA design. Towler and Penfold (2017a) showed that a simplified model of a single caisson could produce very similar results to a model of all the caissons in the 2BMA vault. Therefore, models of a single compartment in the 1BMA vault, and a single caisson in the 2BMA vault, are used in this assignment.
Towler and Penfold (2017a) did not reimplement SKB’s models for 1BMA, so the 1BMA models presented in this report have been developed during this assignment. The 2BMA single caisson model, developed by Towler and Penfold (2017a), has been updated during this assignment: to include the improved understanding of SKB’s approach described by Towler and Penfold (2017b), and additional
clarifications recently provided to SSM by SKB. The updated 2BMA single caisson model forms the basis for the second task in this assignment.
Report Structure
This report is structured as follows:
Section 2 presents the AMBER model of the 1BMA vault. o Section 2.1 presents a description of the 1BMA vault.
o Section 2.2 presents the results for the CCM_GW case with and without the fracture model implemented.
o Section 2.3 presents the results for the CCL_BC case.
o Section 2.4 presents the results for bitumen-solidified waste not surrounded by grout.
Section 3 presents the results for the CCM_GW case for the updated 2BMA vault design.
o Section 3.1 describes the updated 2BMA single caisson model for the corrected CCM_GW case.
o Section 3.2 presents the results of a sensitivity analysis where organic complexants are included in the model.
o Section 3.3 presents the results for the CCM_GW case and SKB’s new 2BMA design.
8
2
Single-Caisson Model of the 1BMA
Vault
2.1
Description of the Vault
2.1.1
Layout
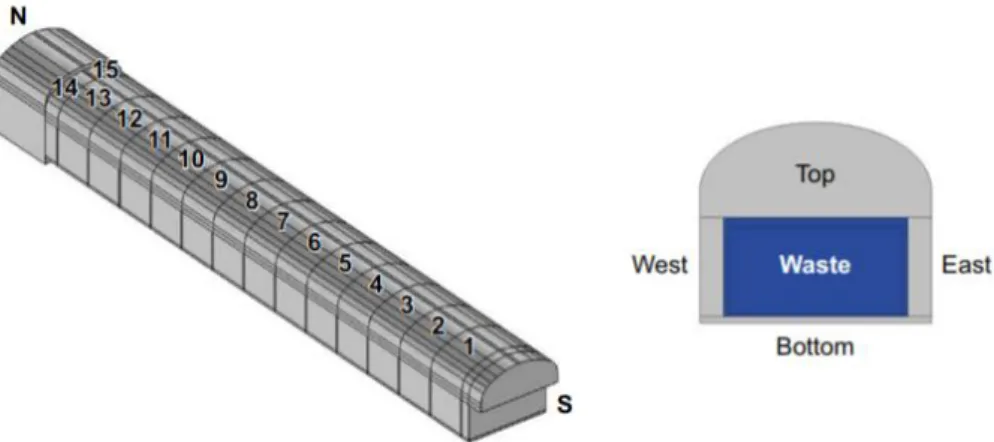
The 1BMA vault is the existing vault for intermediate-level waste in SFR. Unlike the 2BMA vault in which waste is stored in caissons separated by backfill, the 1BMA vault is a single concrete structure with waste stored in adjacent sections separated by concrete walls (Figure 2-1).
Figure 2-1. Layout of the 1BMA vault (left) and a cross-section of the vault (right). Image reproduced from SKB, 2014b (TR-14-09).
Within each section of the concrete structure, the wastes are embedded in grout. The 1BMA vault will be backfilled, around the concrete structure, with Macadam.
2.1.2
Wastes
The 1BMA vault contains the following waste types:
Concrete-embedded wastes in concrete moulds (CM_E) Cement-solidified wastes in concrete moulds (CM_CS) Concrete-embedded wastes in steel moulds (SM_E) Cement-solidified wastes in steel moulds (SM_CS) Bitumen-solidified wastes in steel moulds (SM_BS) Concrete-embedded wastes in steel drums (SD_E) Bitumen-solidified wastes in steel drums (SD_BS)
The numbers of waste packages associated with each waste stream is described in Appendix A of SKB, 2014a (TR-14-02). These have been categorised into the waste types above, as summarised in Table 2-1.
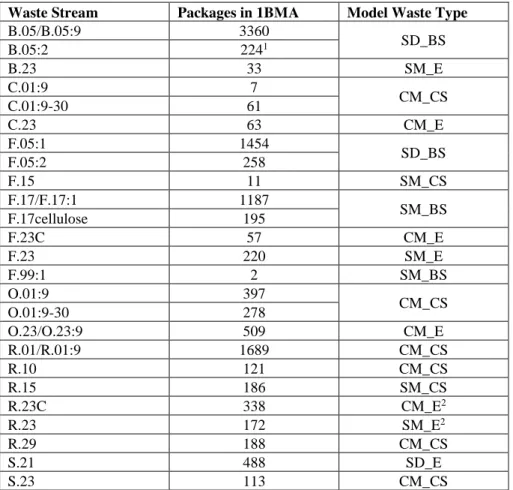
9 Table 2-1. Waste streams in 1BMA.
Waste Stream Packages in 1BMA Model Waste Type
B.05/B.05:9 3360 SD_BS B.05:2 2241 B.23 33 SM_E C.01:9 7 CM_CS C.01:9-30 61 C.23 63 CM_E F.05:1 1454 SD_BS F.05:2 258 F.15 11 SM_CS F.17/F.17:1 1187 SM_BS F.17cellulose 195 F.23C 57 CM_E F.23 220 SM_E F.99:1 2 SM_BS O.01:9 397 CM_CS O.01:9-30 278 O.23/O.23:9 509 CM_E R.01/R.01:9 1689 CM_CS R.10 121 CM_CS R.15 186 SM_CS R.23C 338 CM_E2 R.23 172 SM_E2 R.29 188 CM_CS S.21 488 SD_E S.23 113 CM_CS
1 There are actually 892 drums of B.05:2 waste in 1BMA but these are represented as 224 ‘units’ to normalise the inventory in each drum (TR-14-02).
2 SKB docID 1601415 classifies R.23 and R.23C as cement-solidified rather than concrete-embedded, which contradicts TR-14-02.
The total resulting number of packages of each type is given in Table 2-2. In Table 2-2, waste streams have been assigned to different waste types using the mapping in SKB docID 1601415.
Table 2-2. Number of packages of each waste type in 1BMA at 2075 AD.
Waste Type Number
Concrete-embedded waste in steel moulds 253 Concrete-embedded waste in concrete moulds 629
Concrete-embedded waste in steel drums 488
Cement-solidified waste in steel moulds 369 Cement-solidified waste in concrete moulds 3192 Bitumen-solidified waste in steel moulds 1384 Bitumen-solidified waste in steel drums 5964 SKB (2013: R-13-37) details the radionuclide inventories per package for each waste stream. This data was combined with the data in Table 2-1 and Table 2-2 to calculate the radionuclide inventories for each model waste type (Table 2-3). The inventories in Table 2-3 have been verified by comparing them with the total inventories in Appendix A of TR-14-09. There are small discrepancies in the total
10
inventories of many radionuclides. The only significant difference is for Mo-93, for which the inventory calculated from R-13-37 and the given number of packages is just over half of the inventory given in TR-14-09. For the 1BMA AMBER models, we used the inventories calculated from R-13-37 and so the AMBER models may give lower fluxes for Mo-93 than SKB’s models (by a factor of ~2).
Table 2-3. Initial inventories in 1BMA.
SM_E CM_E SD_E SM_CS CM_CS SM_BS SD_BS
Ag-108m 6.00E+08 9.59E+08 5.27E+05 8.95E+08 9.00E+09 5.57E+09 2.12E+09
C-14-inorg 0.00E+00 0.00E+00 0.00E+00 3.13E+10 4.25E+11 1.42E+12 1.78E+10 C-14-org 0.00E+00 0.00E+00 0.00E+00 8.14E+09 1.12E+11 2.65E+10 4.28E+08 Cl-36 6.68E+06 1.08E+07 5.81E+03 1.33E+07 1.47E+08 4.39E+07 1.04E+08 Cs-135 1.44E+06 1.10E+07 9.17E+04 5.29E+07 6.88E+08 8.67E+07 6.92E+05 I-129 3.53E+05 3.26E+06 2.75E+04 8.48E+06 9.72E+07 3.62E+07 6.53E+05 Mo-93 1.37E+07 6.49E+07 9.61E+03 1.85E+07 4.29E+08 1.76E+08 7.78E+07 Nb-93m 1.02E+09 1.34E+09 6.59E+05 1.18E+09 3.80E+09 9.01E+09 7.89E+08 Ni-59 8.02E+10 1.02E+11 9.71E+06 1.84E+11 1.58E+12 9.85E+10 4.06E+10 Pu-240 5.93E+07 9.01E+07 4.63E+07 3.01E+08 3.01E+09 3.22E+08 3.75E+07 Ra-228 0.00E+00 0.00E+00 0.00E+00 0.00E+00 0.00E+00 0.00E+00 0.00E+00 Se-79 4.84E+05 3.50E+06 3.67E+04 1.11E+07 1.26E+08 5.54E+07 1.07E+07 Tc-99 8.70E+07 3.60E+08 9.47E+05 3.55E+08 4.11E+09 1.12E+09 1.63E+08 Th-228 0.00E+00 0.00E+00 0.00E+00 0.00E+00 0.00E+00 0.00E+00 0.00E+00 Th-232 0.00E+00 0.00E+00 0.00E+00 0.00E+00 0.00E+00 0.00E+00 0.00E+00 U-236 2.97E+04 4.57E+04 2.76E+04 1.56E+05 1.69E+06 1.66E+05 4.48E+05 Zr-93 0.00E+00 1.80E+07 9.71E+03 1.66E+07 1.73E+08 1.02E+08 4.09E+07
2.1.3
Material Properties
The material properties of the concrete walls, Macadam backfill and grout are the same as those used in the 2BMA model (Towler and Penfold, 2017a).
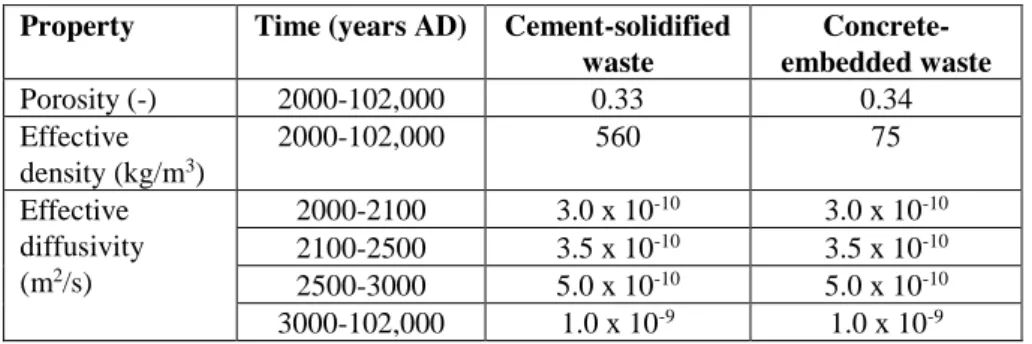
There has been further clarification from SKB regarding the properties of the concrete-embedded and cement-solidified waste types (SKB docID 1601415). These waste types are given a fractional cement content of 1 and ‘effective’ densities that reflect their cement content. They use the Kd values of cement. These properties are
summarised in Table 2-4.
Table 2-4. Properties of cement-based waste forms in 1BMA.
Property Time (years AD) Cement-solidified
waste embedded waste
Concrete-Porosity (-) 2000-102,000 0.33 0.34 Effective density (kg/m3) 2000-102,000 560 75 Effective diffusivity (m2/s) 2000-2100 3.0 x 10⁻¹⁰ 3.0 x 10⁻¹⁰ 2100-2500 3.5 x 10⁻¹⁰ 3.5 x 10⁻¹⁰ 2500-3000 5.0 x 10⁻¹⁰ 5.0 x 10⁻¹⁰ 3000-102,000 1.0 x 10⁻⁹ 1.0 x 10⁻⁹
11
There were no bitumen-solidified wastes in 2BMA, so material properties for bitumen have been found for 1BMA. SKB (docID 1601415) assumed that there is no retardation in the bitumen-solidified wastes, so they are assigned an effective diffusivity of 2 x 10⁻⁹ m2 s-1 and K
d of 0 m3 kg-1, with a density of 1030 kg m-3
(Table 6-1 in TR-14-10). No information is given on the porosity of the bitumen-solidified wastes, so these are assumed to have a porosity of 1, to be consistent with the effective diffusivity, which is for free water.
Kd reduction factors have been used to account for the presence of organic
complexants, taken from Table 7-11a in TR-14-10.
2.2
Global Warming Calculation Case
(CCM_GW)
2.2.1
Model Implementation
A near-field single concrete compartment model of the 1BMA vault was
implemented in AMBER. The approach mirrors that used by Towler and Penfold (2017a) to build a simplified single caisson model for the 2BMA vault.
The waste is discretised using the same approach as the ECOLEGO model, as clarified in SKB’s presentation to SSM on 28 October 2016 (Åstrand, 2016). The concrete-embedded and cement-solidified wastes are represented with two compartments each; an ‘inner’ and ‘outer’ compartment (see Figure 2-2). Where wastes are disposed in concrete moulds, the moulds are represented using a single compartment. Bitumen-solidified wastes are also represented with a single compartment.
Figure 2-2. Compartment configuration to represent that waste types in the 1BMA single concrete compartment model. (Waste and mould compartments are coloured. Transfers between
12
There has been further clarification from SKB on the compartment lengths and areas used in the model to calculate diffusion. These have been taken from Tables 9, 10 and 12 in docID 1601415 and used in the AMBER model.
The grout inside the concrete structure, that surrounds the waste packages, is represented by a single compartment. The six concrete walls are then represented individually. Each wall is represented by five compartments (Figure 2-3). So, there is a total of 30 concrete wall compartments in the AMBER model.
SKB have modelled flows through the 1BMA vault in 6 directions; North, South, East, West, up and down. The flows were taken from spreadsheets provided by SSM (2018), and the average (arithmetic mean) flow through caissons 1-13 in each direction was calculated to provide a representative flow through the single concrete compartment model2. The timings of cement degradation and shoreline displacement
for the global warming calculation case (CCM_GW) are as given in Towler and Penfold (2017a). Flows were linearly interpolated between shoreline positions but there are step-changes in flows at different cement degradation stages.
The geosphere is not explicitly modelled since the output of interest is the radionuclide flux from the near-field to the geosphere.
Figure 2-3. SKB’s discretisation of a single concrete compartment in the 1BMA vault (Åstrand, 2016).
2.2.2
Fracture Model
The concrete fracture model described in Appendix D of TR-14-09 was originally omitted from SKB’s models. This was subsequently corrected following
clarifications (SKB, 2017). For comparison, the global warming calculation case (CCM_GW) has been implemented in AMBER both with and without the fracture model.
Once the concrete walls have become severely or completely degraded, radionuclide transport through them is calculated using the fracture flow model. In the Global Warming calculation case, this occurs at 22,000 AD. As interpreted from Appendix
2 Compartments 14 and 15 are smaller than the rest of the compartments so were
13
D in TR-14-09, in the fracture flow model there is assumed to be no sorption of radionuclides onto the concrete. SKB docID 1601415 suggests that in the fracture model, 10% of the flow is assumed to pass through the bulk concrete so that some sorption continues after 22,000 AD. However, it is unclear how this flow division has been implemented. Therefore, to be consistent with previous 2BMA modelling and the description in TR-14-09, sorption on concrete is entirely switched off in the AMBER model once the concrete is severely / completely degraded.
As discussed in Section 4.1 of Towler and Penfold (2017b), it is unclear whether the fracture model also applies to the concrete moulds. In the AMBER 2BMA model, the radionuclide fluxes from the near-field were not significantly affected by fracturing of the concrete moulds. Therefore, in the 1BMA model, we have taken the same approach as Towler and Penfold(2017a), and the concrete moulds are assumed to fracture at the same time as the concrete walls.
2.2.3
Results
Selected radionuclide fluxes from the near-field to the geosphere calculated by AMBER for the CCM_GW with the concrete fracture model are compared with the corrected results from SKB (2017) in Figure 2-4. The AMBER results from the CCM_GW with and without the concrete fracture model are compared in Figure 2-5.
The radionuclide fluxes calculated by AMBER for radionuclides that are not sorbed, or are only weakly sorbed, (e.g. C-14_org, Ag-108m) are initially slightly higher than the ECOLEGO fluxes. For some radionuclides, e.g. Cs-135, the fraction of the inventory calculated to be released from the near-field before 22,000 AD is larger for AMBER than ECOLEGO. So, post-22,000 AD, the AMBER fluxes decrease significantly more rapidly than the ECOLEGO fluxes.
The peak fluxes are generally higher in AMBER than in the ECOLEGO results, with the exception of Se-79 and Mo-93 (not shown in Figure 2-4). This difference is most significant for Ni-59.
In both the AMBER and ECOLEGO models, there are step changes in the fluxes at 7000 AD and 22,000 AD. These are due to changes in flows through the vault at both times, and degradation, including fracturing, of concrete at 22,000 AD.
The higher fluxes calculated by AMBER may be a consequence of only representing a single concrete compartment in AMBER. Post-3000 y, the dominant flow
direction in the waste is along the long axis of the vault, from one compartment into the adjacent compartment. Therefore, in the ECOLEGO model radionuclides can be retarded through sorption onto cementitious materials in the downgradient
compartments. This this process is not represented in the AMBER model as it only considers a single compartment.
This effect is not seen in the AMBER model of a single 2BMA caisson, because the caissons in 2BMA are not connected. The caissons are separated by Macadam backfill. Therefore, radionuclides transported out of a caisson will tend to be transported in the backfill rather than into a downgradient caisson.
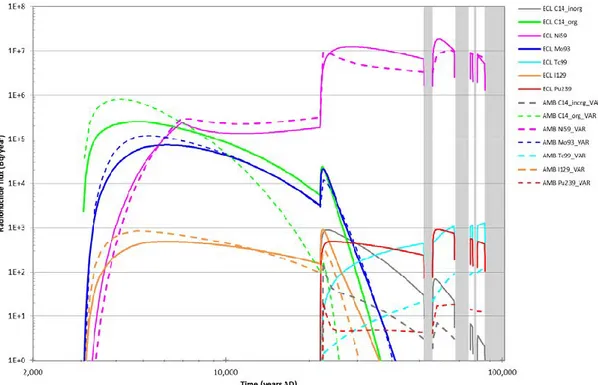
14
Figure 2-4. Comparison of radionuclide fluxes from the 1BMA vault to the geosphere calculated by AMBER (AMB) for the CCM_GW, compared with the corrected ECOLEGO (ECL) results. Figure 2-5 shows that for most radionuclides, the fracture model does not make significant difference to the flux from the near-field. The exception is C-14_inorg which has a peak flux almost 70 times higher when the fracture model is included. This is because C-14_inorg has the highest Kd value for cement and therefore
experiences the most sorption in intact concrete. Sorption of C-14_inorg is not reduced by organic complexation. When sorption is switched off in the concrete fracture model, this has a significant impact on the C-14_inorg fluxes. Other radionuclides which are usually highly-sorbing (e.g. Pu, Tc) have high sorption reduction factors in the presence of organic complexants, so they experience less sorption and are less affected by the concrete fracture model.
This is unlike the findings from the 2BMA model in which the fracture model made a significant difference to the radionuclide fluxes.
15
Figure 2-5. Comparison of radionuclide fluxes from the 1BMA vault to the geosphere calculated by AMBER for the CCM_GW without the fracture model (NF) and with the fracture model (FM).
2.2.4
Conclusions
There is a reasonable agreement between the radionuclide fluxes from the near-field for 1BMA calculated by AMBER and ECOLEGO. The fit is good for radionuclides that are not sorbed, or are only weakly sorbed, but becomes worse as sorption increases. The AMBER model generally gives higher peak fluxes, but this may be an artefact of only representing a single concrete compartment.
With the exception of C-14_inorg, the fracture model has very little effect on the 1BMA near-field radionuclide fluxes. This behaviour is different to 2BMA, in which the fracture model has a much more significant effect on the radionuclide fluxes. This may be because of the use of sorption (Kd) reduction factors in the
1BMA model. This reduces the retardation of the most highly-sorbing radionuclides, so there is less impact when sorption is turned off once the concrete has fractured. As discussed later in Section 3.2, these reduction factors do not appear to be used in the 2BMA model and therefore the impact of the sorption being turned off is greater in the 2BMA model.
16
2.3
Accelerated Concrete Degradation
(CCL_BC)
The Accelerated Concrete Degradation calculation case (CCL_BC) is described in Section 4.2.3 of TR-14-09. The case assumes the vault concrete structure physically degrades much more rapidly than in the CCM_GW. This leads to higher flow rates through the concrete structure, and hence the wastes and grout inside the structure, at earlier times compared with the CCM_GW. However, accelerated chemical degradation is not considered, as the CCM_GW is already considered to cautiously overestimate the rate of chemical degradation.
Table 4-7 in TR-14-09 shows that the CCL_BC assumes the concrete to be severely degraded from 3000 AD to 22,000 AD and completely degraded thereafter. In addition, the walls of the concrete structure are assumed to be fractured throughout the assessment timeframe.
The changes made to the AMBER model for the CCM_GW (with the corrected fracture model) to implement the CCL_BC case were:
flows through the near-field (Table 4-7 in TR-14-09 and spreadsheets provided by SKB (2018));
effective diffusivities (Table 4-8 in TR-14-09); porosities (Table 4-9 in TR-14-09); and
the nature of the concrete - it is assumed to be fractured at all times (Table 4-7 in TR-14-09).
2.3.1
Results
The effects of accelerated concrete degradation are shown by comparing the results from the AMBER models for CCM_GW and CCL_BC in Figure 2-6. Both models include the concrete fracture model.
In the CCL_BC, there are higher flows through the wastes at early times compared with the CCM_GW. This results in higher peak fluxes of radionuclides that are not sorbed, or are only weakly sorbed, e.g. C-14_org and I-129, and more rapid decrease in the fluxes beyond the peak.
In the CCL_BC, concrete is assumed to be fractured from 3000 AD. The fluxes of radionuclides that sorb onto concrete increase to a greater extent, due to the combined effects of increased flow and reduced sorption. So, radionuclides which have the highest Kd values for cement (such as C-14_inorg) are most affected by
accelerated concrete degradation.
Tc-99 is less significantly affected by accelerated concrete degradation than other strongly sorbing radionuclides. This is because Tc-99 sorbs moderately to the Macadam. The Macadam is unaffected by the concrete degradation and therefore, although the Tc-99 reaches the Macadam more quickly in the CCL_BC case, it is retarded in the backfill before being released to the geosphere. This ‘buffers’ the effect of the quicker release from the concrete structure.
17
Figure 2-6. Comparison of radionuclide fluxes from the 1BMA vault to the geosphere calculated by AMBER for the Global Warming calculation case (CCM_GW) and Accelerated Concrete Degradation calculation case (CCL_BC).
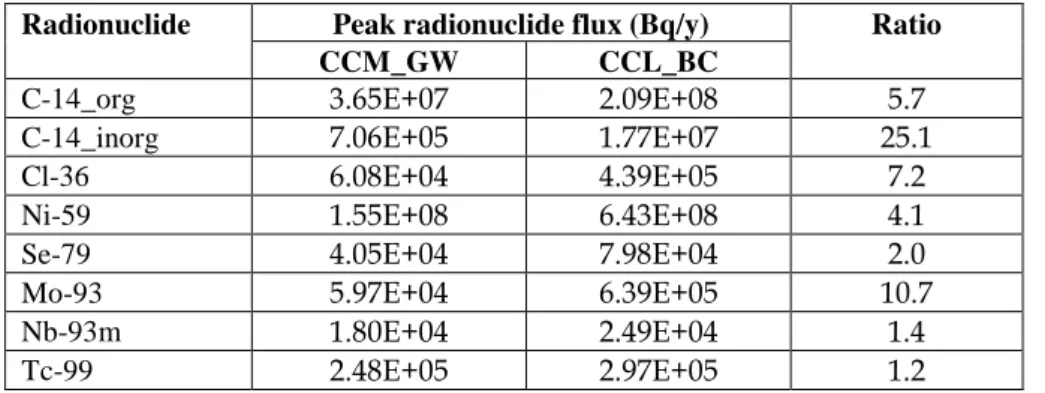
The ratios of the peak near-field fluxes calculated by AMBER for the CCM_GW and CCL_BC are given in Table 2-5. These show that for all radionuclides, the peak flux from the near-field is increased in the accelerated concrete degradation case. The largest increase in peak flux is for Pu-240, followed by C-14_inorg.
Pu-240 is predominantly found in packages with cement moulds. In the accelerated concrete degradation case, in the AMBER model, the cement moulds are also assumed to fracture from 3000 AD. Therefore, the flux of Pu-240 increases significantly as it does not sorb onto the concrete moulds or the concrete vault structure.
C-14_inorg experiences the largest increase in flux during the first 20,000 years. This is consistent with the high sensitivity of the flux of C-14_inorg to fracturing of the concrete, and loss of sorption, shown previously.
Table 2-5. Comparison of peak radionuclide fluxes from the 1BMA vault to the geosphere calculated by AMBER for the Global Warming calculation case (CCM_GW) and Accelerated Concrete Degradation calculation case (CCL_BC).
Radionuclide Peak radionuclide flux (Bq/y) Ratio
CCM_GW CCL_BC
C-14_org 3.65E+07 2.09E+08 5.7
C-14_inorg 7.06E+05 1.77E+07 25.1
Cl-36 6.08E+04 4.39E+05 7.2
Ni-59 1.55E+08 6.43E+08 4.1
Se-79 4.05E+04 7.98E+04 2.0
Mo-93 5.97E+04 6.39E+05 10.7
Nb-93m 1.80E+04 2.49E+04 1.4
18
Ag-108m 7.80E+05 4.73E+06 6.1
I-129 2.74E+04 1.97E+05 7.2
Cs-135 1.44E+05 5.99E+05 4.2
Pu-240 2.38E+04 6.85E+05 28.8
Zr-93 1.77E+04 2.46E+04 1.4
We do not have access to the timeseries 1BMA near-field radionuclide fluxes from SKB’s ECOLEGO model of the CCL_BC. However, peak fluxes are reported in Appendix E of TR-14-09. In Table 2-6, SKB’s peak fluxes are compared against the peak fluxes calculated by AMBER.
The peak fluxes are generally within a factor of four, with Ni-59, Pu-240 and I-129 exhibiting larger differences. It is noted that the AMBER results include the fracture model. The reasonable match to SKB’s ECOLEGO model for C-14_inorg suggests that the fracture model was included in the CCL_BC results presented in Appendix E of TR-14-09.
Table 2-6. Comparison of peak radionuclide fluxes from the 1BMA vault to the geosphere calculated by ECOLEGO and AMBER for the Accelerated Concrete Degradation calculation case (CCL_BC).
Radionuclide Peak radionuclide flux (Bq/y) Ratio (AMB/ECL)
ECOLEGO AMBER1
C-14 org 7.5E+07 2.09E+08 2.8
C-14_inorg 8.0E+06 1.77E+07 2.2
Cl-36 1.1E+05 4.39E+05 4.0
Ni-59 5.4E+07 6.43E+08 11.9
Se-79 1.7E+05 7.98E+04 0.5
Mo-93 4.6E+05 6.39E+05 1.4
Nb-93m 3.6E+04 2.49E+04 0.7
Tc-99 3.4E+05 2.97E+05 0.9
Ag-108m 2.5E+06 4.73E+06 1.9
I-129 4.3E+04 1.97E+05 4.6
Cs-135 1.8E+05 5.99E+05 3.3
Pu-240 7.9E+04 6.85E+05 8.7
Zr-93 1.8E+04 2.46E+04 1.4
1Including the fracture model
2.3.2
Conclusions
The effect of accelerated concrete degradation is to increase the radionuclide fluxes from the near-field at early times. This is because the concrete walls are assumed to be initially fractured and radionuclides therefore experience no sorption onto the concrete. The flows through the concrete structure are also higher. Since the radionuclide inventory is released more quickly, the long-term fluxes decrease more quickly.
The comparison between the CCL_BC results from AMBER and ECOLEGO is limited as we do not have access to the timeseries 1BMA near-field radionuclide fluxes. However, the peak fluxes from the near-field to the geosphere can be compared and the agreement is reasonable for many radionuclides. The peak fluxes
19
calculated by AMBER are generally higher than calculated by ECOLEGO. As for the CCM_GW, this may be a consequence of only including a single concrete compartment in the AMBER model.
It is notable that the fluxes are within a factor of 2.2 for C-14_inorg. The fluxes of this radionuclide are very sensitive to the fracture model, so this result indicates that that fracture model was included in SKB’s CCL_BC results presented in TR-14-09.
2.4
Bitumen-Solidified Waste
In the AMBER and ECOLEGO models described above, the different waste types are assumed to be evenly distributed throughout the 1BMA vault. Within each compartment of the concrete structure, the wastes are embedded in grout. In reality, it is likely that there will be no grout in compartments where bitumen-solidified waste is stored, to allow space for the wastes to swell. To test the impact of this against the previous modelling assumption that bitumen-solidified waste packages are spread throughout the vault, a new AMBER model was built in which the single concrete compartment contained only bitumen-solidified waste packages and no grout. The model is otherwise identical to the previous Global Warming calculation case. The flows through the vault have not been altered. In reality, the flows are likely to increase in the absence of grout, so the radionuclide fluxes reported from this case may be an underestimate.
The radionuclide fluxes from the near-field calculated using this model can be compared with the equivalent fluxes per package of bitumen-solidified waste from a model where bitumen-solidified waste packages are dispersed throughout the 1BMA, as in the reference assumption. In both models, the concrete fracture model is applied and organic complexants are included.
2.4.1
Inventory
As given in Table 2-2, there are a total of 1384 packages of bitumen-solidified waste in steel moulds and 5964 packages of bitumen-solidified waste in steel drums in the 1BMA vault. To estimate the number of packages that could fit in a single concrete compartment if this was only filled with bitumen-solidified waste, the available compartment volume and package volume must be calculated.
The available concrete compartment volume was calculated assuming that 20% of the total compartment volume is left as void space for the waste to swell into. This is equivalent to the volume of grout in the previous 1BMA Global Warming
calculation case. The bitumen-solidified waste packages can therefore occupy 80% of a concrete compartment, or 1063 m3.
It was decided to divide the total number of packages in the compartment between steel moulds and steel drums containing bitumen-solidified wastes according to the ratio of their total numbers of packages. This facilitates comparison of the
radionuclide flux per package with the model in which the bitumen-solidified wastes are distributed throughout the vault.
20
In the AMBER models presented in Sections 2.2 and 2.3, the waste package
volumes have been taken from SKB docID 1601415. This is thought to be consistent with the package volumes used in the ECOLEGO models which the AMBER model results were compared with. According to this reference, the volume of each steel drum and steel mould is 1 m3. Using this package volume, approximately 1062
bitumen-solidified waste packages can fit in one concrete compartment. Using the package ratio described above, this is equivalent to 200 packages of bitumen-solidified waste in steel moulds and 862 packages of bitumen-bitumen-solidified waste in steel drums.
However, SKB have issued a correction regarding the volume of three types of waste package (SKB docID 1585177). Rather than 1 m3, the volume of the steel
drums is 0.238 m3 and the volume of the steel moulds containing cement-solidified
or concrete-embedded waste is 1.7 m3. Here we assume the steel moulds containing
bitumen-solidified waste should also have a volume of 1.7 m3. The steel moulds are
assumed to be cubic and the steel drums are assumed to be cylindrical with the same height as the steel moulds (as in Figure 3-2 of SKB, 2014a). Although these volumes were not used in the previous 1BMA AMBER models for consistency with the ECOLEGO results, it may be useful to consider the impact of using the corrected volumes here in a sensitivity case.
With these corrected package dimensions, the grout content is increased from 20% to 40% per concrete compartment. If we assume that the bitumen-solidified waste in steel drums have a volume of 0.238 m3 per package and the bitumen-solidified waste
in steel moulds have a volume of 1.7 m3 per package, then a total of 292 packages of
bitumen-solidified waste in steel moulds and 1259 packages of bitumen-solidified waste in steel drums can fit in one concrete compartment. This assumes that 60% of the interior volume of the concrete compartment is filled with waste packages and 40% is void space.
In each case, the radionuclide inventory can be calculated using the inventory per package as before.
2.4.2
Results
For the results from the bitumen-only case to be meaningful, it was decided to compare the radionuclide flux per package with the Global Warming calculation case in which bitumen-solidified packages are spread throughout the repository, as in the previous AMBER models. To do this, the existing 1BMA model was modified to ‘track’ radionuclides arising from the bitumen-solidified waste, so that this could be distinguished from radionuclide fluxes arising from the other waste types. This was done by adding new isotopes, such as ‘Ni-59_bitumen’ and ‘Pu-240_bitumen’, to represent the radionuclide inventory arising from the bitumen-solidified waste. The bitumen-bitumen-solidified waste packages contain only ‘_bitumen’ radionuclides and the other waste packages contain only the original radionuclides. These new isotopes otherwise have identical properties to the original radionuclides. Since diffusion is calculated from the relative concentration of each radionuclide in each compartment, it is possible that there will be too much diffusion of the ‘_bitumen’ radionuclides from the grout into the other waste packages, as these packages have a zero concentration of the ‘_bitumen’ radionuclides. Two bounding
21
cases were therefore run; one where the diffusion transfers are not amended (so there is likely to be too much diffusion of bitumen-originating radionuclides into other waste packages), and one where diffusion into other waste packages is turned off (so there is likely to be too little diffusion of bitumen-originating radionuclides into other waste packages).
Original Package Volumes
The radionuclides fluxes from the near-field are compared in Figure 2-7. These are calculated using package volumes of 1 m3 for the steel drums and steel moulds.
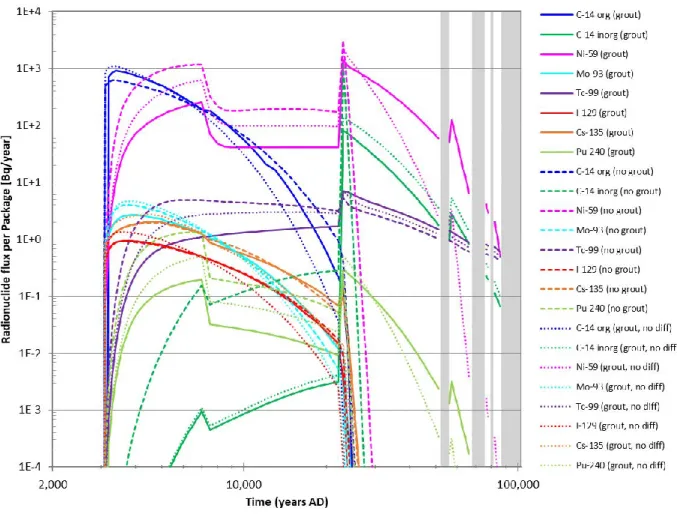
Figure 2-7. Comparison of radionuclide fluxes to the geosphere per package of bitumen-solidified waste calculated by AMBER for three cases: bitumen-solidified waste dispersed through vault with diffusion from grout into other packages (grout); bitumen-solidified waste dispersed through vault with no diffusion from grout into other packages (grout, no diff); and bitumen-solidified waste in one concrete compartment with no grout (no grout).
Turning off diffusion of bitumen-originating radionuclides from the grout to the packages containing non-bituminized waste slightly increases the fluxes from the near-field by a factor of 1 to 1.8. The actual fluxes from the near-field will be somewhere within the range of these two bounding cases. The flux per package for the case where the concrete compartment only contains bituminised wastes and the grout is removed can therefore be compared with this range.
22
For radionuclides with low cementitious Kd values, there is no significant difference
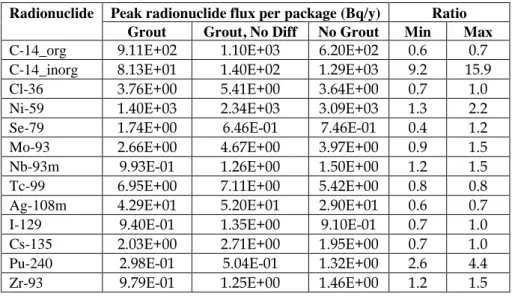
between the cases with and without grout around the bitumen-solidified waste packages. Radionuclides which sorb more strongly to grout (particularly C-14_inorg and Pu-240), experience significantly higher early peak fluxes once the grout is removed. These fluxes then fall faster as the inventory decreases faster. The peak fluxes per package are compared in Table 2-7. The maximum and minimum ratios between the peak flux with grout and without grout around the bitumen are given; this range comes from the sensitivity case regarding diffusion into the other waste packages.
Most of the radionuclide fluxes are not significantly affected by the removal of the grout and the peak flux ratios are close to a factor of 1. The largest difference in peak flux is for C-14_inorg, followed by Pu-240 and Ni-59. As explained previously, this is because C-14_inorg has the highest Kd for grout (once sorption
reduction factors are taken into account), so is therefore most affected by the removal of the grout.
Some radionuclides (C-14_org, Tc-99 and Ag-108m) experience slightly lower peak fluxes in the case where there is no grout around the bitumen-solidified waste packages. In the case of Tc-99, removal of the grout reduces the retardation of Tc-99 so it has an initially higher flux from the near-field. The peak flux occurs when the concrete fractures. This peak is lower in the model with no grout since more of the initial inventory has already been released at the time when fracturing occurs. C-14_org and Ag-108m do not sorb to grout. The reduced fluxes of these two radionuclides occurs because the volume of water around the waste has increased (the void space has a porosity of 1 compared to the grout porosity of 0.3-0.5) but the volumetric flow rate through the vault has not changed, so the advective transfer rate has decreased. This affects all the radionuclides, but for those that sorb to cement, the effect of the removal of the grout outweighs the effect of the increased pore volume.
Table 2-7. Comparison of peak radionuclide fluxes to the geosphere per package of bitumen-solidified waste calculated by AMBER for the case where bitumen-bitumen-solidified waste packages are surrounded by grout, with or without diffusion into other waste packages (Grout & Grout, No Diff), or surrounded by void space (No Grout). The Min Ratio is No Grout ÷ Grout. The Max Ratio is No Grout ÷ Grout, No Diff (except for Se-79, where Min and Max are reversed).
Radionuclide Peak radionuclide flux per package (Bq/y) Ratio Grout Grout, No Diff No Grout Min Max
C-14_org 9.11E+02 1.10E+03 6.20E+02 0.6 0.7
C-14_inorg 8.13E+01 1.40E+02 1.29E+03 9.2 15.9
Cl-36 3.76E+00 5.41E+00 3.64E+00 0.7 1.0
Ni-59 1.40E+03 2.34E+03 3.09E+03 1.3 2.2
Se-79 1.74E+00 6.46E-01 7.46E-01 0.4 1.2
Mo-93 2.66E+00 4.67E+00 3.97E+00 0.9 1.5
Nb-93m 9.93E-01 1.26E+00 1.50E+00 1.2 1.5
Tc-99 6.95E+00 7.11E+00 5.42E+00 0.8 0.8
Ag-108m 4.29E+01 5.20E+01 2.90E+01 0.6 0.7
I-129 9.40E-01 1.35E+00 9.10E-01 0.7 1.0
Cs-135 2.03E+00 2.71E+00 1.95E+00 0.7 1.0
Pu-240 2.98E-01 5.04E-01 1.32E+00 2.6 4.4
23
Corrected Package Volumes
The three cases were then re-run using the corrected steel drum and steel mould volumes of 0.238 m3 and 1.7 m3 respectively. This had a small effect on the
radionuclide fluxes to the geosphere.
For the case where the bitumen-solidified waste is not surrounded by grout, the peak radionuclide fluxes per package were little changed when the package volumes were updated. This is because the only difference between the two cases is the relative amount of bitumen and void space. Both have the same assumed transport properties in the AMBER model (i.e. no credit is taken for sorption onto the bitumen-solidified waste, and both are given the diffusivity of water), so the radionuclide fluxes are unaffected.
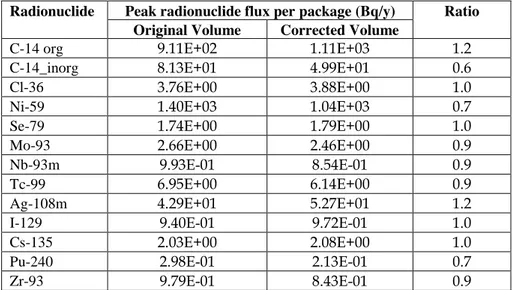
For the cases where the bitumen-solidified waste is dispersed throughout the vault, the peak radionuclide fluxes are within a factor of 2 when comparing the original and corrected waste package volumes (see Table 2-8). The ratios are similar regardless of whether diffusion into the waste packages is allowed. High-sorbing radionuclides (C-14_inorg, Pu-240 and Ni-59) experience slightly lower peak fluxes when the package volumes are updated. This is because the overall volume of waste decreases and hence the volume of grout increases, onto which these radionuclides will sorb. Non-sorbing radionuclides (C-14_org and Ag-108m) have slightly higher peak fluxes when the package volumes are updated.
Table 2-8. Comparison of peak radionuclide fluxes to the geosphere per package of bitumen-solidified waste calculated by AMBER for the case where bitumen-bitumen-solidified waste packages are surrounded by grout, using the original or corrected package volumes. Diffusion of bitumen-originating radionuclides into the other waste packages is permitted.
Radionuclide Peak radionuclide flux per package (Bq/y) Ratio Original Volume Corrected Volume
C-14 org 9.11E+02 1.11E+03 1.2
C-14_inorg 8.13E+01 4.99E+01 0.6
Cl-36 3.76E+00 3.88E+00 1.0
Ni-59 1.40E+03 1.04E+03 0.7
Se-79 1.74E+00 1.79E+00 1.0
Mo-93 2.66E+00 2.46E+00 0.9
Nb-93m 9.93E-01 8.54E-01 0.9
Tc-99 6.95E+00 6.14E+00 0.9
Ag-108m 4.29E+01 5.27E+01 1.2
I-129 9.40E-01 9.72E-01 1.0
Cs-135 2.03E+00 2.08E+00 1.0
Pu-240 2.98E-01 2.13E-01 0.7
Zr-93 9.79E-01 8.43E-01 0.9
The radionuclide fluxes to the near-field for the three cases using the corrected package volumes are compared in Figure 2-8. The relative peak fluxes are similar to the cases using the original package volumes; C-14_inorg, Pu_240 and Ni-59 experience the largest increases in flux when the grout is removed from around the bitumen-solidified waste packages, whereas most other radionuclides experience a slight decrease.
24
Figure 2-8. Comparison of radionuclide fluxes to the geosphere per package of bitumen-solidified waste calculated by AMBER for three cases: bitumen-solidified waste dispersed through vault with diffusion from grout into other packages (grout); bitumen-solidified waste dispersed through vault with no diffusion from grout into other packages (grout, no diff); and bitumen-solidified waste in one concrete compartment with no grout (no grout).
2.4.3
Conclusions
The effect of removing the grout around the bitumen-solidified waste packages is most significant for radionuclides which sorb strongly to grout (particularly C-14_inorg and Pu-240). These radionuclides are released more quickly from the near-field and the peak radionuclide flux per package to the geosphere is increased up to a factor of 15.9 for C-14_inorg. This effect is likely to be underestimated since the total flow through the vault has not been updated to account for the removal of the grout.
Sensitivity to waste package volume has also been tested. This has little effect on the flux per package from the compartment with no grout, since the bitumen-solidified waste and surrounding void space have the same transport properties. There is some effect on the reference model due to the overall decrease in package volume and respective increase in grout, but radionuclide fluxes to the near-field remain within a factor of 2. It is unclear whether the corrected volume of steel moulds applies to the bitumen-solidified waste or only the concrete-embedded waste; in the sensitivity to waste package volume case, it has been assumed to apply to both waste types.
25
3
Updated Single-Caisson Model of
2BMA Vault with New Design
3.1
Single-Caisson Model of 2BMA for the
Global Warming Calculation Case
(CCM_GW)
3.1.1
Description
The basis for this model is the single-caisson model developed during the main review phase for the global warming calculation case (Towler and Penfold, 2017a). Two further updates have subsequently been made to the model based on further information from SKB:
Updated representation of the waste packages, in which the Tetramoulds were added to AMBER as a new package type.
Updated waste properties.
The updated representation of the waste packages was described and tested in Section 4.5 of Towler and Penfold (2017b). The updated waste properties are taken from new information supplied in SKB docID 1601415 regarding the material properties of the cement-based waste forms, as used in the 1BMA AMBER model (see Section 2.1.3).
All of the 2BMA single-caisson models described in this report include the concrete fracture model.
3.1.2
Results
The radionuclide fluxes from the near-field for each AMBER model are compared against the ECOLEGO results in Figure 3-1 to Figure 3-4.
Comparing Figure 3-1 and Figure 3-2 shows that the single-caisson model gives very similar results to the full model. Updating the representation of the waste types makes little difference to the results (Figure 3-3).
26
Figure 3-1. Comparison of radionuclide fluxes from the 2BMA vault to the geosphere calculated by the full 2BMA AMBER model (Towler and Penfold, 2017a) for the Global Warming calculation case (CCM_GW), compared against the corrected ECOLEGO model.
Figure 3-2. Comparison of radionuclide fluxes from the 2BMA vault to the geosphere calculated by the AMBER single-caisson model (Towler and Penfold, 2017a) for the Global Warming calculation case (CCM_GW), compared against the corrected ECOLEGO model.
27
Figure 3-3. Comparison of radionuclide fluxes from the 2BMA vault to the geosphere calculated by the AMBER single-caisson model with updated representation of the waste types (Towler and Penfold, 2017b) for the Global Warming calculation case (CCM_GW), compared against the corrected ECOLEGO model.
Figure 3-4. Comparison of radionuclide fluxes from the 2BMA vault to the geosphere calculated by the AMBER single-caisson model with updated representation of the waste types and waste properties for the Global Warming calculation case (CCM_GW), compared against the corrected ECOLEGO model.
28
Updating the waste properties has a bigger effect on the results (Figure 3-4). The fluxes have generally increased. The fluxes are now a worst match against ECOLEGO before 22,0000 AD but a better match against ECOLEGO after this time. Highly-sorbing radionuclides with peak fluxes after 22,000 AD are therefore a better match against ECOLEGO (such as C-14_inorg and Pu-239) whilst other radionuclides are a worse match (such as Ni-59).
3.1.3
Conclusions
The updated representation of the waste types in the AMBER single-caisson model matches the configuration of ECOLEGO. The correction to the representation of the waste packages may be important for the new design, as the new design alters flows through the caisson and hence the packages. The updated waste properties match those described by SKB (docID 1601415) and improve the match between
ECOLEGO and AMBER for highly-sorbing radionuclides, although the comparison for non-sorbing and weakly-sorbing radionuclides is similar or worse.
It was decided to use the 2BMA single-caisson model with both updates as the base model for the rest of the 2BMA calculation cases, to be consistent with the waste representation and properties used in the 1BMA model, and with SKB’s ECOLEGO model.
3.2
Organic Complexants Sensitivity
Analysis
3.2.1
Description
As noted in Section 2.1.3, the 1BMA model in AMBER uses sorption (Kd) reduction
factors to account for the presence of organic complexants. This reduces the sorption of some key radionuclides (e.g. Pu, Tc, Zr) by up to a factor of 100. The Kd
reduction factors were not used in the previous 2BMA AMBER models described in Section 3.1.1 and Towler and Penfold (2017a,b).
It is not clear from the documentation whether SKB have applied these Kd reduction
factors in the CCM_GW calculation case for 1BMA and/or 2BMA, or only in an alternative ‘high concentration of complexing agents’ calculation case. In TR-14-09 Section 4.1.1 (Global warming calculation case CCM_GW), it is stated, “Due to the presence of complexing agents, the Kd values were reduced with sorption reduction factors for the radionuclides affected”. However, in TR-14-10 Section 7.11 (Data recommended for use in SR-PSU modelling), it is stated, “The recommended sorption reduction factors given in Table 7-11a to Table 7-11c. These factors together with the concentrations of complexing agents anticipated in SFR (Keith Roach et al., 2014) are recommended to be used in the high concentration of complexing agents scenario”.
A sensitivity analysis has therefore been carried out to investigate the impact of including organic complexants in the 2BMA model. The Kd reduction factors given
29
in Table 7-11a in TR-14-10 were added to the AMBER 2BMA single caisson model.
3.2.2
Results
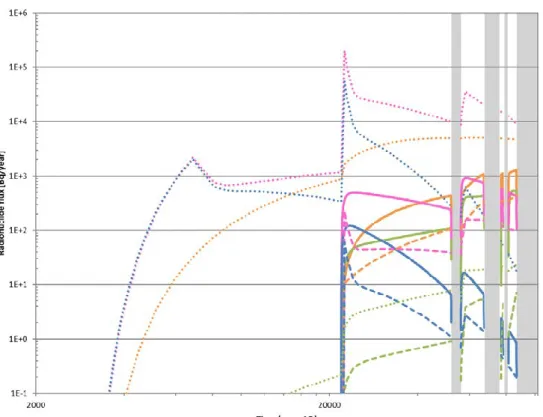
The radionuclide fluxes from the near-field are compared in Figure 3-5 for the AMBER models with and without organic complexants, and the ECOLEGO 2BMA model. Only radionuclides with Kd reduction factors > 1 are shown; for the
remaining radionuclides, the two AMBER models give identical results.
Figure 3-5. Comparison of radionuclide fluxes from the 2BMA vault into the geosphere calculated by the AMBER (AMB) models without and with Kd reduction factors (red), and the ECOLEGO model (ECL).
The radionuclides shown in Figure 3-5 are all highly sorbing. For the AMBER model without organic complexants, the radionuclide fluxes from the near-field are lower than those calculated by the ECOLEGO model by an approximate factor of 10. Introducing Kd reduction factors to the AMBER model to account for the presence of organic complexants causes the near-field fluxes to increase by
approximately 2-3 orders of magnitude for the radionuclides shown. This is because the transfer rates are inversely proportional to retardation, so reducing the sorption increases the transfer rates from the waste and also increases the amounts of contaminants in compartments outside the waste. These effects are multiplicative so the transfer flux from the near-field increases by more than the decrease in sorption. The near-field fluxes in the case with sorption reduction factors are around two orders of magnitude higher than the EGOLEGO results (with the exception of Ra-226, which is an order of magnitude lower than the ECOLEGO results).
30
3.2.3
Conclusions
The radionuclide fluxes from the near-field in the existing 2BMA AMBER model are lower than the ECOLEGO results for highly-sorbing radionuclides. However, applying Kd reduction factors to the AMBER model to account for the presence of
complexants increases the fluxes disproportionately, leading to a worse fit with the ECOLEGO results. This suggests that SKB have not used the Kd reduction factors in
their CCM_GW case for 2BMA. Therefore, Kd reduction factors have not been
included in the AMBER model for the updated 2BMA design.
As shown previously, it appears that the Kd reduction factors have been used in the
1BMA model. The SR-PSU documentation does not clearly explain where Kd
reduction factors have been used in SKB’s models, where they have not been used, and why. We note Section 4.1 in Keith-Roach et al. (2014: R-14-03) states, “SKB will limit disposals of cellulose in future waste packages (SKB 2014b) to minimise the potential impact of ISA in 2BMA.” This may explain why organic complexation, and consequent sorption reduction, has been considered in the CCM_GW for 1BMA but not 2BMA.
3.3
Updated 2BMA Design
3.3.1
Description of the Updated Design
The conceptual design of 2BMA has been updated in response to assessment of the mechanical loads that may be applied to the vault throughout its lifetime. There are three main differences between the updated 2BMA design and the design which was previously implemented in AMBER (as described in Section 3.1.1 and Towler and Penfold 2017a pp.6-29):
Inner walls have been introduced. There is now no need to backfill the space between the waste packages and the walls with grout; instead, this space is left empty to allow space for the waste to swell.
The dimensions of the outer concrete walls, cap and floor have been adjusted to handle expected loads (i.e. their thickness has been increased).
Gas relief ducts/channels have been introduced along the concrete walls, filled with a more permeable medium to allow gas to escape.
In SKB’s updated ECOLEGO model, they conservatively ignored the new inner walls and changes to the dimensions of the vault and instead only investigated the effect of introducing the gas relief channels / ducts. The updated AMBER model therefore takes the same approach.
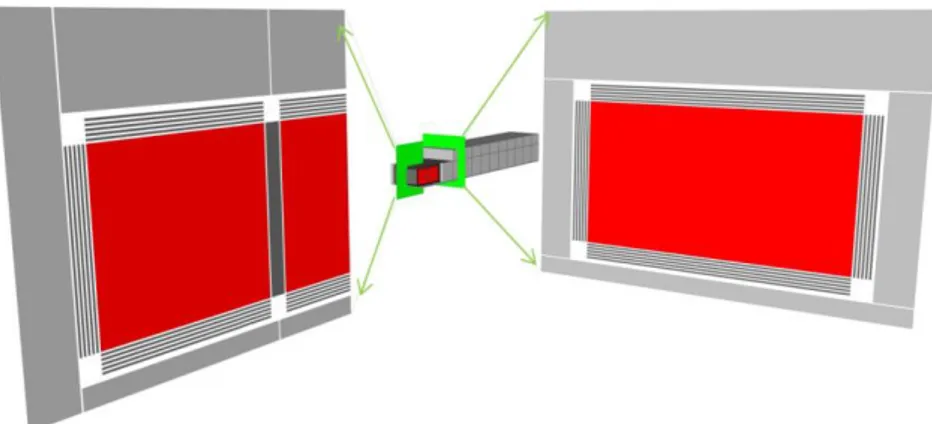
The gas relief channels are aligned along one concrete wall; either perpendicular to or parallel to the vault (Figure 3-6). Advection and diffusion are modelled through the gas relief channels.
31
Figure 3-6. Close-up of the geometry of the gas relief channels from SKB’s contaminant hydrology model (reproduced from SKB docID 1569813). In one case, the series of gas relief channels has been placed parallel to the length of the vault (left) and in another case perpendicular to the length of the vault (right).
The channels are assumed to be filled with porous mortar, although a variant case has been tested in which the channels are filled with sand and have an even higher porosity and permeability. There are therefore four variant cases to be tested (shown in Table 3-1).
Table 3-1. Summary of calculation cases for updated 2BMA design. ‘Channel orientation’ refers to orientation of gas channels relative to the long axis of the vault.
Calculation Case Channel Material Channel Orientation
B1 Mortar Parallel
B2 Mortar Perpendicular
S1 Sand Parallel
S2 Sand Perpendicular
The material properties of the mortar and sand are given in SKB docID 1569813. The mortar is assumed to have the material properties of grout (including sorption). Sorption is neglected for the gas discharge channels filled with sand.
In the case of gas relief channels filled with mortar (cases B1 and B2), there is no significant change in flows compared with the previous design. In the case of gas relief channels filled with sand (cases S1 and S2), there is an increase in flow through the caissons for the first 20,000 years. These flows are given in Table 4-6 of SKB docID 1569813.
It is unclear how the flows through the waste have been divided between the gas relief channels and the concrete walls. We have assumed that, for the mortar-filled gas channels, flow through the concrete walls dominates, but for cases S1 and S2, flow is all through the highly permeable sand-filled gas channels. An alternative possibility is that only the ‘additional’ flow in cases S1 and S2 is transported through the gas channels (with the remainder flowing through the concrete walls). However, this does not seem to be consistent with SKB’s results which show a significant difference in radionuclide fluxes between the sand and mortar cases. The difference cannot be entirely accounted for if only a small proportion of the flow travels through the gas relief channels. After the concrete walls fracture, flow is assumed to travel predominantly through the fractured walls.
32
3.3.2
Results
The AMBER model results show that the new design increases radionuclide fluxes from the near-field to the geosphere. The magnitude of the increase is small for radionuclides that do not sorb onto cement, but larger for radionuclides that sorb strongly onto cement. The main cause of the increased fluxes is removal of the grout fill around the waste packages, inside the caisson. So, there is no grout for
radionuclides to sorb onto.
The radionuclide fluxes from the near-field for the four calculation cases are compared with the ECOLEGO results in Figure 3-7 to Figure 3-10. The comparative behaviour of the four cases is similar in AMBER and ECOLEGO, but the fluxes calculated by AMBER are greater than calculated by ECOLEGO.
In both the ECOLEGO and AMBER results, the fluxes from cases B1 and B2 are identical. This is because gas-relief channels filled with mortar are assumed not to affect the flows, and the orientation of the channels therefore makes no difference to radionuclide release.
The radionuclide fluxes are higher in the sand-filled cases (S1 and S2) than the mortar-filled cases. This is due to the increased flows and reduced sorption. Beyond 22,000 AD, the fluxes from the near-field are identical in all four cases (for both the AMBER and ECOLEGO models). The flows in all cases are the same, and this result suggests that the radionuclides are predominantly travelling through the fractured concrete walls (hence there is no difference between mortar and sand filled channels, which have different sorption and material properties).
33
Figure 3-7. Comparison of radionuclide fluxes from the 2BMA vault into the geosphere calculated by the AMBER (AMB) and ECOLEGO model (ECL) for case B1 (gas channels filled with mortar, parallel to the vault).
Figure 3-8. Comparison of radionuclide fluxes from the 2BMA vault into the geosphere calculated by the AMBER (AMB) and ECOLEGO model (ECL) for case B2 (gas channels filled with mortar, perpendicular to the vault).
34
Figure 3-9. Comparison of radionuclide fluxes from the 2BMA vault into the geosphere calculated by the AMBER (AMB) and ECOLEGO model (ECL) for case S1 (gas channels filled with sand, parallel to the vault).
Figure 3-10. Comparison of radionuclide fluxes from the 2BMA vault into the geosphere calculated by the AMBER (AMB) and ECOLEGO model (ECL) for case S2 (gas channels filled with sand, perpendicular to the vault).
35
There are higher radionuclide fluxes in S2 than S1, because flows through the waste are higher in S2 than S1. In the ECOLEGO results, this effect is noticeable for the Ni-59 and Pu-239 fluxes (highlighted in Figure 3-11), but the difference is very small in the AMBER results and is not visible in Figure 3-11.
Figure 3-11. Comparison of Pu-239 fluxes from the 2BMA vault into the geosphere calculated by the AMBER (AMB) and ECOLEGO model (ECL) for the variant cases.
3.3.3
Conclusions
SKB’s assessment shows that the new design for 2BMA has little impact on the radionuclide fluxes from the near-field to the geosphere. Therefore, the calculated doses are little changed compared with SR-PSU. We found that the new design results in increased radionuclide fluxes from the near-field to the geosphere. The magnitude of the increase is small for radionuclides that do not sorb onto cement, but larger for radionuclides that sorb strongly onto cement. The main cause of the increased fluxes is removal of the grout fill around the waste packages, inside the caisson. So, there is no grout for radionuclides to sorb onto. It is not clear whether the grout has been removed from SKB’s models of the new 2BMA design. The AMBER and ECOLEGO models show the same relative behaviour between the four variant updated designs of the 2BMA repository. The cases with sand-filled gas channels exhibit higher radionuclide fluxes, particularly when the channels are aligned along the wall perpendicular to the long axis (length) of the vault. This is because the highest flows through the repository are along the length of the vault, so the highest flows will intersect all the channels along this perpendicular wall. Uncertainty about how SKB have divided flows between the gas relief channels and the concrete walls may also contribute to differences between the AMBER and ECOLEGO models.
36
Only the effect of the gas relief channels and the removed grout has been examined for the updated 2BMA design. There has been no consideration of the impact of the additional inner walls or the adjusted dimensions of the vault. This is for consistency with SKB’s approach, as described in Section 4.2 of document 1569813.