Bioremediation of clayey soil contaminated with
crude oil: comparison of dynamic and static
biopiles in lab-scale
Jorge Antonio Lopes
1; Graciane Silva
2;
Marcia Marques
3,4; Sérgio Machado Correa
3 1Petrobras Transportes - Transpetro S.A., Brazil
2
Estre Ambiental, Brazil
3Rio de Janeiro State University-UERJ, Brazil
Linnaeus University-LNU, Sweden
ABSTRACTBioremediation of aged and newly clayey soil contaminated with crude oil was investigated in lab-scale using two different strategies (biostimulation-BIOS and bioaugmentation-BIOA), also simulating two different technological options: dynamic biopile (M) and static biopile with forced aeration (B). The inoculum used for bioaugmentation was obtained from the aged contaminated soil. The treatments were performed in triplicates and included one control (original contaminated soil-CONT). The treatments were monitored with soil sampling obtained after 0, 24, 59 and 121 days when the populations of total heterotrophic microorganism (THM), total fungi (TF), and oil-degrading microorganism (ODM) as well as the extracted total petroleum hydrocarbons (TPH) and the 16 polycyclic aromatic hydrocarbons (PAH) prioritized by U.S. EPA were analyzed by gas chromatography. It was observed a trend for reduction of the microbial population density from 0 to 121 days. As expected, the population densities of THM and ODM were much higher in bio-augmented soils in both technologies (BIOA-m and BIOA-b) at day 0. However, after 121 days, the superiority in THM density was observed only in the bioreactor simulating static biopile with forced aeration (BIOA-b). Regarding treatment efficiency, the static biopile with forced aeration performed better in the removal of TPH when associated with bioaugmentation (BIOA-b), being equivalent to the microcosms (simulating dynamic biopile) for the other treatments (CONT and BIOS). For PAH, the superiority of the bioreactor was less conspicuous but observed in both bioremediation strategies (biostimulation BIOS-b and bioaugmentation BIOA-b). The results suggested that regarding TPH, the strategy of bioaugmentation was superior to biostimulation and that the bioreactor (simulating static biopile with forced aeration) reached better contaminant reductions than the microcosm (simulating dynamic biopile). Clayey soil contaminated with crude oil poses big challenges for the bioremediation, due to the texture of the soil favouring adsorption of organic contaminants and due to the complex crude oil composition. The bioprocesses are slow, cleavage of larger molecules are likely to generate smaller hydrocarbons and therefore the elimination of the toxicity is very slow, which may require longer periods and auxiliary tools, such as surfactants. Keywords: clayey contaminated soil; bioremediation; bioaugmentation; biostimulation; dynamic biopile; static biopile with forced aeration.
1 INTRODUCTION
The term “biopile” defines a biological treatment system in which, the contaminated soil is excavated and placed in large heaps to allow the biodegradation of the contaminants (Benyahia, et al. 2005). There are two basic types of biopiles for bioremediation of contaminated soils: static and dynamic. The main difference relates to the aeration system. In static biopile, aeration is forced through a net of perforated pipes installed on the bottom, connected to a blower, vacuum pump or an exhaust-driven wind (Jorgensen al., 2000; Li et al, 2004; Kriipsalu, et al. 2009). In dynamic biopile, aeration is achieved through periodic soil tillage, similar to the procedure applied to the composting windrows (Lopes, et al., 2011). An important restriction on the use of dynamic biopile is associated with the demand for large space. To use this type of biopile one needs to move machinery and equipment more intensively (Lopes et al., 2011). The main restriction regarding static biopiles is uneven spatial distribution of heat, moisture and therefore the ideal conditions for microbial activity within the soil mass does not occur evenly, creating hotspots where contamination persists (Kriipsalu et al. 2009). Indeed, the forced ventilation enhances losses of water and heat inside the biopiles (Kodres, 1998, Li et al. 2004; Kriipsalu al. 2009). The fact that in dynamics biopiles aeration is done by mechanical tilling the material is in a great advantage, since this procedure provides the redistribution of the concentration of target compounds, temperature and moisture, the critical process parameters for bioremediation. According to Shukla et al. (2010), the most important parameters to promote bioremediation are the chemical nature of the pollutants; soil structure; pH; moisture and hydrogeology; C:N:P rate, microbial diversity of the site; temperature and oxidation-reduction (redox potential).
The main objective of this study was to compare the efficiency in treating clayey soil contaminated by petroleum hydrocarbons with dynamic versus static biopile. For both techniques, two separate bench scale systems were constructed: (i) microcosms (dynamic biopiles) where aeration was carried out mechanically and; (ii) a forced up flow aerated bioreactor (static biopile).
2 MATERIAL AND METHODS
Soil: The soil used for this study was excavated from a former storage facility with registration of long-term leaking from tanks placed on the surface and underground, which was in operation since 1951.
Experimental conditions: In a previous study (Lopes et al, 2012), the effect of C:N:P rate, pH and the percentage of structural material on the aerobic metabolism were investigated using Bartha respirometry test, according to the Brazilian standard NBR 14283 (ABNT, 1999). In this preliminary experiment, the basic conditions for oil biodegradation in clayey soil were established. In the present study based on a monitoring period of 121 days, the efficiency of static and dynamic biopiles simulated in bench scale were compared through analysis of selected variables. In both cases (dynamic and static biopiles), biostimulation and bioaugmentation + biostimulation were investigated. Throughout the experiment, moisture was checked regularly and distilled sterilized water was introduced from the top of the reactors when needed. Table 1 shows the experimental setups in different bioremediation strategies.
Dynamic biopile (microcosms): The microcosms (simulating dynamic biopiles) were containers constructed of glass of 4.5 cm thick, bottom area of 420 cm2 and volume of 1,890 cm3. Each microcosm received 1.15 kg of soil recently contaminated with crude oil, which corresponded to approx. 3% crude oil (weight/dry weight) kept in room temperature (24oC). Aeration was accomplished through mechanical mixing, three times per week (Benedict et al., 2005), carried out with an aluminium spoon previously sterilized. Soil moisture was adjusted periodically with sterile distilled water, after analysis of soil moisture. Throughout the experiment, a para-film sheet covered the microcosms to minimize external microbiological contamination (Benedict et al. 2005). Static biopile (forced up flow-aerated bioreactor): The bioreactor with forced aeration consisted of acrylic columns 33 cm high (27 cm used) and 14 cm in diameter, kept at ambient temperature (24oC). The bottom of each bioreactor contained a chamber of 923 cm3 for leachate collection in case leaching from the soil happened, and a ½ inch hole with a distance of 33 cm from the base for the entry of air into the system. Between the bottom and the leachate collection chamber, a disc of perforated acrylic was kept and under this disc, fine nylon screen was placed to prevent the soil to pass to the lower (leachate collector) chamber. Aeration was made by injection of air at room temperature. Three pumps operated with a maximum flow of 19 L min-1, 26.9 in Hg vacuum able to
withstand up to 36-psi continuous pressure, which corresponds to 2.24 atm. Each air pump sent air in parallel to two bioreactors. A hose was connected to each reactor and before the point of entry, a Dwyer flowmeter was connected (0-25 L min-1) for controlling air to be distributed in the system. Each hose is coupled to the respective reactor through nipples ½ "and flanges ½". Aeration was set to secure a ratio of approximately 0.6 L min
-1 per kg of contaminated soil, according to preliminary tests in the laboratory. The airflow
reading was performed directly through a graduated scale fixed at flowmeters, which are devices consisting of a conical tube with transparent spherical float, nylon, which provides high chemical resistance, low moisture absorption and transparency to facilitate routine inspection.
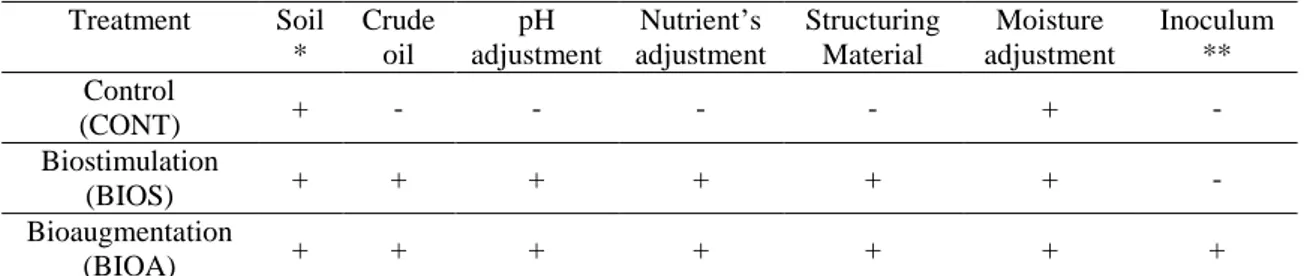
Table 1: Treatment setups (all in triplicates).
Treatment Soil * Crude oil pH adjustment Nutrient’s adjustment Structuring Material Moisture adjustment Inoculum ** Control (CONT) + - - - - + - Biostimulation (BIOS) + + + + + + - Bioaugmentation (BIOA) + + + + + + +
*Aged contaminated soil; **Microorganisms obtained from the aged contaminated soil, cultivated with the crude oil as the sole carbon source and inoculated in the BIOA1. The control (CONT) was carried out in order to compare the behaviour of biodegrading microbiota in soil with low aged contamination versus soil with more recent and high contamination. In order to evaluate the performance of the indigenous microbiota on biodegradation of petroleum hydrocarbons biostimulation was made in BIOS treatment containing recently contaminated soil, with pH adjustment, nutrient and moisture adjustment and structural materials following suitable values previously established (Lopes et al. 2012 ). To assess the contribution of inoculation of enriched microbiota,
following parameters previously optimized (Lopes et al. 2012) bioaugmentation together with biostimulation (BIOA) treatment was conducted.
Preparation and characterization of crude oil: The oil used in the experiments came from the field of an onshore production in the state of Espírito Santo, Brazil and was supplied by the Research Centre of Petrobrás - CENPES on 13/08/2010. The crude oil was stored in 5 L containers at 20-25 °C.
Soil preparation: The soil transferred to aluminium trays was left to dry in an oven at 45°C during 72 h. Then, the soil was sieved on a 2-mm mesh sieve Granutest (ABNT 10; Tyler 9). Based on the literature, it was decided to work with soil with 3% (dry weight) contamination. The homogenization soil-oil was performed manually in a plastic tray. After contamination, the soil remained inside an exhaust hood during one week to allow removal of most volatile compounds.
Moisture adjustment: The initial moisture was adjusted with distilled water in all treatments to approximately 50% of field capacity (FC), a value that is within the range recommended in the literature for microbiota activity.
pH: The pH was adjusted to approx. 7.5 which is within the range 6.5 to 8.5 considered appropriate for microbiota metabolism (Sarkar et al., 2005). This adjustment was made by adding calcium hydroxide Ca (OH)2, using a neutralization curve, prepared according
to Lima (2004). It is noteworthy that the pH adjustment was made before the contamination and was checked every three days during the fifteen days prior to contamination, so, to ensure that the condition of pH (7.5) in the study were maintained. Adjustment of nutrients: The fix nitrogen and phosphorus was carried out using a salt solution of ammonium nitrate (NH4NO3) and potassium phosphate dibasic (K2HPO4),
respectively as Lopes et al (2012). The concentration of the solutions used depended on the C: N: P ratios tested. N: P: 100: 1: 0.5 in the biodegradation experiment C the following relation was used. These calculations were based on the content of total organic carbon in the soil, as determined by carbon content of organic matter already present in the soil plus the carbon from the contamination. It was assumed that the latter was 85%. Addition of structural material: Sifted sterilized sand 2 mm mesh was added to achieve 5% (dry weight) as structuring material. The selection of sand was because it is an inert material, which do not interfere chemically with the biodegradation process.
Extraction of microbial culture soil: The microbial culture (EXP11) used as inoculum in this study was obtained from a soil sample that showed the best performance in the biodegradation of the contaminants in a previous experiment (Lopes et al, 2012). The total heterotrophic population of bacteria, fungi and microorganisms degrading crude oil found in the soil was estimated in the beginning. For extraction of microorganisms, 100 g of the soil was added to a 500-ml Erlenmeyer flask containing 200 ml of BH liquid mineral medium plus glucose as carbon source (Table 2) and the mixture was stirred in a shaker (Quimis 816M200) at 30 °C ± 1 °C after 4 days. After that, the microbial growth was observed according to turbidity of the culture medium compared to the control flask containing the same medium without soil sample (Cianella, 2010). The quantification of heterotrophic microbial population and oil degrading microorganisms was performed.
Table 2: Composition of the Bushnell Hass medium. Component Concentration (g L-1) Melaço 10.0 NaCl 5.0 K2HPO4 1.0 NH4H2PO4 1.0 (NH4)2SO4 1.0 MgSO4.7H2O 0.2 pH 7.0 ± 0.2*
* pH adjusted with 1 mol l-1 of HCl and 1mol l-1 NaOH.
Acclimatized microbial culture EXP11: In a laminar flow hood (T2.5 Pachane TPCR-CB), an aliquot of 20 ml of microbial suspension of the extraction medium was transferred to another Erlenmeyer flask, containing 200 ml of the liquid mineral medium BH, but without molasses, which was replaced by 1% (v v-1) of crude oil as the sole carbon source. This new mixture was stirred in a shaker (Q 816M20) at temperature of 30 °C ± 1 ° C during 4 days, when 20 ml was withdrawn and transferred to another Erlenmeyer flask containing liquid mineral medium added BH 2% of crude oil. This flask was incubated under the same conditions. The procedure was repeated after 4 days of incubation with the concentration of 3% of crude oil. After 16 days, an aliquot of acclimated microbial suspension was used in bioaugmentation treatments. The substitution of molasses by varying concentrations of crude oil aimed to stimulate the microorganisms with potential to degrade this contaminant as the carbon source, giving them a selective advantage over the others and make the microbial population less vulnerable to the toxic effects of the contaminant in subsequent trials of bioremediation. All glassware and equipment used in the extraction processes and acclimatization, and the liquid mineral medium BH without crude oil was previously sterilized by autoclaving (290-Q I2) at 121oC for 15 min. Chemical, physical and microbiological analysis: The physical and chemical analyses recommended by the Brazilian Agricultural Research Centre for Soils (Embrapa Solos) were conducted in accordance with the Manual of Methods of Soil Analysis (Embrapa, 1997). The total petroleum hydrocarbons (TPH) and polycyclic aromatic hydrocarbons (PAH) were analysed in one laboratory with accreditation. The microbiological parameters were analysed at the Laboratory LABIFI of the Rio de Janeiro State University (UERJ). Table 3 presents the analyses and methods applied.
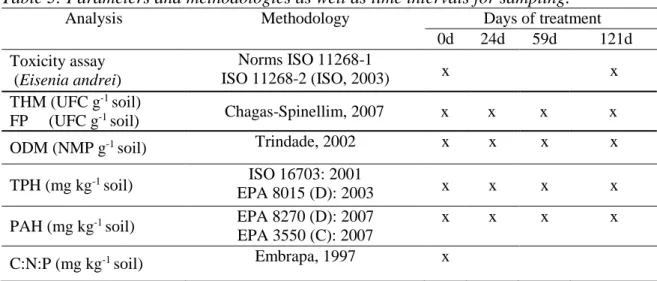
Table 3: Parameters and methodologies as well as time intervals for sampling.
Analysis Methodology Days of treatment 0d 24d 59d 121d Toxicity assay (Eisenia andrei) Norms ISO 11268-1 ISO 11268-2 (ISO, 2003) x x THM (UFC g-1 soil) Chagas-Spinellim, 2007 x x x x FP (UFC g-1 soil)
ODM (NMP g-1 soil) Trindade, 2002 x x x x
TPH (mg kg-1 soil) ISO 16703: 2001
EPA 8015 (D): 2003 x x x x
PAH (mg kg-1 soil) EPA 8270 (D): 2007
EPA 3550 (C): 2007
x x x x
Microorganisms: The quantification data of the total heterotrophic microorganisms (THM), the population of fungi (FP) and the population of oil-degrading microorganisms (ODM) were transformed into log (10).
3 RESULTS AND DISCUSSION
3.1 Characterization of soil study
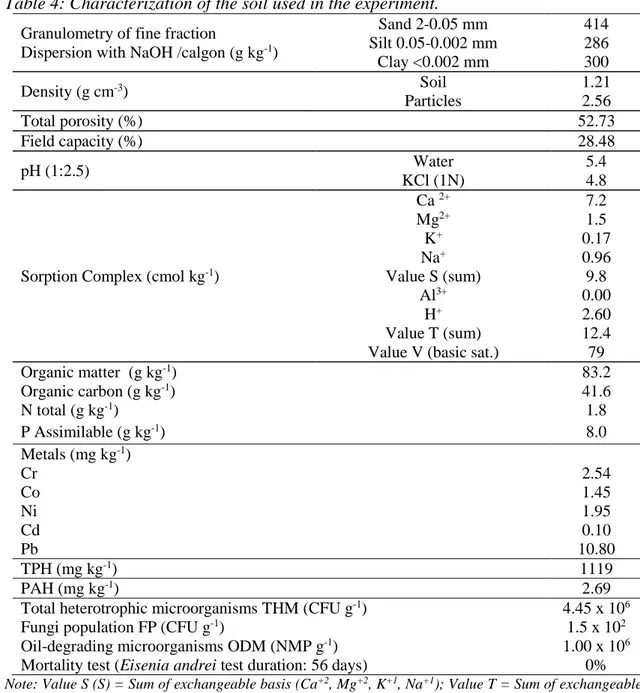
Table 4 shows the biological characterization, physical and chemical contamination and soil before the beginning of the treatments.
Table 4: Characterization of the soil used in the experiment.
Granulometry of fine fraction
Dispersion with NaOH /calgon (g kg-1)
Sand 2-0.05 mm 414 Silt 0.05-0.002 mm 286 Clay <0.002 mm 300 Density (g cm-3) Soil 1.21 Particles 2.56 Total porosity (%) 52.73 Field capacity (%) 28.48 pH (1:2.5) Water 5.4 KCl (1N) 4.8
Sorption Complex (cmol kg-1)
Ca 2+ 7.2 Mg2+ 1.5 K+ 0.17 Na+ 0.96 Value S (sum) 9.8 Al3+ 0.00 H+ 2.60 Value T (sum) 12.4 Value V (basic sat.) 79
Organic matter (g kg-1) 83.2 Organic carbon (g kg-1) 41.6 N total (g kg-1) 1.8 P Assimilable (g kg-1) 8.0 Metals (mg kg-1) Cr 2.54 Co 1.45 Ni 1.95 Cd 0.10 Pb 10.80 TPH (mg kg-1) 1119 PAH (mg kg-1) 2.69
Total heterotrophic microorganisms THM (CFU g-1) 4.45 x 10⁶
Fungi population FP (CFU g-1) 1.5 x 10²
Oil-degrading microorganisms ODM (NMP g-1) 1.00 x 10⁶
Mortality test (Eisenia andrei test duration: 56 days) 0% Note: Value S (S) = Sum of exchangeable basis (Ca+2, Mg+2, K+1, Na+1); Value T = Sum of exchangeable
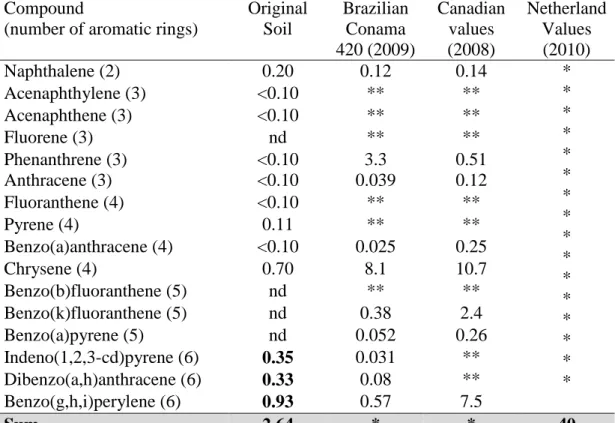
Table 5 presents the values observed in the soil under study and the reference values of CONAMA Resolution No 420, the Canadian Soil Quality Guidelines (2008) and the Dutch list for the 16 EPA priority PAH.
Table 5: HPA in mg kg-1 in the original soil samples and reference values for intervention by the environmental agencies.
Compound
(number of aromatic rings)
Original Soil Brazilian Conama 420 (2009) Canadian values (2008) Netherland Values (2010) Naphthalene (2) 0.20 0.12 0.14 * * * * * * * * * * * * * * * * Acenaphthylene (3) <0.10 ** ** Acenaphthene (3) <0.10 ** ** Fluorene (3) nd ** ** Phenanthrene (3) <0.10 3.3 0.51 Anthracene (3) <0.10 0.039 0.12 Fluoranthene (4) <0.10 ** ** Pyrene (4) 0.11 ** ** Benzo(a)anthracene (4) <0.10 0.025 0.25 Chrysene (4) 0.70 8.1 10.7 Benzo(b)fluoranthene (5) nd ** ** Benzo(k)fluoranthene (5) nd 0.38 2.4 Benzo(a)pyrene (5) nd 0.052 0.26 Indeno(1,2,3-cd)pyrene (6) 0.35 0.031 ** Dibenzo(a,h)anthracene (6) 0.33 0.08 ** Benzo(g,h,i)perylene (6) 0.93 0.57 7.5 Sum 2.64 * * 40
** There is no reference value; < 0.01: means below detection limit (0.01) by the analytical method.
The soil in this study was 41% sand, 29% silt and 30% clay. Using the triangle of soil texture classes (ASME, 1989), the soil is classified as clay loam. It is noteworthy that a hallmark of loam soil is the strong presence of organic matter, which increases the water availability in the soil (Soil Quality Information Sheet, 2012). This characteristic affects the chemical reactions and microbiological activity. The pH of the soil in this study was moderately acid (5.4-4.8 in water and KCl) and both values are below the optimum pH range reported for bioremediation processes (from 6.5 to 8.5, according to Sarkar et al., 2005). According to Table 4, the cation exchange capacity (CEC) value T suggests clay with low activity (T <27 cmolc kg-1). This result indicates that in acidic natural conditions, this soil has a low capacity to retain cations. According to Chagas-Spinelli (2007), high concentrations of low activity, clay makes it similar to sandy soils regarding CEC. It is worth mentioning that the cation exchange capacity indicates intense leaching of Mg2+ cations, Ca+2, K+ and Na+ exchangeable, indicating that this soil has low fertility and high
degree of weathering (Meurer, 2004).
The C:N:P rate of the original soil was around 100: 4.32: 19.2. Such a rate was calculated from the results of organic carbon, assimilable nitrogen and phosphorus, which were respectively: 41.6 g kg-1, 1.8 g kg-1 and 8 mg kg-1. The range recommended by EPA (1994) regarding carbon, nitrogen and phosphorus to maintain an adequate microbial growth and promote the biodegradation of the contaminated soil varies from 100: 10: 1 to 100: 1: 0.5.
Table 4 shows the values for certain toxic metals in the original soil. All toxic metals analyzed were below the limit recommended for the same in CONAMA Resolution No
420 (CONAMA, 2009). The quantification of total petroleum hydrocarbons in the original soil was 1,119 mg kg-1. CONAMA Resolution No 420/09 has no guideline values for TPH. However, Ferreira (2010) points out that the Dutch List reference values for TPH in soil ranges from 50 (expected in clean soil) to 5,000 mg kg-1 (value indicating intervention). The List of Berlin, the reference values vary from 300 to 5,000 mg kg-1, depending on the sensitivity of the site (Seabra, 2005). According to these European references, the soil in the present study is within the range that requires intervention. The quantitation of PAH in the original soil was 2.69 mg kg-1. Some PAH (particularly those with higher molecular weight) were found in concentrations higher than the values recommended in both the CONAMA Resolution No 420, as the Canadian guidelines. This
suggests that the quality of the soil in this study may be inappropriate to the biota. According to US EPA (1994), for the biodegradation in the reactors to be effective, the minimum density of heterotrophic microorganisms in the soil must be 103 CFU g-1. The soil in the original study showed quite satisfactory density for bioremediation process initial conditions.
3.2 Characterization of treatments at baseline (t0 = 0 day)
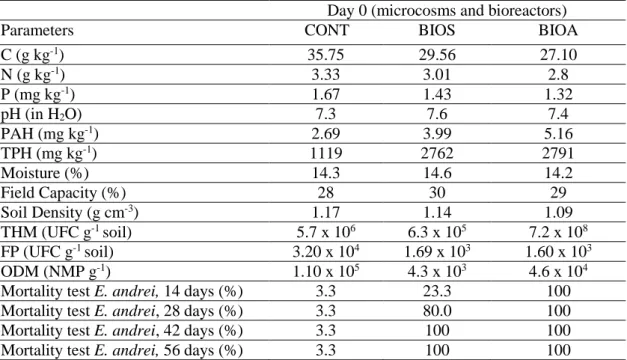
The physical, chemical and biological characteristics of the contaminated soil at the beginning of the experiment (t0 = day) is found in Table 6. Nutrients rate and initial pH were kept approximately similar to the pre-established in previous studies: C: N: P ratio (100: 1: 0.5) and pH = 7.5. Table 6 shows that in the beginning of the experiment, the TPH values (BIOS and BIOA) were at alert (T) values and intervention (I) levels, according to the Dutch List.
Table 6: Characterization of the newly contaminated soil at the beginning of the experiment (the values are the average of triplicates).
Day 0 (microcosms and bioreactors)
Parameters CONT BIOS BIOA
C (g kg-1) 35.75 29.56 27.10 N (g kg-1) 3.33 3.01 2.8 P (mg kg-1) 1.67 1.43 1.32 pH (in H2O) 7.3 7.6 7.4 PAH (mg kg-1) 2.69 3.99 5.16 TPH (mg kg-1) 1119 2762 2791 Moisture (%) 14.3 14.6 14.2 Field Capacity (%) 28 30 29 Soil Density (g cm-3) 1.17 1.14 1.09 THM (UFC g-1 soil) 5.7 x 10⁶ 6.3 x 10⁵ 7.2 x 10⁸ FP (UFC g-1 soil) 3.20 x 10⁴ 1.69 x 10³ 1.60 x 10³ ODM (NMP g-1) 1.10 x 10⁵ 4.3 x 10³ 4.6 x 10⁴
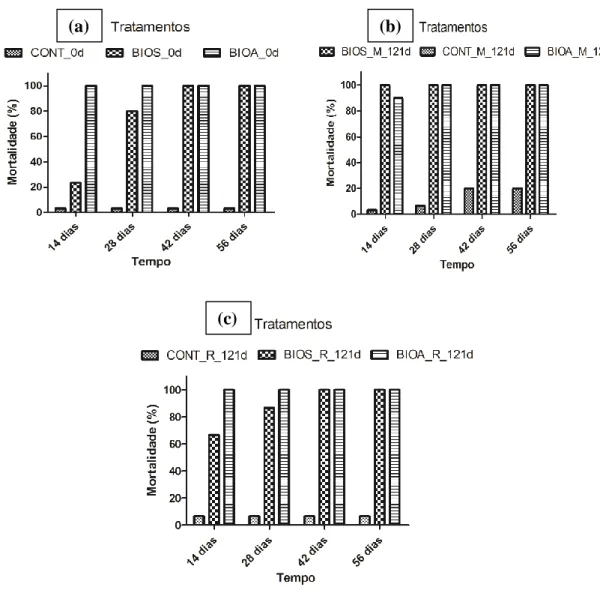
Mortality test E. andrei, 14 days (%) 3.3 23.3 100 Mortality test E. andrei, 28 days (%) 3.3 80.0 100 Mortality test E. andrei, 42 days (%) 3.3 100 100 Mortality test E. andrei, 56 days (%) 3.3 100 100
The values of the 16 priority PAH in BIOS and BIOA treatments in the beginning were below the values informed in the Dutch List, but in both treatments, some aromatic compounds exhibited values above CONAMA Resolution No 420 and the Canadian list.
3.3 Microbiological indicators during the treatment
Tables 7, 8 and 9 show the THM, FP and ODM respectively in the CONT, BIOS and BIOA treatments.
According to US EPA (1994), for the biodegradation to be effective, the minimum quantification of total heterotrophic microorganisms (THM) in the soil should be 103 CFU g-1 soil. CONT, BIOS and BIOA treatments initially showed a THM population,
fungi population (FP) and crude oil degrading microorganisms (ODM) in densities satisfactory for bioremediation to occur (Table 7).
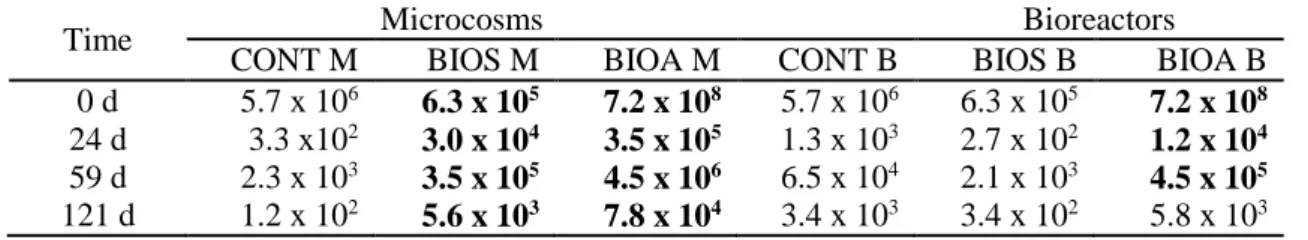
Table 7: Total heterotrophic microorganisms THM (FCU g-1 soil) in CONT, BIOS and
BIOA at 0, 24, 59 and 121 days of treatment.
Time Microcosms Bioreactors
CONT M BIOS M BIOA M CONT B BIOS B BIOA B 0 d 5.7 x 10⁶ 6.3 x 10⁵ 7.2 x 10⁸ 5.7 x 10⁶ 6.3 x 10⁵ 7.2 x 10⁸
24 d 3.3 x10² 3.0 x 10⁴ 3.5 x 10⁵ 1.3 x 10³ 2.7 x 10² 1.2 x 10⁴
59 d 2.3 x 10³ 3.5 x 10⁵ 4.5 x 10⁶ 6.5 x 10⁴ 2.1 x 10³ 4.5 x 10⁵
121 d 1.2 x 10² 5.6 x 10³ 7.8 x 10⁴ 3.4 x 10³ 3.4 x 10² 5.8 x 10³
Table 8: Total fungi population TF (FCU g-1 soil) in CONT, BIOS and BIOA at 0, 24, 59 and 121 days of treatment.
Time Microcosms Bioreactors
CONT M BIOS M BIOA M CONT B BIOS B BIOA B 0 d 3.2 x 10⁴ 1.7 x 10³ 1,6 x 10³ 3,2 x 10⁴ 1,7 x 10³ 1.6 x10³
24 d 4.0 x 101 3.1 x 10² 4.3 x 10³ 3.1 x 101 1.0 x 101 4.2 x10²
59 d 2.4 x 10³ 8.3 x 10² 5.0 x 10³ 2.3 x 10³ 3.4 x 10⁴ 1.2 x10²
121 d 4.5 x 10² 5.6 x 10³ 2.3 x 10² 4.8 x 101 2.5 x 10² 2.3 x10²
Table 9: Oil degrading microorganisms ODM (MPN g-1 soil) in CONT, BIOS e BIOA at
0, 24, 59 and 121 days of treatment.
Time Microcosms Bioreactors
CONT M BIOS M BIOA M CONT B BIOS B BIOA B 0 d 1.1 x 10⁴ 4.3 x 10³ 8.6 x 10⁷ 1.1 x 10⁴ 4.3 x 10³ 8.6 x 10⁷
24 d 1.2 x 10³ 1.1 x 10³ 1.1 x 10³ 9.2 x 10² 7.5 x 10³ 1.1 x10⁵
59 d 7.8 x 10⁴ 4.6 x 10³ 1.1 x 10⁵ 1.3 x 10² 4.6 x 10⁴ 4.3 x 10³
121 d 6.5 x 10² 3.5 x 10² 2.3 x 10² 2.3 x 10² 2.34 x 10³ 5.4 x 10²
As expected, the density of total heterotrophic microorganisms THM (Table 7) in bio-augmented soils (BIOA) was much higher (two to three orders of magnitude) than the densities observed in other treatments (CONT and BIOS). However, at 121 days, the superiority was not so evident. The THM density was higher in the treatment BIOS compared to the control CONT only in microcosms, but not in the bioreactors.
The populations of fungi (TF) during the treatment period (Table 8) showed a wide range of variation. Thus, the data were fit to log base 10. In all treatments, there was a fluctuation with a slight tendency to decrease with time.
The population density of oil biodegrading microorganisms OBM (Table 9) was much higher in the treatment BIOA in both microcosm and bioreactor, with a tendency for decaying over time. The OBM density which in the beginning was similar in BIOA-m
(microcosms simulating dynamic biopile) and BIOA-b (bioreactors simulating static biopile with forced aeration), at 121 days, was much higher in BIOA-b compared to BIOA-m (about three orders of magnitude). Therefore, at the final of the experiment, the oil biodegradation activity was more intense in bioreactors BIOA-b (systems simulating static biopiles), compared with BIOA-m (systems simulating dynamic biopiles).
3.4 Evaluation of the decay of TPH and PAH
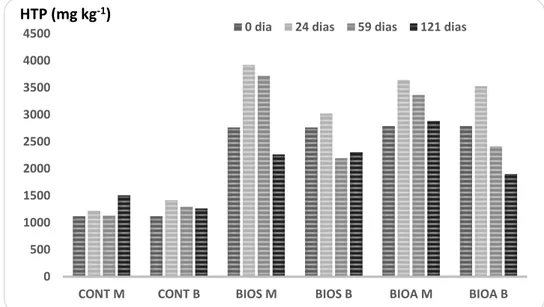
Figure 5 shows the evolution of the extractable levels of HTP clay soil at 0, 24, 59 and 121 days with an upward trend over time.
Figure 5: TPH in soil treated in microcosms (M) and bioreactors (B) throughout the experiment using different strategies such as control (CONT), biostimulation (BIOS), bioaugmentation (BIOA). Sampling at different treatment periods (day 0, 24, 59 and 121).
TPH: All BIOS and BIOA treatments both in microcosms (simulating biopile dynamic) or in bioreactors (simulating static biopile with forced aeration) showed initially elevation of the TPH concentration (24 days) followed by a decay in the end (59-121 days) (Figure 5). However, at day 121, all treatments had TPH values greater than the controls in both technologies (CONT M and CONT B).
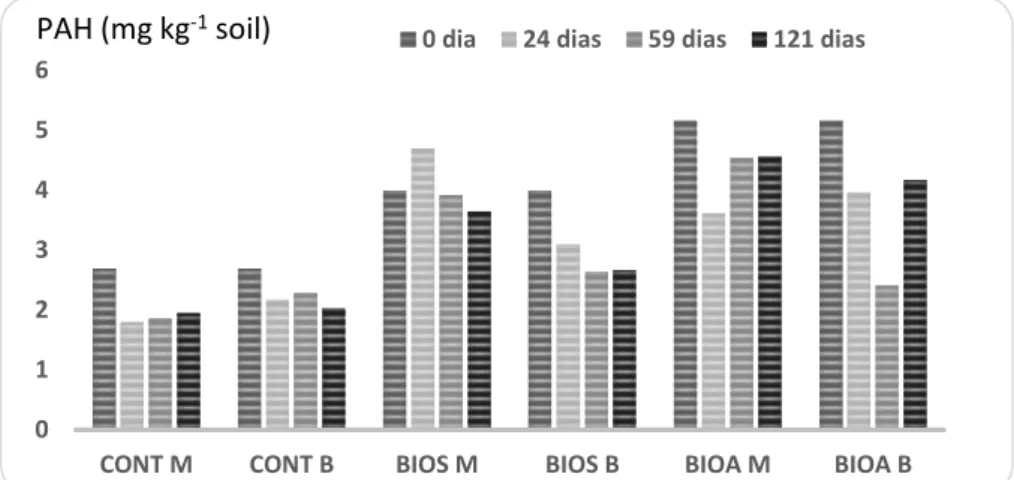
PAH: Figure 6 shows the PAH levels on days 0, 24, 59 and 121 after different treatment strategies. The amount of PAH extracted from soils that underwent treatments simulating dynamic biopile showed an increase during the treatment period.
With respect to fluctuations with elevation of values mostly from day 0 to 24 observed in both TPH and PAH, this result suggests biodegradation of hydrocarbons with high molecular weight, even outside the range of TPH and PAH detected and quantified by GC-MS, which generates hydrocarbons within the range quantified by GC-MS. This phenomenon is more likely in crude oil contaminations. Such mechanism would result in an initial increase of hydrocarbons within the measured range. If this is the case, one can consider the BIOA-b the treatment that promoted the highest TPH cleavage and removal. Such result would suggest the forced aeration is more efficient when compared to aeration technique by tumbling. 0 500 1000 1500 2000 2500 3000 3500 4000 4500
CONT M CONT B BIOS M BIOS B BIOA M BIOA B
0 dia 24 dias 59 dias 121 dias
Increasing the concentration of hydrocarbons occurred in the present experiment is not commonly reported, although it has been previously described (Cianella, 2010; López & Mueller, 2009; Oliveira et al, 2007). According to these authors, TPH increased levels observed in the beginning of the treatment may be related to the process of degradation of larger and complex compounds with longer hydrocarbon chains, which are first broken into shorter chains, and then are biodegraded, giving initially an increase in the total concentration.
Since the decay of TPH and PAH was slow, it is strongly recommended the addition of surfactants to increase bioavailability, particularly in clay soils contaminated with crude oil. It is also suggested longer periods for bioremediation.
Figure 6: PAH in soil treated in microcosms (M) and bioreactors (B) throughout the experiment using different strategies such as control (CONT), biostimulation (BIOS), bioaugmentation (BIOA). Sampling at different treatment periods (day 0, 24, 59 and 121).
3.5 Toxicity test with E. andrei
Regarding toxicity, E. andrei was exposed to the soil during different periods (14, 28, 42 and 56 days), since 56 days is the time required for the reproductive cycle. The endpoints observed were mortality and reproduction (number of eggs and juveniles at 14, 28, 42 and 56 days). No mortality was observed with the soil without additional oil, however, decay of biomass occurred throughout the period. According to Dorough & Roberts (1984), loss of body weight is a good indicator of sub-lethal effects. However, some factors cause stress in individuals during the test, for example, repeated adjustments of moisture (Saterbak et al., 2000). Throughout the test, the presence of unhatched eggs did not occur.
In contaminated soil samples from BIOS and BIOA treatments at day 0, the organisms exposed to the contaminated soil showed high mortality (100%) compared to the controls (3.33%). However, the treatments that received inoculum (BIOA M and BIOA B) showed 100% mortality at day 14, and in the BIOS treatment, it was observed 80% mortality. Figure 7 shows the acute toxicity (lethality %) caused by the soil at the beginning and the end of the experiment. The tests indicated an increased lethality in all treatments. These results strongly suggest that the degradation process of organic compounds in the soil made available some compounds more toxic to the organisms than the parent compounds.
0 1 2 3 4 5 6
CONT M CONT B BIOS M BIOS B BIOA M BIOA B
0 dia 24 dias 59 dias 121 dias
E. andrei suffered lethal effect on the rate varying from 70% to 100% after only 14 days
in contact with the soil treated by biostimulation and bioaugmentation in microcosms or bioreactors (Figure 7). After only 14 days of exposure the lethality caused by the soil treated by biostimulation or bioaugmentation in microcosms (Figure 7b) and bioreactors (Figure 7c) were already higher than the lethality caused by the soil with no treatment (Figure 7a) during the same exposure time. The results indicate that the accelerated degradation of hydrocarbons occurred in contaminated soil stimulated or bio-augmented generating more toxic compounds than the parent compounds, which is consistent with recent studies (Guimarães et al., 2012).
Figure 7: Mortality rates (in %) of E. andrei exposed during 14, 28, 42 and 56 days to contaminated soil treated by the strategies CONT, BIOS e BIOA in microscosms (M) and bioreactors (B). (a) Soil obtained at the beginning of the treatment (day 0) before filling the microcosms and bioreactors. (b) Soil obtained at the end of the treatment (121 days) from microcosms CONT M, BIOS M and BIOA M (simulating dynamic biopile). (c) Soil obtained at the end of the treatment (121 days) from bioreactors CONT B, BIOS B and BIOA B (simulating static biopile with forced aeration).
(a) (b)
4 CONCLUSIONS
Despite fluctuations in the measured values, it was possible to observe a trend in decreasing microbial density for THM, FP and ODM when the densities at day 0 were compared to the densities at day 121. The microbial density of THM and ODM were markedly higher in soils with bioaugmentation at the beginning of the treatments, and at the end of the experiment, such superiority was observed only for the bioaugmentation reactor BIOA B (static biopile with forced aeration).
For TPH, the technique of forced aeration was superior in removal of total petroleum hydrocarbons only in the treatment of bioaugmentation (BIOA B), being equivalent to the dynamic biopile technique in the other treatments (CONT and BIOS). For PAH such superiority in efficiency was less clear, but was also observed in the biostimulation (BIOS B) as well as in the bioaugmentation (BIOA B) treatment.
Although these findings require further confirmation, the simulation in microcosms and bioreactors strongly suggests the static biopile with forced aeration achieves better results in terms of reduction of hydrocarbons in contaminated soil. One constraint to interpret the results is the fact that in a short period (e.g. 14 days), the biodegradation processes resulted in more TPH and PAH than the levels found in the original contaminated soil, considering the compounds in the range of carbon numbers detected and quantified by the analytical methods applying GC-MS. In general, bioremediation of clayey soils contaminated by crude oil, containing both ancient and recent contaminations, gathers the greatest challenges for bioremediation, both due to the textural characteristics of the soil and the nature of the contaminant. Processes are apparently slow, requiring longer periods of treatment and might require auxiliary tools for speeding up the processes, such as addition of surfactants.
REFERENCES
ATLAS, R. M. Microbial degradation of petroleum hydrocarbons: environmental perspective. Microbiological Reviews. Washington, US, v. 45, n. 1, p. 180-209, Mar. 1981. BENTO, F. M.; CAMARGO, F. A. O.; OKEKE, B. C.; FRANKENBERGER, W. T. Comparative bioremediation of soils contaminated with diesel oil by natural attenuation, biostimulation and bioaugmentation. Bioresource Technology, v. 96, n. 9, p. 1049-1055, Jun. 2005.
BENYAHIA, F.; ABDULKARIM, M.; ZEKRI, A.; CHAALAL, O.; HASANAIN, H. Bioremediation of crude oil contaminated soils: A Black Art or an Engineering Challenge? In: The 7th World Congress of Chemistry, 2005 Glasgow. Process Safety and Environmental Protection, Rugby, v. 83, n. 4, p. 364-370, July 2005. CIANELLA, R.C. Assessment of different strategies for bioremediation of soil
contaminated with diesel B5. [MSc Dissertation, in Portuguese]. Rio de Janeiro. Rio de Janeiro State University. Institute of Chemistry. 2010.
COULON, F.; PELLETIER, E.; GOURHANT, L.; DELILLE, D. Effects of nutrient and temperature on degradation of petroleum hydrocarbons in contaminated sub-Antarctic soil. Chemosphere, Oxford, UK, v. 58, n. 10, p. 1439-1448, Mar. 2005. DELILLE, D.; COULON, F.; PELLETIER, E. Effects of temperature warming during a
bioremediation study of natural and nutrient-amended hydrocarbon-contaminated sub-Antarctic soils. Cold Regions Science and Technology, Amsterdam, v. 40, n. 1-2, p. 61-70, Nov. 2004.
DELILLE, D. COULON, F.; PELLETIER, E. The influence of temperature on bacterial assemblages during bioremediation of a diesel fuel contaminated sub Antarctic soil. Cold Regions Science and Technology, Amsterdam, v.48, n.2, p.74-83, May. 2007. DIBBLE, J. T.; BARTHA, R. Effect of environmental parameters on the biodegradation
of oil sludge. Applied and environmental microbiology, Washington, USA, v.37, n. 4, p. 729-239, Apr. 1979.
DIPLOCK, E. E.; MARDLIN, D. P.; KILLHAM, K. S.; PATON, G. I. Predicting bioremediation of hydrocarbons: Laboratory to field scale. Environmental Pollution, v.157, p.1831–1840, 2009.
ENVIRONMENTAL PROTECTION AGENCY U. S. EPA, Method 8015D, Non-halogenated Organics using GC/FID, Rev. Jun, 2003.
ENVIRONMENTAL PROTECTION AGENCY U. S. EPA, Method 82705D, Semi volatile Organic Compounds by Gas Chromatography/Mass Spectrometry (GC/MS), Rev. Jan. 1998.
ENVIRONMENTAL PROTECTION AGENCY U. S. EPA, Method 3550C, Ultrasonic Extraction, Rev. 3, Feb. 2007.
EWEIS, J. B. ERGAS, S. J.; CHANG, D. P. Y.; SCHROEDER, E. D. Bioremediation principles. [s.L.]: McGraw-Hill, 1998. p. 296.
FANTROUSSI, S. Bioaugmentation of a Soil Bioreactor Designed for Pilot-scale Anaerobic Bioremediation Studies. Environ. Sci. Technol., n. 33, p. 2992-3001, 1999.
FEDERAL REMEDIATION TECHNOLOGIES ROUNDTABLE. Remediation Technologies Screening Matrix and Reference Guide. Available in: http://www.frtr.gov/matrix2/section4/4-42.html. Access in: 17 Set 2012.
FERGUSON, S. H.; POWELL, S. M.; SNAPE, I; GIBSON, J. A. E.; FRANZMANN, P. D. Effect of temperature on the microbial ecology of a hydrocarbon-contaminated Antarctic soil: Implications for high temperature remediation. Cold Regions Science and Technology. n. 3, p. 115–129, 2008
GOGOIA, B. K.; DUTTA, N. N.; GOSWAMI, P.; MOHAN, T. R. K. A case study of bioremediation of petroleum-hydrocarbon contaminated soil at a crude oil spill site. Advances in Environmental Research, Berkley, California, v. 7, n. 4, p. 767-782, Jun. 2003.
HORN, R.; Aggregate strength of differently textured soils and its alteration with external stress application. Proc. Int. Symp. Sealing, Crusting and Hardsetting Soils, Brisbane, Qld., Australia, in press, 1994.
INTERNATIONAL ORGANIZATION FOR STANDARDIZATION. Soil quality- Effects of pollutants on earthworms – Part 1: Determination of acute toxicity using artificial soil substrate. ISO 11268-1. Geneva, 1993.
INTERNATIONAL ORGANIZATION FOR STANDARDIZATION. Soil quality – Effects of pollutants on earthworms – Part 2: Determination of effects on reproduction. ISO 11268-2. Geneva, 1998.
INTERNATIONAL ORGANIZATION FOR STANDARDIZATION. Soil quality – Determination of content of hydrocarbon in the range C10 to C40 by gas chromatography. ISO 16703. Geneva, 2001.
JENNY, H. 1994. Factors of Soil Formation – A System of quantitative Pedology. New York, Dover publications. 281p.
JORGENSEN, K.S., PUUSTINEN, J, SUORTTI, A.M. Bioremediation of petroleum hydrocarbon-contaminated soil by composting in biopiles. Environmental Pollution, v. 107, n.2, p.245-254, Feb. 2000.
KODRES, C. A. Coupled water and air flows through a bioremediation soil pile. Environmental Modelling & Software, Oxford, v. 14, n. 1, p. 37–47, Oct. 1998. KRIIPSALU, M., MARQUES, M., NAMMARI, D.; HOGLAND, W. Fate of polycyclic
aromatic hydrocarbons during composting of oily sludge. Environmental Technology, Vol. 29. pp 43-53. 2007.
KRIIPSALU, M.; NAMMARI, D. Monitoring of biopile composting of oily sludge. Waste Management & Research. 1-9. 2009.
LI, L.; CUNNINGHAM, C, C. J.; PAS, V.; PHILP, J. C; BARRY D. A.; ANDERSON, P. Field of new aeration system for enhancing biodegradation in a biopile. Waste Management, v.24, p.127 – 137, 2004.
KHAN, F. I.; HUSAIN, T.; HEJAZI, R. An overview and analysis of site remediation Technologies. Journal of Environmental Management, n. 71, p. 95–122, Feb 2004. KRÄMER, Ute. Phytoremediation: novel approaches to cleaning up polluted soils.
Current opinion in biotechnology, v. 16, n.2, p. 133-141, 2005.
LEAHY, J. G.; COWELL, R. R. Microbial degradation of hydrocarbons in the environment. Microbiological Reviews. Washington, v. 54, n.3, p. 305-315, Sep. 1990.
LÓPEZ, D. A. R.; MUELLER, D. Use of calcium peroxide in bioremediation of soils contaminated with petroleum hydrocarbons (in Portuguese). Caderno de Pesquisa Série Biologia, v. 21, n.3, p. 61-72, 2009.
MCKENZIE, B. M.; DEXTER, A. R. Methods for studying the permeability of individual soil aggregates. Journal of agricultural engineering research, v. 65, n. 1, p. 23-28, 1996.
MARIANO, A. P.; DANIEL D.; M; ANGELIS, D. F.; PIRÔLLO, M. P. S.; CONTIERO, J. Biodegradability of Commercial And Weathered Diesel Oils. Brazilian Journal of Microbiology, São Paulo, v. 39, n. 1, p. 133-142, Jan/Mar. 2008.
MUSEU DE SOLOS DO RIO GRANDE DO SUL. Disponível em:
<http://coralx.ufsm.br/msrs/textural.php. Acesso em: 01 Abril 2012>.
OLIVEIRA, D. S.; BAISCH, P. R. M.; MACHADO, M. I. Degradation of petroleum in estuarine environment in Patos Lagoon via artificial spill (in Portuguese). In: Congresso Brasileiro de Pesquisa e Desenvolvimento em Petróleo e Gás, 4, 2007, Campinas, SP. Proceedings… Campinas: PDPETRO, 2007.
PORTIER, R. J.; IQBAL, J.; METOSH-DICKEY, C A.; DAVIS. T. M. Managing Bioremediation of a Creosote-Contaminated Superfund Site by Optimizing Moisture and Temperature in a Biopile: Wiley Interscience. Wiley Periodicals, 2007.
POZDNYAKOVA, Larisa; POZDNYAKOV, Anatoly; ZHANG, Renduo. Application of geophysical methods to evaluate hydrology and soil properties in urban areas. Urban Water, v.3, n.3, p. 205-216, 2001.
RIKE, A.G.; HAUGEN, K.B.; ENGENE, B. In situ biodegradation of hydrocarbons in arctic soil at sub-zero temperatures - field monitoring and theoretical simulation of the microbial activation temperature at a Spitsbergen contaminated site. Cold Regions Science and Technology, Amsterdam, v. 41, n. 3, p. 189-209, Mar. 2005. RIZZO, A. C. L., CUNHA, C.D.; SANTOS, R. L. C.; SANTOS, R. M.; MAGALHÃES,
H. M.; LEITE, S. G. F.; SORIANO, A. U.; Preliminary identification of the bioremediation limiting factors of a clay bearing soil contaminated with crude oil. Journal of the Brazilian Chemical Society, v. 19, n. 1, 169-174, 2008.
SANSCARTIER, D. et al. Bioremediation of diesel-contaminated soil by heated and humidified biopile system in cold climates. Cold Regions Science and Technology, v. 55, p. 167–173, 2009.
SANSCARTIER, D, et al. Bioremediation of weathered petroleum hydrocarbon soil contamination in the Canadian high Arctic: laboratory and field studies. Chemosphere, v. 77, p. 1121–1126, 2009.
SCHOEFS, O.; DESCHÊNES, L.; SAMSON, R. Efficiency of a new covering system for the environmental control of biopiles used for the treatment of contaminated soils: Industrial Chair In Site Bioremediation. Montreal. Ecole Polytechnique de Montreal, 1998.
SEABRA, P. Application of bioremediation in clayey soil contaminated with petroleum (in Portuguese). Doctorate Thesis in Chemical Engineering. Universidade Federal do Rio de Janeiro, Rio de Janeiro, 2005.
SHUKLA, K.; SINGH, N. K.; SHARMA, S. Bioremediation: Developments, Current Practices and Perspectives: Genetic Engineering and Biotechnology Journal, 2010. SUSARLA, Sridhar; MEDINA, Victor F.; MCCUTCHEON, Steven C. Phytoremediation: an ecological solution to organic chemical contamination. Ecological Engineering, v. 18, n. 5, p. 647-658, 2002
YANG, Si-Zhong et al. Bioremediation of oil spills in cold environments: a review. Pedosphere, Pequim, v. 19, n. 3, p. 371–381, 2009.
CHAGAS-SPINELLI, A.C.O.C. Bioremediation of clayey soil contaminated with polycyclic aromatic hydrocarbons from diesel spill (in Portuguese). Doctor Thesis in Geosciences, Universidade Federal de Pernambuco, Recife. 2007.
THAVASI, R; JAYALAKSHMI, S; BALASUBRAMANIAN, T; BANAL, I. M. Biosurfactant production by Corynebacterium kutscheri from waste motor lubricant oil and peanut oil cake. Letters in Applied Microbiology, 45: 686–691, 2007. TRINDADE, P.V.O. Assessment of techniques of bioaugmentation and biostimulation in
bioremediation of soil contaminated with petroleum hydrocarbon. 2002. 127p. MSc thesis (in Portuguese). Escola de Química, Universidade Federal do Rio de Janeiro, Rio de Janeiro, RJ.
TRUAX, D. D.; BRITTO, R.; SHERRARD, J. H. Bench-scale studies of reactor-based treatment of fuel-contaminated soils. Waste Management, Oxford, UK, v. 15, n. 5-6, p. 351-357, 1995.
UNITED STATES ENVIRIONMENTAL PROTECTION AGENCY USEPA Biopiles. Available in: http://www.epa.gov/oust/pubs/tum_ch4.pdf.
YERUSHALMI, L. ROCHELEAU, S. CIMPOIA, R. SARRAZIN, M. SUNAHARA, G. PEISAJOVICH, A LECLAIR, G. GUIOT, S.R. Enhanced biodegradation of petroleum hydrocarbons in contaminated soil Bioremediation Journal, vol. 7, pp. 37 51, 2003 .
ZHOU, E.; CRAWFORD, R. Effects of oxygen, nitrogen, and temperature on gasoline biodegradation in soil. Biodegradation, Dordrecht, v. 6, n. 2, p. 127-140, 1995.