Application and
Validation of the
UEQ KPI in a
hedonic context
MASTER THESIS WITHIN: Informatics NUMBER OF CREDITS: 30 Credits
PROGRAMME OF STUDY: IT, Management and Innovation AUTHOR: Kim Blunck
JÖNKÖPING May 2020
A context-only extension study in the form of
an online survey on Netflix
i
Master Thesis in Informatics
Title: Application and Validation of the UEQ KPI in a hedonic context – A context-only extension study in the form of an online survey on Netflix
Author: Kim Blunck
Tutor: Daniela Mihailescu Date: 2020-05-19
Key terms: user experience (UX), user experience questionnaire (UEQ), UEQ KPI, hedonic qualities, replication study, context-only extension study, online survey, Netflix
Abstract
The aim of the study was to replicate and validate the UEQ KPI introduced by Hinderks et al. (2019) in a context-only extension study by applying it to a product with high hedonic qualities, namely Netflix. The secondary research aim was to identify areas of improvement for Netflix’ user experience. An online survey was conducted with a positivist research philosophy and a deductive research approach in order to achieve the research aims. The chosen methodology proved to be appropriate and effective.
The UEQ KPI was confirmed to be a valid methodology to evaluate products with high hedonic qualities. This study hence contributed to the validity of the UEQ KPI and to its generalisability. Certain areas of improvement and their perceived importance for Netflix’ UX were identified, listed from most to least promising: Efficiency, Stimulation and the Novelty. However, as the UEQ KPI is fairly new, more research on this topic is necessary to further validate it. Certainly, this topical development in UX research was proven to be a promising approach to assess the UX of products with different characteristics in a cheap, fast and accurate way.
ii
Table of Contents
1. Introduction... 1
1.1 Background and Problem Discussion... 1
1.2 Research Aim... 3 1.3 Research Questions ... 4 1.4 Empirical context ... 5 1.5 Delimitations... 6 1.6 Definitions ... 6 2. Theoretical Background ... 9
2.1 User Experience and Usability... 9
2.2 User Experience quality aspects ... 13
2.3 User Experience Questionnaire (UEQ) ... 14
3. Method ... 17
3.1 Research Philosophy and Paradigm ... 17
3.2 Research Approach ... 18
3.3 Research Design... 18
3.3.1 Research Strategy and Research Space ... 18
3.3.2 Research Method ... 20 3.3.3 Data Collection ... 21 3.3.3.1 Survey Design ... 21 3.3.3.2 Sampling ... 22 3.3.4 Data Analysis ... 23 3.3.5 Data consistency ... 24 3.4 Research Quality ... 24
3.4.1 Data reliability and validity ... 25
3.4.2 Generalisability ... 25
3.5 Research ethics ... 26
4. Results and Analysis ... 27
4.1 Results and reliability per UEQ scale... 27
4.2 Results in relation to the benchmark data set... 35
4.3 Results of the KPI extension ... 37
4.4 Results of the KPI extension in relation to the original study ... 41
5. Discussion ... 45
5.1 Implications for Research ... 45
5.1.1 Method Discussion ... 45
5.1.2 Results and Analysis Discussion ... 46
5.2 Implications for Practice... 48
5.3 Limitations ... 48
6. Conclusion and future research ... 50
6.1 Conclusion ... 50
6.2 Future Research ... 52
7. References... 54
iii
List of acronyms
UX User Experience
UEQ User Experience Questionnaire
KPI Key Performance Indicator
UEQ KPI User Experience Questionnaire Key Performance Indicator UX KPI User Experience Key Performance Indicator
SUS System Usability Scale
PSSUQ Post-Study System Usability Questionnaire
iv
Figures
Figure 1: Definition of the term Usability ... 10
Figure 2: Research model ... 12
Figure 3: Scale structure of the User Experience Questionnaire ... 13
Figure 4: Definition of the term User Experience. ... 14
Figure 5: Potential research space ... 19
Figure 6: Mean value and confidence interval per scale ... 29
Figure 7: Relative user experience quality of Netflix per scale ... 35
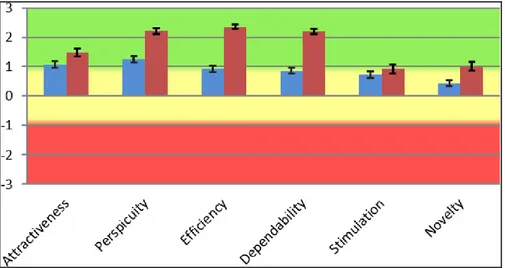
Figure 8: Netflix – UEQ Scales (blue) and Assessed Importance (red). ... 38
Figure 9: Amazon – UEQ Scales (blue) and Assessed Importance (red). ... 42
Figure 10: Skype – UEQ Scales (blue) and Assessed Importance (red) ... 43
Tables Table 1: Mean value, variance and standard deviation per item ... 28
Table 2: Mean value and variance per UEQ scale ... 29
Table 3: Confidence interval per scale ... 31
Table 4: Cronbach’s alpha coefficient per scale ... 32
Table 5: Interim conclusion 1 – UX of Netflix ... 34
Table 6: Interim conclusion 2 – UX of Netflix ... 36
Table 7: Assessed importance in comparison to the UEQ results per scale ... 37
Table 8: UEQ KPI Value Range – Overview ... 39
Table 9: Interim conclusion 3 – UX of Netflix ... 40
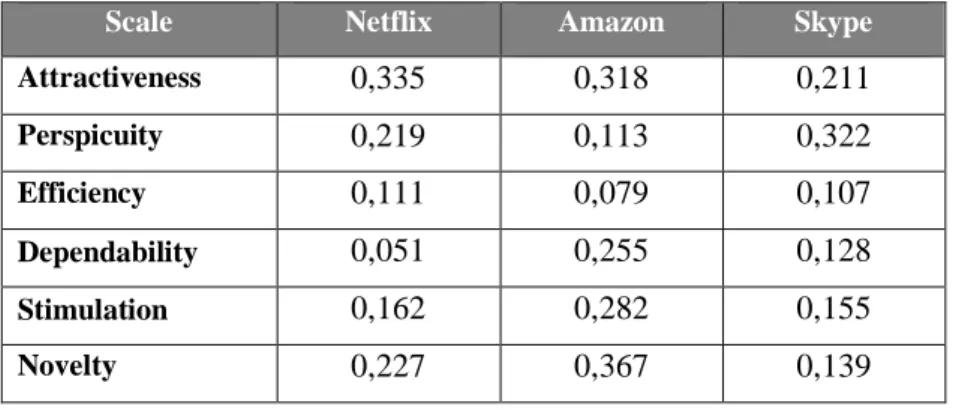
Table 10 :Pearson correlation between Scale Means and Assessed Importance per product ... 42
Appendix Appendix 1: UEQ English ... 58
Appendix 2: Online survey ... 60
Appendix 3: Confidence interval per item ... 64
1
1.
Introduction
______________________________________________________________________ In the following chapter a short overview of the context is given and the problem, purpose and research questions are introduced. Furthermore, the object of the study and the delimitations are discussed in order to give a clear picture of the scope of the thesis. Last, the terminology is defined to ensure clarity throughout the following chapters.
______________________________________________________________________
1.1 Background and Problem Discussion
In the era of information systems, digitalization, the Internet of Things and Web 4.0, from a manager’s perspective processes and products become more difficult to evaluate. The need for fast and cheap evaluation methods with simple and comparable results regarding human-machine interaction-based products or processes becomes more evident.
User experience (UX) is not clearly defined in the literature, as it includes various aspects of human-machine interaction (cf. Eberhard-Yom, 2010; Broschart, 2011; Hinderks, Schrepp, Domínguez Mayo, Escalona Cuaresma & Thomaschewski, 2019; Nielsen & Loranger, 2006). Especially the distinction between usability and UX is vague and varies, because the terms are commonly used as synonyms (Broschart, 2010). A comprehensive example for this phenomenon is the usage of the term usability-test, which is a method automatically evaluating UX aspects and not only the usability of a product (Broschart, 2010).
The need to break down all aspects of an UX assessment into one figure to allow and simplify decision-making processes on a management level concerning UX emerges, yet lacking consent concerning this topic makes this difficult. A concept, which is not consistently defined, is difficult to assess and even more difficult to represent in one figure.
Most decisions made in organisations are based on key performance indicators (KPI’s), as they sum up complicated processes in one figure for managers to simplify the decision-making process (Hinderks et al., 2019). Based on this Hinderks et al. (2019) reason that a KPI assessing the UX of a product is needed.
2
When evaluating the UX of a product, various methods are applicable (e.g. usability tests, interviews, card sorting, etc.). According to Díaz-Oreiro, López, Quesada & Guerrero (2019), the use of standardised questionnaires in UX research increases. Hinderks et al. (2019) argue that standardised questionnaires can measure different UX aspects individually on independent scales, which secures accuracy, as a reason for their increased application.
However, the individual measurement lacks the previously described demand for a KPI assessing the UX. Some UX questionnaires either consist of just one question (e.g. SUS) or summarize the results in one figure by calculating the mean value of all scales (e.g. PSSUQ), yet Hinderks et al. (2019) argue that these procedures do not comply with the need for a KPI.
In 2019, Hinderks et al. (2019) introduced a new approach for calculating an UX KPI, including the subjective perceived importance of different user experience aspects of respondents based on a standardised user experience questionnaire. The general idea of evaluating the UX of a product in one figure is defined as an UX KPI, however the concrete method, which was developed by Hinderks et al. (2019) based on one concrete questionnaire, namely the standardised user experience questionnaire (UEQ), is defined as the UEQ KPI. By including the perceived importance of the UX characteristics by each respondent, Hinderks et al. (2019) assume that the individual priorities have an impact on the evaluation of these UX characteristics.
UX questionnaires have gained popularity during the last decade. A literature review by Díaz-Oreiro et al. (2019) analysing three regularly used UX questionnaires, namely the AttrakDiff1, the UEQ and the meCUE, shows a significant increase of in usage of these
standardised questionnaires since their first emergence in 2006. This increase can especially be observed in Europe and more precisely, in Germany.
1 An established user experience evaluation questionnaire introduced in 2003 by Hassenzahl, Burmeister & Koller (2003).
3
The UEQ, on which Hinderks et al. (2019) based the UEQ KPI method, was developed in 2008 by Laugwitz, Held & Schrepp (2008). Since this method is relatively new, using it in another context can contribute to the procedure’s validation.
Berthon, Pitt, Ewig & Carr (2002) state, that the verification of observations is often neglected in research, even though “replications are an important component of scientific method in that they convert tentative belief into accepted knowledge” (Berthon et al., 2002, p.416). They argue, that a “bridge between generation and replication” (Berthon et al., 2002, p.416) is needed and introduce a framework for that aim. Their “framework for envisioning and evaluating research replication, extension and generation” (Berthon et al., 2002, p.416) will be used in this thesis as a research strategy and as a terminology guideline regarding replication studies.
1.2 Research Aim
As the construction of an UX KPI, which includes the subjective priorities of respondents, is a recent development in UX research, more contributions are needed to investigate the concept further as well as validating it.
In their paper “Developing a UX KPI based on the user experience questionnaire” Hinderks et al. (2019) identified various potential areas for further research concerning the UEQ KPI. A selection of potential research alternatives they suggested is listed below:
• Need for the development of a benchmark for UEQ KPI by conducting larger amount of evaluations
• KPI must be proven in different languages for various established and new products
• Implementation in organisations
• Possible influence of products with higher hedonic qualities
4
While all research alternatives suggested by Hinderks et al. (2019) are topical and topical, considering the constraints of time and resources, some of the listed areas are not applicable for conducting this thesis.
However, replicating the UEQ KPI method of Hinderks et al. (2019) by using it to study a product with high hedonic qualities, appears to be in scope and an expedient procedure to further investigate and verify the method of the UEQ KPI in a different context.
A product with high hedonic qualities, i.e. a product intended to evoke pleasure (Hassenzahl, 2001) and to entertain is Netflix (Fernández, Yáñez, & Hernández-Sarpi, 2019). While the theory and method used by Hinderks et al. (2019) are held constant, applying the UEQ KPI to Netflix extends the use of UX KPI to a hedonic context, such as the music streaming within the entertainment industry.
According to Berthon et al. (2002), this replication strategy, i.e. a context-only extension, which has been used regularly in the Information System (IS) area, especially in evaluating user satisfaction.
The aim of this thesis consists of a twofold aim (A1 & A2), which is defined as follows: A1: The first research aim is to replicate and validate the UEQ KPI introduced by Hinderks et al. (2019) in a context-only extension study by applying it to a product with high hedonic qualities, namely Netflix.
A2: The secondary research aim is to identify areas of improvement for Netflix’ user experience.
In the course of this thesis, both aims are intended to be reached by answering the research questions defined in the next section.
1.3 Research Questions
With respect to the previously defined research aims, three research questions are defined. First, a research question (RQ1) is formulated, which corresponds to A1 and is designed in a way that its answer is sufficient to reach the first research aim (A1):
5
RQ1: What is the validity of the UEQ KPI to assess the UX of a product in a hedonic context?
The second and the third research questions (RQ2 & RQ3) are designed to correspond to the second research aim (A2):
RQ2: What are areas of improvement for Netflix’ user experience and how important are these areas?
RQ3: How can the UEQ KPI of Netflix be improved?
The research questions are directly related to the research aims. While RQ1 concerns the replication and the validation of the method, RQ2 concerns potential areas of improvement for Netflix’ UX and RQ3 builds on RQ2 and concerns Netflix’ UEQ KPI score. While a purely quantitative study cannot answer what exactly needs to be changed to improve the UX of a product, general areas of improvement can be determined (Schrepp, 2019).
To fulfil the research aim, all research questions must be answered. Moreover, the results can potentially help to verify the UEQ KPI introduced by Hinderks et al. (2019).
1.4 Empirical context
In this study, a product with high hedonic qualities is evaluated, to extend the scope of the application of the UEQ. Moreover, the product chosen for evaluation was needed to be widely used, to simplify the process of recruiting respondents. A natural choice for a product with high hedonic qualities, which is also widely used, is a product with an entertainment purpose. According to Fernández-Robin et al. (2019), Netflix, as a leading organisation in the area of streaming and therefore entertainment, qualifies as highly hedonic. Netflix has more than 100 million subscribers and is a global actor (Fernández-Robin et al., 2019). Moreover, Fernández-Robin et al. (2019) describe Netflix as innovative. Netflix, therefore, qualifies as a suitable product to be evaluated in the context of this thesis, because of its high hedonic characteristics and its large number of users.
6
1.5 Delimitations
There is a restriction of time and other resources when conducting a thesis. Therefore, a clear scope and boundaries need to be defined in order to achieve the research aim. Due to time constraints, there are certain limitations regarding the data collection. First, the amount of data that can be collected is restricted. In the original study, 882 respondents from three different countries (England, Germany and Spain) evaluated either Amazon or Skype regarding their UX. First, neither the number of respondents, nor the evaluation and comparison of two different products can be achieved in this work. The results of this study are compared to the results of the original study by Hinderks et al. (2019), but solely one product with high hedonic qualities is assessed and not two. Second, the origin of the respondents will be restricted to Germany. Thus, a comparison between languages and cultural influences exceeds the scope. Also, as the study is conducted in Germany, the chosen language of the questionnaire is German to get more valuable and accurate results. Therefore, it must be taken into consideration, that the translation of the questionnaire and the results can possibly lead to differing interpretations.
Furthermore, the implementation in organisations is not examined in this work, as the regarded methodology needs to be analysed and verified further before it can be applied in an organisational context. This work aims to contribute to the validation of the UEQ KPI and therefore the implementation in organisations is out of scope.
1.6 Definitions
In the following, relevant terms to this thesis are defined and distinguished in order to clarify the terminology in the following chapters. In the literature the terms user experience and usability are often used synonymously or with differentiating definitions. Thus, the clarification of them is especially important and is done within the second chapter. Moreover, according to Berthon et al. (2002), the terminology when considering generation and replication studies is unclear in literature as well and a clarification is needed regarding this work.
7
1. Key performance indicator (KPI):
According to Heery & Noon (2017, “key performance indicator (KPI)”, para. 1), a key performance indicator is defined as “a measure of achievement that can be attributed to an individual, team, or department. KPIs should be constructed using the SMART principles of objective-setting and are normally developed as part of a performance management system.” The SMART principles are defined as “Specific, Measurable, Agreed, Realistic, and Timed, though the precise words derived from the initials vary from organisation to organisation and from theorist to theorist” (Heery & Noon, 2017, “SMART objectives”, para. 1).
2. User Experience Questionnaire (UEQ):
The UEQ is “a widely used evaluation tool for interactive products” and “a fast and direct measurement of UX” (Schrepp, Hinderks & Thomaschewski, 2017a, p.40). It consists of six scales, which are based on different UX aspects. Each scale consists of four to six items and in total the UEQ consists of 26 items (Schrepp et al., 2017a).
3. User Experience Questionnaire Key Performance Indicator (UEQ KPI):
The UEQ KPI is calculated based on the UEQ scales and the measured importance of each scale and thereby evaluates the UX of a product in one figure (Hinderks et al., 2019). As previously explained, a KPI should be constructed using the SMART principles. According to Hinderks et al. (2019), it has not been confirmed if the UEQ KPI meets all the requirements regarding the SMART principles, as it has not yet been implemented in an organisation.
4. User Experience Key Performance Indicator (UX KPI):
“A user experience key figure is one of many important key figures that represents one aspect of the success of the company or its product” (Hinderks et al., 2019, p.38).
The UX KPI in comparison to the previously defined UEQ KPI is the more general concept of evaluating the UX of a product in one figure, while the UEQ KPI is a concrete method developed be Hinderks et al. (2019).
8
5. Pure replication study:
“A pure replication study is defined as a duplication of a given target study. All key research parameters held constant […]” (Berthon et al., 2002, p.419).
6. Extension study:
“An extension study is defined as a duplication of a target study in which one or more key parameters are altered” (Berthon et al., 2002, p.419).
7. Context-only extension:
“This strategy takes an existing theory and method and applies it in a different context” (Berthon et al., 2002, p.423).
9
2.
Theoretical Background
______________________________________________________________________ The purpose of this chapter is to familiarise the reader with the theoretical background of the term user experience and to find a working definition in the context of this thesis. Thus, the terms user experience and usability are distinguished and the difference between ergonomic and hedonic UX qualities is outlined. Then, the concept of UX is considered in the context of the user experience questionnaire. Finally, both the construction and the establishment of the UEQ are described, which is necessary to understand the further proceedings of this study.
______________________________________________________________________
2.1 User Experience and Usability
While the term user experience was first introduced by Norman in 1993 as part of his job title at Apple, the term usability has been defined beforehand (Norman, 2008). Jakob Nielsen, one of the first researchers to investigate usability, has published his first book on usability research in 1993, namely “Usability Engineering”(1993). Don Norman coined the term user experience, because he “thought human interface and usability were too narrow: [he] wanted to cover all aspects of the person’s experience with a system, including industrial design, graphics, the interface, the physical interaction, and the manual” (Norman, 2008). The concept of usability has evolved with the advancement of the internet. While websites became more accessible to users and therefore became common tools, researchers analysed which properties websites required to fulfil their users’ needs (Nielsen & Loranger, 2006).
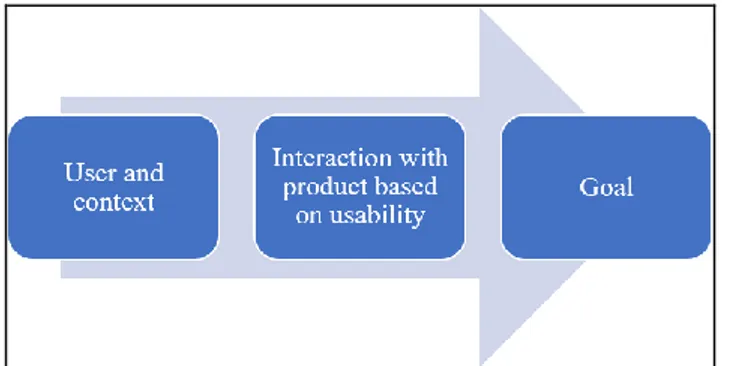
Nowadays, usability is understood to be a part of the area of UX, though both terms have no consistent definition in literature (Broschart, 2010). However, in most cases usability is defined based on the ISO Norm 9241-11 (1998), which defines usability as the extent to which a product can be used by a certain user in a certain context, to achieve certain goals in an efficient, effective and satisfactory way, yet a coherent definition does not exist (Broschart, 2010). When defining usability some authors, including Düweke & Rabsch (2011), focus on the literal interpretation of the combination of the terms “use” and “ability” and therefore define usability, as the ability to use a product. Others interpret the term as user-friendliness (cf. Gizycki, 2002; Eberhard-Yom, 2010; Broschart, 2011; Krug, 2017; Heinsen & Vogt, 2003). When
10
defining usability, Düweke & Rabsch (2011) also take into account the ISO Norm 9241-11 (1998), by including the interpretation of usability as a tool to achieve a goal. The relation is visualized in the following Figure 1:
Figure 1. Definition of the term Usability, adapted from Düweke & Rabsch (2011, p.522).
In the context of this thesis the term usability is defined as follows, including different approaches:
The usability of a product enables users to achieve their individual goals in an efficient, effective, and satisfactory way.
Oftentimes in literature, the definition of usability goes together with the establishment of usability rules, of which the most popular is arguably “don’t make me think” by Krug (2017). In this thesis, usability rules are not further considered, as they are not relevant to the application of standardised user experience questionnaires.
As previously described, usability is considered a part of the UX of a product (Broschart, 2010; Eberhard-Yom, 2010). Yet, the distinction between the terms usability and UX is unclear, hence the terms are commonly used as synonyms (Broschart, 2010). A comprehensive example for this phenomenon is the usage of the term usability-test, which is a method automatically evaluating UX aspects and not only the usability of a product (Broschart, 2010).
Depending on which author is considered, UX consists of different aspects. Eberhard-Yom (2010) defines UX as a combination of Usability, Joy of Use, Utility and Accessibility. According to her, Joy of use is based on aesthetic and emotional features, Utility describes which tools must be available for users to reach their goals and Accessibility aims to make products available to as many potential users as possible.
11
Broschart (2010) on the other hand, divides UX in two steps: ability and volition. Ability describes the functionality of a product and Volition describes the psychological aspects of the usage of a product (Broschart, 2010). According to Broschart (2010), Ability (objective) and Volition (subjective) are two different steps. First, the product must function in order for a user to achieve his or her goals (Broschart, 2010). Then, the user must want to achieve his or her goals with the product, which requires trust (Broschart, 2010). Yet in another definition, UX is divided in the aspects Look, Feel and Usability (Düweke & Rabsch, 2011). While Look describes design aspects, Feel relates to the reaction of a product to interaction with users (Düweke & Rabsch, 2011). So far, eight different UX aspects have been listed, based on three different definitions, which have been published within two years. Some of these aspects have similar meanings, their definitions overlap. Yet, these different understandings of the term user experience outline that there is no coherent definition in literature.
However, it must be mentioned that UX is also defined in the ISO Norm 9241–210 (2019, 3.15) as „a person's perceptions and responses that result from the use and/or anticipated use of a product, system or service”. It can be presumed, that there is no consistent definition, because the ISO Norm description is vague.
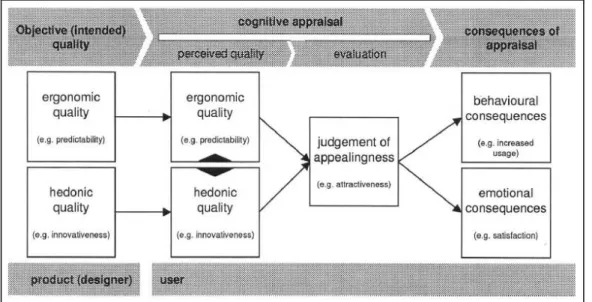
In 2006, Hassenzahl & Tractinsky (2006) found that there is a new “focus on positive emotional outcomes, such as joy, fun and pride” (Hassenzahl & Tractinsky, 2006, p.93). The difference between the ease of use and the fun to use a product was first distinguished by Carroll & Thomas in (1988). According to them, these aspects are sometimes even contradictive. In 2000, Hassenzahl, Platz, Burmeister & Lehner (2000) stated that there have already been studies conducted concluding that the fun of use influences the usage intentions and the user satisfaction of a product. Therefore, they suggested and tested a research model, in which they grouped different quality dimensions into two quality aspects: ergonomic and hedonic qualities.
The ergonomic quality refers to usability and is therefore goal-directed. The hedonic qualities are not goal-directed, as they refer to the previously mentioned fun to use a product. The authors also investigated, how these two aspects affect the perceived appeal of a product. The results showed that the differentiation in ergonomic and hedonic qualities is consistent and that users can evaluate them independently. Also, they are both nearly equally important for the perceived appeal of a product, while the
12
appeal is also consistent. It was concluded that the model for the perceived appeal can be used as a guidance for more research (cf. Hassenzahl et al., 2000).
A year later, Hassenzahl (2001) further investigated the proposed model, which is illustrated in Figure 2:
Figure 2. Research model, adapted from Hassenzahl (2001, p.484).
In the corresponding article, Hassenzahl (2001) confirms hisproposed construct that ergonomic and hedonic qualities can be measured independently, yet both influence the overall appeal of a product to a certain extent.
The UEQ was constructed based on the research of Hassenzahl (2001) and its scales correspond to the ergonomic and hedonic qualities and the judgement of appeal in Hassenzahl’s (2001) research model.
Usability and the distinction between hedonic and ergonomic UX qualities are the foundation for the working definition of UX for the scope of this thesis, which is defined in the following section based on the UEQ.
13
2.2 User Experience quality aspects
The User Experience Questionnaire was constructed in 2008 by Laugwitz et al. (2008) with the aim to take into account subjective UX criteria to a reasonable extent. According to Laugwitz et al. (2008), previously existing UX questionnaires either did not or only barely captured subjective UX aspects or they were overrepresented. The UEQ was intended to capture usability criteria, including efficiency and effectiveness, but also what Laugwitz et al. (2008, p.2) called “fuzzy criteria”, which relates to user satisfaction and hedonic qualities. Eventually, they decided on 26 items divided in six different scales (Schrepp et al., 2017a). These are Attractiveness, Perspicuity, Efficiency, Dependability, Stimulation and Novelty and are illustrated in Figure 3:
Figure 3. Scale structure of the User Experience Questionnaire, adapted from Schrepp et al. (2017a, p.41)
As pictured, Perspicuity, Efficiency and Dependability are considered to be pragmatic UX qualities and are “goal-directed” (Schrepp et al., 2017a, p.41), whereas Stimulation and Novelty are considered to be hedonic UX qualities and are “not goal-directed” (Schrepp et al., 2017a, p.41). According to Schrepp et al. (2017a), Attractiveness is supposed to capture “a user’s general impression”. Hence, the scales are not assumed to be independent but dependent on one another (Schrepp et al., 2017a).
Based on the UEQ scales, a UX definition was developed, which corresponds to the developers assumed relationship between the scales. The scales are characterised as UX aspects, as illustrated in Figure 4:
14 Figure 4. Definition of the term User Experience.
Hence, UX can be divided in six different aspects (Attractiveness, Perspicuity, Efficiency, Dependability, Stimulation and Novelty), of which five aspects can be grouped in two categories (pragmatic and hedonic qualities).
In the context of this thesis the term UX is therefore defined as follows:
User Experience consists of the perceived general attractiveness of a product, as well as pragmatic qualities (Perspicuity, Efficiency and Dependability) and hedonic qualities (Stimulation and Novelty), which are dependent on one another.
2.3 User Experience Questionnaire (UEQ)
The scale structure of the UEQ has already been discussed in the previous section as a basis for the UX definition (cf. Figure 3 and Figure 4). However, the questionnaire was constructed in an extensive study and is based on the theoretical UX framework introduced by Hassenzahl (2001). Laugwitz et al. (2008) “assumed that persons perceive several distinct aspects when they evaluate a software product. The perceived attractiveness of the product is then a result of an averaging process from the perceived quality of the software concerning the relevant aspects in a given usage scenario” (Laugwitz et al., 2008, p.4). On that basis, they determined to implement two categories
15
of items in the questionnaire, ones that “measure the perceived attractiveness directly” (Laugwitz et al., 2008, p.4) and ones that “measure the quality of the product on the relevant aspects” (Laugwitz et al., 2008, p.4).
Then, in correspondence with usability experts an item pool consisting of 221 adjectives was generated. Through different procedures, the item pool was then reduced to 80 items in reference to the experts’ opinions. For each of the 80 items a complementary antonym was found and these pairs of adjectives were formatted into a seven-stage scale, with the positive adjective being on one extreme of the scale and the negative adjective on the other. The 80 items were then tested in six different contexts on 153 participants in total. Based on the collected data, a factor analysis was carried out and six scales with 26 items were identified. The six scales have already been stated in chapter 2.2 and are Attractiveness, Perspicuity, Efficiency, Dependability, Stimulation and Novelty. The rest of the 80 items were eliminated. The questionnaire’s English translation was then validated in two follow-up studies, as the original version was constructed in German (for the full English version see Appendix 1). The authors concluded that the factor analysis for the UEQ scale construction confirmed that hedonic and pragmatic qualities are both relevant for a realistic UX assessment. These qualities are accurately represented by the UEQ in contrast to other UX questionnaires (Laugwitz et al., 2008).
A recent literature review by Díaz-Oreiro et al. (2019), showed a general increase in the usage of standardised UX questionnaires since their first development in 2006. Out of the three reviewed questionnaires the UEQ has been used the most in recent years, especially in Germany and passed the usage of a long-established questionnaire, namely the AttrakDiff (Díaz-Oreiro, 2019).
The UEQ was developed further since its construction in 2008, for example a short version (UEQ-S) was created by Schrepp, Hinderks & Thomaschewski (2017b). Furthermore, in 2019 Schrepp & Thomaschewski (2019) developed a framework based on the UEQ, namely the UEQ+, where they adjusted the format, the content of the scales, included the perceived importance and created additional scales.
Another recent development is the construction of the KPI extension (Hinderks et al., 2019). The originally constructed six scales of the UEQ remained untouched, but six items were added, in which the participants are asked to rate the importance of each
16
scale on a seven-stage Likert scale. Based on the results, the relative importance of each scale is calculated per participant and these values are multiplied with the mean values per scale for each respondent and then added up. The results are basically a UX rating per person including the individual perceived importance of the different scales per participant. For the overall UEQ KPI, the average of these results is calculated. The KPI therefore combines the subjective perceived importance of UX aspects and the (still independent) results of the previously established UEQ into one figure (Hinderks et al., 2019).
The KPI extension was then validated in a three-country study with a total amount of 882 participants evaluating Amazon and Skype. The authors concluded that the UEQ KPI needs yet to be proven as valid by applying it to various established and new products and in different languages and cultures. Moreover, the implementation in organisations needs to be examined (Hinderks et al., 2019).
17
3.
Method
______________________________________________________________________ The purpose of this chapter is to provide information on the applied research philosophy and paradigm, the research approach, the research design, including details on the research strategy, research method, data collection, data analysis and data consistency, and the motivation behind choosing them. Moreover, the research quality is discussed based on the data reliability and validity, as well as the generalisability of the results. Finally, the research ethics are taken into consideration.
______________________________________________________________________
3.1 Research Philosophy and Paradigm
According to Saunders, Lewis & Thornhill (2019), a researchers philosophy can be classified into five different categories: positivism, critical realism, interpretivism, postmodernism and pragmatism. Positivism constitutes of the assumption that reality is external, independent and can be measured and observed (Saunders et al., 2019). Moreover, Saunders et al. (2019) illustrate that critical realists believe that reality is layered, but still external and that “facts are social constructs”(Saunders et al., 2019, p.144). Interpretivism on the other hand, is based on the concept that reality is complex and “socially constructed” (Saunders et al., 2019, p.145), while the researcher’s interpretation is a valued contribution. In postmodernism, researchers also assume that reality is rich, but “focus on absences” (Saunders et al., 2019, p.145), instead of “dominant ideologies” (Saunders et al., 2019, p.145). According to Saunders et al. (2019), pragmatism is focused on problem solving and practical solutions.
Furthermore, Saunders et al. (2019) distinguish between objectivism and subjectivism. According to Berthon et al. (2002), objectivism consists of the assumption that “(1) the world exists independently of being; (2) the task of science is to develop true and accurate knowledge […]; (3) all knowledge claims must be critically evaluated” (Berthon et al., 2002, p.418), whereas subjectivism assumes that “scientific statements are not true or false descriptions of some external, independent reality, but rather are constructions or creations of the subject scientist” (Berthon et al., 2002, p.418).
Within the scope of this thesis, a positivist research philosophy with an objectivist paradigm is assumed. It appears to be the most suitable choice for this study, as a
18
context-only extension replication study aims to capture reality more accurately and generalize previously determined theories and knowledge to different contexts.
The three research questions do all correspond to a positivist research philosophy, as the expected responses can be measured with the gathered data.
3.2 Research Approach
Saunders et al. (2019) suggest that a positivist research approach is typically deductive and quantitative. Deduction aims “to explain causal relationships between concepts and variables” (Saunders et al., 2019, p.154) and therefore researchers “[move] from theory to data” (Saunders et al., 2019, p.154), while in induction researchers move from “data to theory” (Saunders et al., 2019, p.155). Additionally, the approach of abduction exists where both approaches (deduction and induction) are combined and researches use both in their research design.
As it was stated before, the logical research approach for this study is deduction. The study is based on an existing method – the UEQ by Hinderks et al. (2019) – and collects data to validate this method in another context.
3.3 Research Design
In the following sections the research design is described by discussing the research strategy and research space, the research method, the data collection process, the data analysis and the data consistency in detail.
3.3.1 Research Strategy and Research Space
Replication is necessary to understand if an information is an opinion or knowledge (Berthon et al., 2002). According to Berthon et al. (2002), in order to verify research results, they must be repeated. The importance of replication was already stated in 1884 by Kane (1884) and moreover by Rosenthal & Rosnow (1884), who stressed that
19
replicability is fundamental to scientific research. However, paradoxically replication is not normal practice in research (Berthon et al., 2002).
Berthon et al. (2002) state, that especially objectivist researchers have been emphasising the importance of replication studies, as it is an important part of gaining an accurate picture of reality through scientific knowledge. According to Berthon et al. (2002), in this context accuracy is based on validity, “the truth […] of a particular representation of reality” (Berthon et al., 2002, p.418). Furthermore, it depends on reliability, “the constancy of a particular representation over repeated observations” (Berthon et al., 2002, p.418) and also on objectivity, “the extent to which findings are free of bias” (Berthon et al., 2002, p.418). And last, accuracy is based on generalisation, which is “a particular representation across observations in different contexts” (Berthon et al., 2002, p.418).
Berthon et al. (2002) distinguish between pure replication studies, which is defined as a duplication, extension studies and pure generation studies. A pure generation study is conducted, if all parameters of an original study are altered (Berthon et al., 2002). In an extension study some parameters are held constant and others are altered, hence an extension study is a combination of a replication and a pure generation study (Berthon et al., 2002).
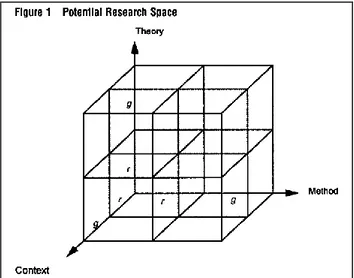
Berthon et al. (2002) propose a framework, in which they define a potential research space for replication and generation studies (see Figure 5).
20
The research space has four dimensions: Problem, Theory, Method and Context (Berthon et al., 2002). While the problem dimension is held constant, the others can be divided into subdimensions depending on the planned research (Berthon et al., 2002). Berthon et al (2002) then categorise all potential research strategies resulting from the research space, which vary in their degrees of freedom. For example, a pure replication study has zero degrees of freedom, while a pure generation study has three degrees of freedom. In between they identify six possible research strategies of extension studies, which have one or two degrees of freedom, depending on how many dimensions are altered from the original study or theory (Berthon et al., 2002).
In the scope of this thesis, a context-only extension, a research strategy with one degree of freedom, is carried out (Berthon et al., 2002). Berthon et al. (2002) state, that the context-only extension “takes an existing theory and method and applies it in a different context” (Berthon et al., 2002, p.423) and that it is a commonly used strategy to evaluate information system user satisfaction.
3.3.2 Research Method
The conducted research method is a quantitative online survey. Saunders et al. (2019) refer to it as a quantitative mono method. Surveys are an important method of data gathering, which can be used to collect quantitative as well as qualitative data (Dawson, 2017). Large amounts of especially quantitative data can be collected using online surveys in a flexible, fast, consistent and inexpensive way (cf. Dawson, 2017; Fielding, Lee & Blank, 2017).
Fielding et al. (2017) emphasize the importance of adjusting the research method and procedure to the research aim and the research questions carefully. As the research aim is the validation of an existing method in a context-only extension study, the method dimension must be held constant and is therefore not varied from the original study by Hinderks et al. (2019). Hence, the standardised user experience questionnaire, UEQ, is used as a template for the online survey, adding the KPI extension.
21
3.3.3 Data Collection
The data collection process is outlined by discussing the survey design and the sampling of the conducted study in the following sections.
3.3.3.1 Survey Design
The questionnaire was designed according to the UEQ and the corresponding KPI extension. Therefore, the online questionnaire consists of 26 items and the additional six items to calculate the KPI. The English version of the UEQ (without the KPI extension) can be found in Appendix 1 as an orientation. The original study of Hinderks et al. (2019) was conducted in Spain, Great Britain and Germany. As only the evaluated product is varied in regard to the original study, it is necessary to conduct the online survey in one of these countries. As Germany is the most accessible target area for the author and considering the scope of this thesis, especially the time limitations, the decision was made to conduct the survey in Germany and therefore in German.
The study was created using LamaPoll, a German company which offers an online software for online surveys. LamaPoll was selected because of its high standards for data security. Hereby, the author made sure, that personalised data was processed on German servers in contrary to other providers, having their servers based in countries outside of the European Union where data protection laws may not be as strict.
The survey is divided into five different pages (for the conducted online survey in German see Appendix 2). First, there is a welcome page with a short explanation about the aim of the study and information about data protection. The data protection standards are in line with the General Data Protection Regulation (GDPR), which is a law of the European Union on data protection and privacy (EU, 2016). The information on data protection on the welcome page includes an explanation about the aim and the scope of this thesis and respondents are informed that they neither need to state their name in order to take part in the study nor do they need to register. Moreover, they are informed that their age and gender will be collected to assure data quality. Last, respondents are informed about their right to request information about data or to have data deleted. The respondent must declare his or her consent before the actual survey begins on page two.
22
On the second page the 26 UEQ items are each stated on a seven-stage scale. Each item consists of two items with opposite meanings (e.g. attractive/unattractive). Laugwitz et al. (2008) divided the items randomly into two groups, one half starts with the positive term and the other half starts with the negative term. This procedure can help to identify unserious responds later during the process of analysis, as the results of one scale should not differ too much from one another in one response. For example, if one respondent rates the product on a seven-stage scale from easy to complicated with a 7, it is suspicious if the same respondent rates confusing to clear with a 6, because it is not plausible that the product is perceived to be complicated and clear at the same time. Moreover, the order of the items is randomised per item, so the scales are not in sequence.
Third, the KPI extension is applied. The respondents are asked to rate how important each scale (Attractiveness, Perspicuity, Efficiency, Dependability, Stimulation and Novelty) is for them when using a product on a one to seven Likert scale from not important at all to very important.
Then, on the fourth page, the respondents are asked to state their gender and age. Last, the respondents arrive on the ending page, where they are thanked for their participation.
The survey was sent to potential Netflix users via different social media channels on the 22nd of April. The survey was closed on the 6th of May after two weeks. The survey respondents are discussed in more detail in the following section.
3.3.3.2 Sampling
The survey was conducted over a timeframe of two weeks and, in total, 186 people visited the webpage of the survey. Out of the 186 visitors 133 started the survey and 116 completed it. Out of the 116 respondents 53,5% are women. Half of the respondents are between 25 and 39 years old, the other half is younger. All respondents are German-speaking and live in Germany at the time of responding to the survey.
23
There were no significant differences in the results between women and men and therefore and because the classification of research results into binary gender categories appears the author to be obsolete, no such differentiation is applied.
3.3.4 Data Analysis
The data gathered in the online survey is analysed in the same way Hinderks et al. (2019) suggest in the original study and how it is recommended by Schrepp (2019) in the UEQ Handbook. In a context-only extension, it is important to keep the data analysis constant in order to end up with comparable results. Otherwise no valid findings can be obtained.
First, the results of the original UEQ items and scales are analysed. In this process the 26 items are first examined individually and the mean values, the variance and the standard deviation per item are taken into consideration. Based on that the results per scale are analysed. Therefore, the mean value, the variance and the confidence interval per scale are analysed. Furthermore, the scales are examined for their reliability. In this context the correlation of items within one scale is calculated and based on this, Chronbach’s alpha is used in order to verify the reliability of each scale. To investigate Netflix’ relative UX, the results are compared to a benchmark data set provided by Schrepp (2019). This allows a better understanding of the UX quality of Netflix in comparison to other products of various types.
Then, the assessed importance per scale is taken into consideration and the mean value and variance per scale are calculated. Furthermore, the actual calculated UEQ KPI value of Netflix is put into perspective using a value range established by Hinderks, Schrepp, Domínguez Mayo, Escalona Cuaresma & Thomaschewski (2018).
Finally, Netflix’ results are compared with the results of Amazon and Skype in the original study. Therefore, the correlation between the mean values of the UEQ results and the assessed importance per scale and per product are compared. A low correlation between these sections is aimed for, as it attests for independent assessments of the 26 UEQ items and the perceived importance. Then, the mean values, assessed importance and the UEQ KPI values of all products are discussed.
24
Throughout the analysis, the most important results are concluded in a table in order to give a comprehensive overview and to clarify the process of answering the research questions.
3.3.5 Data consistency
To ensure the data quality, the surveys responses were checked for inconsistencies. First of all, the data was cleared of all incomplete responses. Then, the remaining data was checked for suspicious responses. The UEQ especially designed to detect random answers. As all 26 items are randomized and half of them starts with the negative and the other half with the positive term, looking at the consistency of a scale can show nonserious responses. An example of this procedure was already explained in section 3.3.3.1. As described before, all 26 items belong to one of the six different scales. If the ratings of items belonging to the same scale differ significantly, it is seen as an indication for suspicious data. A significant difference is defined as at least 3 points between items of the same scale. However, a high rating difference on a scale can also be caused by a misunderstanding of an item. If a respondent does not understand the meaning of an item or has problems to relate it to the product in question, he or she might produce a suspicious answer. Therefore, a response does only classify as suspicious if three or more scales show a significant difference in ratings. The difference is calculated for each scale and are then added up per respondent (for the resulting table see Appendix 3). All in all, there are six respondents showing suspicious data. Hence, the data of the concerned respondents is deleted from the data set. Hence, the remaining sample size is 110.
3.4 Research Quality
In the following sections the research quality is discussed by examining the data reliability and validity and the generalisability.
25
3.4.1 Data reliability and validity
To ensure a high research quality, the data reliability, data validity and generalisability for quantitative research approaches are considered. Mertens, Pugliese & Recker (2017) define reliability as the “extent to which a variable or set of variables is consistent in what it intends to measure” (Mertens et al., 2017, p.49), while validity “describes whether the data collected measure what the researcher set out to measure” (Mertens et al., 2017, p.49).
The UEQ is a well-established standardised questionnaire, which has been tested for its validity and reliability extensively. However, even if the survey construct does not need to be tested for its reliability and validation, the collected data must be examined. For this purpose, the calculated mean, variance and standard deviation values are listed per item and per scale in the results chapter to ensure reliability and validity. Moreover, the Cronbach’s alpha for each scale is taken into consideration and the correlation between the UEQ items and the items of the KPI extension is calculated. As the extension is supposed to be assessed independently by the respondents, a low correlation result between these survey sections ensures a high data quality. Moreover, the content validity was ensured by feedback from the thesis supervisor.
3.4.2 Generalisability
According to Saunders et al. (2019), generalisability can be described as the extent to which the results of a survey can be applied in other contexts (Saunders et al., 2019). Since the applied research strategy is a context-only extension study, one of the aims of this study is to achieve a higher generalisability for the UEQ KPI. The conducted survey is quantitative and therefore the generalisability is in principal higher than for qualitative methods. Moreover, as the UEQ is standardised, the results (excluding the KPI extension) are highly generalisable. A benchmark data set, consisting data from 246 studies with a total of 9,905 respondents for various types of software or web pages, exists and was made available by Schrepp (2019). This benchmark is used to classify the results of the UEQ scales. The KPI extension is then analysed and interpreted more carefully, as it has not been applied nearly as often as the original UEQ. However, this
26
study aims to contribute to the validation and the generalisability of the KPI extension, yet more research with this purpose is needed.
3.5 Research ethics
The American Psychological Association (APA) developed Ethical Principles of Psychologists and Code of Conduct, which includes five general principles: Beneficence and Nonmaleficence, Fidelity and Responsibility, Integrity, Justice and Respect for People’s Rights and Dignity (Ethical Principles of Psychologists and Code of Conduct, 2016). These principles have been respected in all steps of the research process. Potential ethical issues have been thought of early on. When conducting quantitative online surveys, it is especially important to pay attention to the security of personalised data of the respondents. That is why no sensible data is gathered and all responses are handled anonymously and only by the author. Moreover, the collected data is secured by a login.
The term respondent is used consciously instead of subject or participant, as, according to Oliver (2010), the term suggests that someone attends the study voluntarily and had the choice to not respond. Yet it also implies a certain degree of passivity regarding the research operation (Oliver, 2010).
As no second parties are involved in the research process, the author is solely responsible for complying with the ethical standards and the GDPR. It can be assured that ethical issues are given most consideration all throughout the research progress.
27
4.
Results and Analysis
______________________________________________________________________ The purpose of this chapter is to show the research results by illustrating the UX of Netflix in the context of the conducted online survey with regards to the UEQ benchmark and the concrete results of single items and scales. Therefore, the 26 items of the UEQ are considered and the KPI extension is taken into account. Finally, the UX of Netflix is compared to the UX of Amazon and Skype, with a focus on the UEQ KPI in the analysis. This chapter stages as a basis for the following discussion and for evaluating the research aim and answering the research questions.
______________________________________________________________________
4.1 Results and reliability per UEQ scale
In reference to the three research questions, the UX of Netflix is assessed in the following sections. First, the scales are assigned a value between -3 and 3. Therefore, the ratings of the stage scale are altered accordingly. Following, a 1 on the seven-stage scale becomes a -3 if the item started with a negative term. If the item started with a positive term, the 1 becomes a +3. These adjustments are kept throughout the rest of the analysis.
Then, the mean, the variance and the standard deviation of each item is calculated in order to find high deviations, which can indicate that some respondents misinterpreted an item. As can be seen in Table 1, the standard deviation of the items does not appear to be concerningly high. The highest standard deviation can be found for item 23 (organized/cluttered) with a value of 1.6. The item belongs to the scale of Efficiency and has a mean value of 0.5. The expected result of item 23 is therefore in the range of -1.1 and 2.1. The mean values of the other items of the Efficiency scale are 0.9 (for item 22 impractical/practical), 0.6 (item 20 inefficient/efficient) and 1.3 (item 9 fast/slow) with a standard deviation of 1.1, 1.3 and 1.2. Hence, the expected range of values for the Efficiency scale is comparable and the slightly higher standard deviation can be neglected.
Furthermore, the mean values are rated according to the standard interpretation of Schrepp (2019). He states, that mean values below -0.8 are interpreted as a negative evaluation and values above 0.8 as a positive evaluation, while mean values between
-28
0.8 and 0.8 represent a neutral rating. This can be applied to single items or scales. In Table 1 the classification as positive, negative or neutral for each item is indicated by a green, yellow or red arrow next to the calculated mean value in the second column. Table 1
Mean value, variance and standard deviation per item
Item Mean Variance Std. Dev. No. Left Right Scale
1 1,5 1,2 1,1 110 annoying enjoyable Attractiveness
2 2,0 1,0 1,0 110 not understandable understandable Perspicuity
3 0,5 1,3 1,1 110 creative dull Novelty
4 2,0 1,8 1,3 110 easy to learn difficult to learn Perspicuity
5 0,7 1,4 1,2 110 valuable inferior Stimulation
6 1,0 1,2 1,1 110 boring exciting Stimulation
7 1,1 1,3 1,1 110 not interesting interesting Stimulation
8 0,7 1,2 1,1 110 unpredictable predictable Dependability
9 1,3 1,4 1,2 110 fast slow Efficiency
10 0,5 1,5 1,2 110 inventive conventional Novelty
11 0,5 1,5 1,2 110 obstructive supportive Dependability
12 1,5 1,5 1,2 110 good bad Attractiveness
13 2,0 0,9 1,0 110 complicated easy Perspicuity
14 1,1 1,1 1,1 110 unlikable pleasing Attractiveness
15 0,5 1,6 1,2 110 usual leading edge Novelty
16 1,4 0,9 1,0 110 unpleasant pleasant Attractiveness
17 0,8 1,5 1,2 110 secure not secure Dependability
18 -0,4 1,3 1,1 110 motivating demotivating Stimulation
19 1,0 1,5 1,2 110 meets expectations does not meet expectations Dependability
20 0,6 1,8 1,3 110 inefficient efficient Efficiency
21 1,2 2,0 1,4 110 clear confusing Perspicuity
22 0,9 1,2 1,1 110 impractical practical Efficiency
23 0,5 2,7 1,6 110 organized cluttered Efficiency
24 1,1 1,0 1,0 110 attractive unattractive Attractiveness
25 1,0 1,2 1,1 110 friendly unfriendly Attractiveness
26 0,9 0,9 0,9 110 conservative innovative Novelty
Note. List of all items, the calculated values and the corresponding scale.
The only item showing a negative mean is item 18 (motivating/demotivating) with a value of -0.4. All other items have a mean value in the range of 0.5 to 2.0. According to Schrepp (2019), the results range from -3 (extremely bad) to +3 (extremely good), however it is unlikely to encounter such extreme values when calculating the mean value of an item or scale. Respondents have different opinions and priorities, which leads to differing answers (cf. Schrepp, 2019). Therefore, Schrepp (2019) states, that it is highly uncommon to encounter a mean value above 2.0 or below -2.0. In Table 1 can be seen, that item 2 (not understandable/understandable), item 4 (easy to learn/difficult to learn) and item 13 (complicated/easy) show a mean value of 2.0. This is an extremely
29
high rating and as these items all belong to the Perspicuity scale, it can be concluded that Netflix has a high perceived level of Perspicuity.
In addition to the calculated values in Table 1, the distribution of the answers per item are illustrated in Appendix 4 as an additional visualisation.
After inspecting single items, the results of the six scales are considered. In Table 2 the mean value and variance of each scale are listed.
Table 2
Mean value and variance per UEQ scale
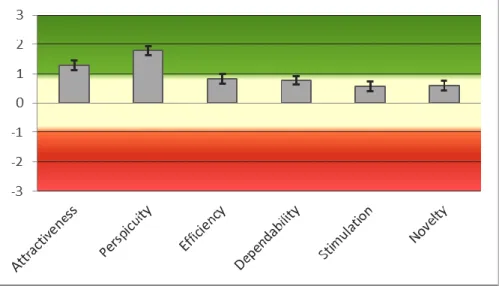
Attractiveness 1,273 0,73 Perspicuity 1,789 0,71 Efficiency 0,827 0,81 Dependability 0,768 0,49 Stimulation 0,580 0,72 Novelty 0,589 0,73
UEQ Scales (Mean and Variance)
According to Schrepp’s (2019) interpretation, half of the scales can be evaluated as being perceived positively (Attractiveness, Perspicuity and Efficiency) and the other half can be interpreted as being perceived neutrally (Dependability, Stimulation and Novelty).
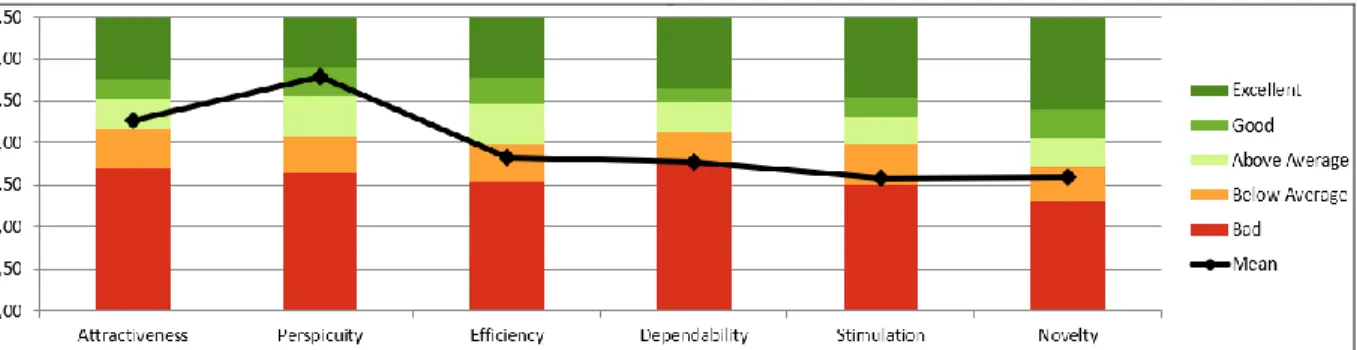
Figure 6. Mean value and confidence interval per scale, adapted from Schrepp (2019, p.5).
30
This interpretation is illustrated in Figure 6. It shows the mean values per scale and the corresponding confidence interval. It visualizes that Perspicuity is perceived as extremely positive, as it was already concluded when the single items were considered. Three of the four items show a mean value of 2.0, which is very high and the fourth one has a mean value of 1.2, which is still significantly above the threshold of 0.8 (cf. Table 1).
The mean value of the Attractiveness scale is also clearly above the threshold value of 0.8, also taking the corresponding variance into consideration. The six items of the Attractiveness scale have mean values of 1.5, 1.5, 1.1, 1.4, 1.1 and 1.0, confirming the perceived positive Attractiveness mean value.
The Efficiency scale’s mean value only barely surpasses the threshold value with 0.827. The Efficiency scale does also have the highest overall variance with a value of 0.81, which is conclusive as one of the single items has shown the highest standard deviation and variance of all items (cf. Table 1). In sum, the Efficiency scale is perceived rather positively, but as the threshold value for the mean is only surpassed by 0.027 points and the variance is in comparison the highest, the classification as a positively perceived scale must be regarded with caution.
The mean value of the Dependability scale is with 0.768 close to the Efficiency mean value and is also close to the 0.8 threshold value (cf. Figure 6). The four items of the Dependability scale have mean values between 0.5 and 1.0 with a relatively low variance and standard deviation. Hence, the variance of the Dependability scale is the lowest of all scales with a value of 0.49. Therefore, it can be concluded that the expected value on the Dependability scale is rather close to the threshold value and the all over result of the scale is a neutral perception but on the brink to a positive one. The means of the Stimulation and the Novelty scale (which represent the hedonic qualities) are practically identical with values of 0.580 and 0.589. The difference between the variance values of 0.72 and 0.73 is also marginal.
Only when considering the single items of each scale, differences occur. While the results of the items of the Novelty scale are very consistent as the mean values range between 0.5 and 0.9, the mean values of the Stimulation scale are more scattered and range from -0.4 to 1.1 (cf. Table 1).
31
It can be concluded that the respondents perceive the Novelty of Netflix as neutral and are consistent in their evaluation, while the Stimulation of Netflix is perceived as neutral too, yet the respondents have varying opinions on the single items. Some two items of the Stimulation scale are perceived as positive (item 6 boring/exiting and item 7 not interesting/interesting) while the other two are perceived as neutral (item 5 valuable/inferior and item 18 motivating/demotivating) and, as already stated before, item 18 received the worst evaluation with a mean value of -0.4.
To confirm the results the confidence intervals for each scale are calculated as stated in Table 3. The confidence interval is calculated based on the scale mean, the standard deviation, the sample size and a value Z, based on the assumed probability alpha that our calculated confidence interval does not include the actual value. With an alpha of 0.05, meaning 5%, the following confidence intervals (around the mean value) are calculated.
Table 3
Confidence interval per scale
Scale Mean Std. Dev. N Confidence
Attractiveness 1,273 0,853 110 0,159 1,113 1,432 Perspicuity 1,789 0,843 110 0,157 1,631 1,946 Efficiency 0,827 0,902 110 0,169 0,659 0,996 Dependability 0,768 0,698 110 0,130 0,638 0,899 Stimulation 0,580 0,850 110 0,159 0,421 0,738 Novelty 0,589 0,856 110 0,160 0,429 0,749
Confidence intervals (p=0.05) per scale
Confidence interval
Note. The confidence intervals are calculated per scale based on the mean, standard deviation, sample size and alpha.
As anticipated, the confidence interval for the Efficiency scale is the largest, while the Dependability scale has the smallest confidence interval. This corresponds to the previous results. The confidence intervals are also shown in Figure 6 as an error bar. Moreover, the consistency of the scales is examined by calculating the correlation of each item of the same scale with another. Items within one scale are expected to have a high correlation and based on these values, the Cronbach’s alpha coefficient is calculated. Cronbach’s alpha was introduced in 1951 by Cronbach and is a commonly