A study in understanding commuting in the context of shopping
Commuter Shopping
Paper within Bachelor Thesis in Business Administration
Author: Åsa Andersson 920126
Sara Skoog 890127
Johanna Svensson 910514
Acknowledgements
We would like to acknowledge the people who, in some way, have been involved in the making of our bachelor thesis. They have helped us to reach the research purpose and finally get a full completion of the study, for which we are very thankful.
Firstly, we would like to give thanks to our supervisor Erika Arevalo at Jönköping International Business School, for guiding us in the right direction and helping us to find the topic that would be the core in our thesis. Secondly, we would like to thank the rest of the members of our seminar group for their participation, guidance and feedback throughout the entire process. We are also grateful for all the respondents who were kind enough to answer the survey.
Finally, we would also like to give our sincere thanks to Kristoffer Krantz at Newsec, who has been a true help and inspiration. He has shown unquestionable support and has contributed to an interesting cooperation.
Åsa Andersson Sara Skoog
Johanna Svensson
Bachelor Thesis in Business Administration
Title: Commuter Shopping – A study in understanding commuting
in the context of shopping
Authors: Åsa Andersson, Sara Skoog, Johanna Svensson
Tutor: Erika Arevalo
Date: 2014-05-12
Subject terms: Commuting, Shopping malls, Branding, Commuter shopping
Abstract
Background
For ages people have commuted to work, or to other activities, located outside their home municipality. Statements found indicate that the basic decision for commuting are based on utility maximisation and no matter what the character of the benefit is; it should be higher than what can be found closer to the home location. This thesis aims to investigate if people are also commuting with the purpose of obtaining benefits from shopping.
The shopping location will in this thesis be defined as a shopping mall. In order for shopping malls to attract customers and create awareness of which benefits they offer they must engage in branding. The authors of this thesis have chosen to investigate the terms; shopping, commuting and branding separately in order to find a definition for the term commuter shopping and to create understanding for what makes people engage in commuter shopping.
Purpose
The purpose of this thesis is to understand how the term commuter can be translated into the context of shopping. Moreover, the goal is also to identify the reasons for why people are willing to commute to a shopping destination not closest to their home location. The authors will also provide a definition for the term commuter shopping.
Method
In order to fulfil the purpose of this thesis, an abductive research approach was used. This includes a mixed method research, which allows both qualitative and quantitative data to be represented. The quantitative data in this research consist of a survey conducted at a shopping mall in Jönköping called A6 Center and used a sample of 402 customers as respondents. The qualitative part of the research includes an interview with A6 Center’s Centre Manager Kristoffer Krantz.
The main source of information, however, is the collection of secondary data within the fields of commuting, shopping malls and branding which are combined in order to provide a definition of commuter shopping.
Conclusion
The study contributes with understanding in the fields of research to the extent that means one can translate the term commuting into the context of shopping. Moreover, the thesis managed to identify the reasons for why people engage in commuter shopping and which attributes they value at a shopping location. As a result the thesis propose a definition: “Commuter shopping is when one or more people go to a shopping location, not closest to their home location, in order to obtain benefits satisfied by attributes offered.”
Table of Contents
1
Introduction ... 1
1.1 Important concepts ... 2
1.2 Thesis outline ... 3
2
Problem Discussion ... 4
3
Purpose and research questions ... 6
3.1 Delimitations ... 6
4
Methodology ... 7
4.1 Research design... 7
4.1.1 Research approaches ... 7
4.1.2 Qualitative and quantitative research ... 8
4.2 The sampling design process ... 10
4.2.1 Define the target population ... 11
4.2.2 Determine the sampling frame ... 12
4.2.3 Select a sampling technique ... 12
4.2.3.1 Convenience sampling ... 13
4.2.3.2 Judgmental sampling ... 13
4.2.3.3 Quota sampling ... 14
4.2.4 Determine the sample size ... 14
4.2.5 Execute the sampling process ... 15
4.3 Information sources ... 15
4.4 Methods of data collection ... 17
4.5 Data collection ... 18 4.5.1 Primary data ... 18 4.5.1.1 Structure of survey ... 20 4.5.2 Secondary data ... 21 4.6 Data analysis ... 21 4.6.1 SurveyMonkey ... 21 4.6.2 Frequency distribution ... 22 4.6.3 Cross-tabulation ... 22 4.6.4 Chi-Square ... 23 4.6.5 Cramer's V ... 23
5
Frame of reference ... 24
5.1 Commuting ... 24 5.2 Shopping malls ... 25 5.3 Branding ... 28 5.3.1 Affecting factors ... 326
Empirical Findings ... 34
6.1 Frequency distribution ... 34 6.1.1 Structure ... 346.1.2 Demographics of the research ... 34
6.1.3 Geographics ... 35
6.1.4 Attributes customers do value ... 36
6.1.5 Perception of A6 Center ... 37
7
Analysis ... 41
7.1 Survey ... 41
7.2 Statistics ... 45
7.2.1 Geographics – Attributes (Chi-Square) ... 45
7.2.2 Geographics – Attributes (Cramer’s V) ... 47
7.2.3 Gender – Attributes (Chi-Square) ... 48
7.2.4 Gender – Attributes (Cramer’s V) ... 50
7.2.5 Age – Attributes (Chi-Square) ... 51
7.3 Commuter shopping ... 52
7.3.1 Attributes ... 52
7.3.1.1 Interpretation of remaining attributes ... 55
7.4 Conclusion of analysis ... 56
8
Conclusion ... 57
8.1 Research question 1 ... 57 8.2 Research question 2 ... 57 8.3 Definition ... 589
Discussion ... 58
9.1 Suggestions for further research ... 60
10
References ... 61
Appendix 1 ... 63
Figures
Figure 4.1 - Population, sample and individual cases. (Saunders et al., 2012) 10
Figure 4.2 - The sampling design process. (Malhotra, 2004) ... 11
Figure 5.1 - Five mall image dimensions. (Chebat et al., 2010) ... 31
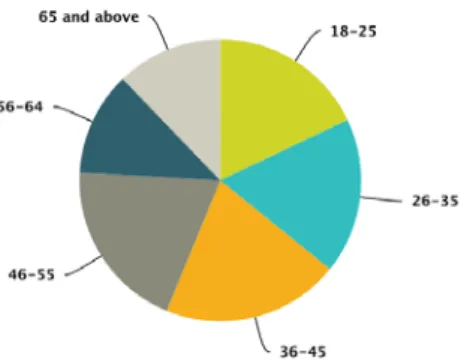
Figure 6.1 - Age distribution ... 35
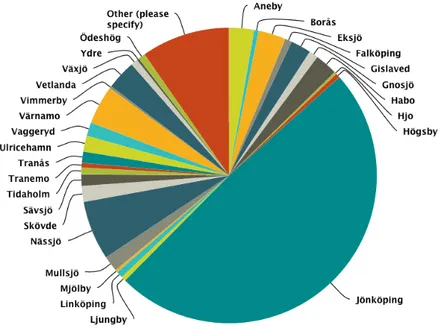
Figure 6.2 - Municipalities ... 36
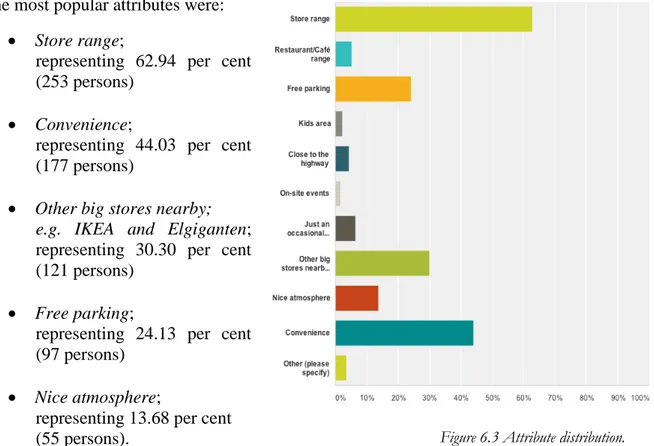
Figure 6.3 - Attribute distribution ... 37
Figure 6.4 - How do you know about A6 Center?... 38
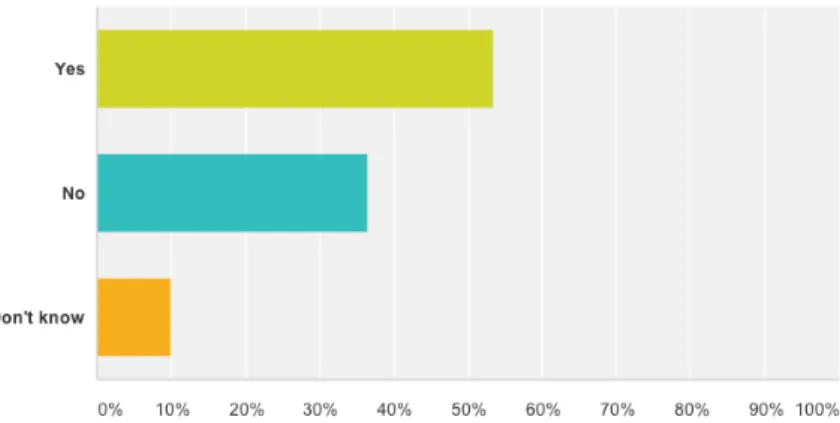
Figure 6.5 - Do you notice A6 Center's target group? ... 38
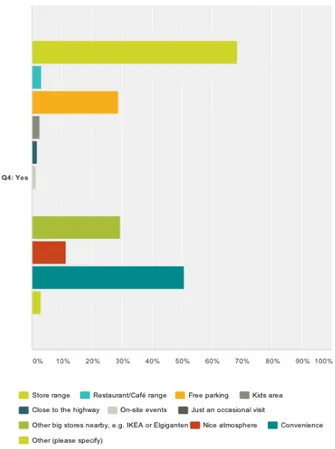
Figure 7.1 - Attribute distribution (YES) ... 46
Figure 7.2 - Attribute distribution (NO) ... 46
Figure 7.3 - Gender & Attributes (FEMALE) ... 50
Figure 7.4 - Gender & Attributes (MALE) ... 50
Tables
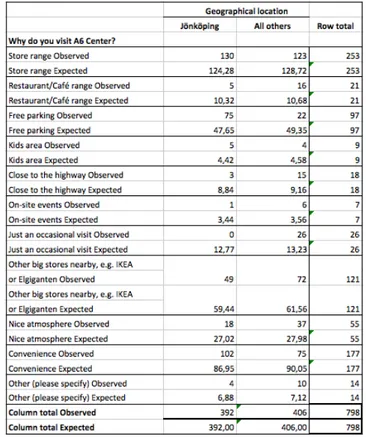
Table 4.1 - Search Parameters ... 16Table 7.1 - Cross-tab Geographics - Attributes ... 45
Table 7.2 - Chi-Square & Cramer's V Geographics - Attributes ... 48
Table 7.3 - Cross-tab Gender - Attributes ... 49
Table 7.4 - Chi-Square & Cramer's V Gender - Attributes ... 50
Table 7.5 - Cross-tab Age - Attributes ... 51
1 Introduction
The first section provides the reader with general information about the topic of the thesis. Furthermore, definitions and keywords will be explained and the structure of the thesis and its headings will be presented to facilitate for the reader.
Since ages people have commuted to work, or to other activities, located outside their home municipality. From the very beginning it was an effect of societies being industrialised and job opportunities moved to larger cities where the industries grew. Goods and services were concentrated to the cities, so if people did not move there, they had to commute in order to get what they needed (Magnusson, 2010).
In today’s society commuting is referred to when people have to make some kind of journey outside their home municipality to their work place on a regular basis (Eliasson, Westerlund, & Åström, 2007). However, since new trends in goods, services and technology are becoming more evident it is not surprising that news of these new goods or services travel fast. This means that they are not yet available everywhere, which contributes to that people simply go to where they can be found (Magnusson, 2010; Stock, 2011).
Basic decisions for commuting depend on a number of factors, such as increased options (Torége, Sandgren, Olander, & Thulin, 2008). Other statements indicate that reasons for commuting are based on utility maximisation, e.g. the benefit of commuting can be determined by material and immaterial factors. No matter the character of the benefit, it should be higher than what can be found closer to the home location (Eliasson et al., 2007).
This thesis deals with the term commuting, but not in the context of travelling to work on a regular basis, but in the context of commuter shopping – people who travel to a location further from home to shop on a regular basis.
In relation to the statement mentioned above, which indicates that people commute because it generates increased options, can be related to the term commuter shopping. Today, people are more aware of options they have and they also have higher demands and expectations on retailers and manufacturers to provide the product and services they desire (Stock, 2011).
The definition of a shopping location is in this thesis a shopping mall. The authors have been in contact with Kristoffer Krantz at Newsec Asset Management AB, the company that administrates and develops a shopping mall in Jönköping called A6 Center. This cooperation has given an insight on the work devoted by shopping malls to attract customers, local and regional. Moreover, some of the research has been conducted based on the customers of A6 Center.
Today there is a limited amount of research available on the subject of commuter shopping. Since the authors try to define this term, they chose to research the terms: shopping malls, commuting and branding of malls separately and then try to combine them in a shared context in order to answer the stated research questions.
1.1 Important concepts
To provide the reader of this thesis with further understanding of the topic the authors choose to include a section where fundamental terms and concepts are explained.
The thesis deals with different terms and tries to combine them with the term commuting and then define the term commuter shopping. The main terms and concepts are; shopping mall, catchment area, branding, brand image, commuting, commuter shopping, commuting shopper and customer.
A shopping mall is when one or more buildings form a complex of stores (Dawson, 1983). A shopping mall has a catchment area from where they aim to attract customers. The definition of a catchment area is the geographical area from where a shopping mall (or other business) attracts visitors and/or customers (K. Krantz, personal communication, 2014-04-01). Throughout this thesis the shopping mall is the definition of a shopping location or shopping destination.
A brand can be defined as; “A name, term, sign, symbol or design, or a combination of these that identifies the goods or services of one seller or group of sellers and differentiates them from those of competitors” (Kotler, Wong, Saunders & Armstrong, 2008, p.511). The term branding is important to have understanding of in this thesis since it is used by shopping malls in the work to attract customers. In order for people to consider doing their shopping in a shopping mall not closest to their home location the
mall has to offer benefits that closer located malls cannot. Therefore, it is important for shopping malls to continuously work to increase the strength of its brand in order to fit the customers’ preferences. The customers’ perception of the brand is known as brand image (Kotler et al., 2008).
Commuting is a term often referred to when people travel to work on a regular basis, and the work place is not the closest one to the home location. Generally speaking, when people travel to a location, any location for any reason, on a regular basis it should offer some benefit that cannot be found closer to home (Eliasson et al., 2007). Commuter shopping is the term the authors of this thesis are investigating. The definition is people who travel to a shopping destination, which is not the closest one to the home location. A person who engages in commuter shopping is a commuting shopper.
The term customer is also used, and refers to a more general description. Any person who uses a shopping mall’s services, is not necessary a paying customer since it is possible to enter a shopping mall without paying if the person is just having a look. Or, if a shopping mall has free WI-FI or free parking, the customer uses them but does not pay. Therefore, any person visiting a shopping mall is per definition a customer.
1.2 Thesis outline
• Section 2 discuss the problem statement of the thesis and is followed by the research questions created to help obtain the purpose.
• Section 3 is a statement of the purpose. It was given an own section in order to be highlighted.
• Section 4 describes the theory used to create the survey questions and alternatives.
• Section 5 includes a description of the methodology and method used throughout the thesis. It describes the research design, the research approach, and methods of data collection as well as the sources used to search for it.
• Section 6 is where relevant previous research is presented. It includes earlier studies regarding commuting, shopping, shopping malls and branding. This is for the purpose of putting them all together into the topic of commuter shopping. • Section 7 presents the obtained empirical findings from the survey conducted. • Section 8 is the part where the results from the research on previous studies will
be interpreted into the joint context of commuter shopping as well as compared to the empirical findings.
• Section 9 is where the conclusions will be presented. This is the conclusions related to the purpose and will give answers to the present research questions. • Section 10 includes the authors’ own speculative thoughts on the findings, as
well as suggestions for further research within the field.
2 Problem Discussion
This section is a discussion of the current problem and will make it clear for the reader why this topic deserves to be researched.
Commuting is a well-known term, mostly referring to people’s journey to work. People travel to work on a regular basis, because working in another location can offer them better career opportunities, e.g. higher salary and possibility to climb the career ladder, or a broader choice of work opportunities. The term commuting, except to work, is referring to the decision to travel to another location on a regular basis in order to find something that cannot be found closer to home. Whether it is work or shopping, the location should offer a benefit that will reward the commuter to make the journey worth it (Eliasson et al., 2007).
Today, there is an increased awareness of consumer power and there is also an increase in customer options. Customers can choose from where and how they buy goods or services. Therefore, more effort has been put in to understand peoples shopping decisions, on which goods or services to buy (Stock, 2011).
In this thesis, a shopping location will be defined as a shopping mall. Developers of shopping malls constantly face the challenge of being a trademark, but at the same time represent other brands. For shopping malls, it is very important to choose the right tenants (stores/brands), which clearly contribute to the overall impression of the shopping mall.
The developers of shopping malls are also facing the challenge of trying to reach customers not only locally but also from a larger region. According to previous studies made by A6 Center there is a trend of an increasing amount of visitors commuting to the shopping mall from outside Jönköping municipality (Höstenkät A6 Center, 2013). The observation of this trend contributes to the interestingness of the topic.
Today many different shopping malls and the surroundings look very similar. Given this, and that many people nowadays have more than one regional shopping mall within a reasonable driving distance, they should tend to primarily shop in the mall closest to their home location (Burns & Warren, 1995).
On the other hand, increased awareness of the importance of branding and image in the shopping mall industry makes Burns and Warren’s statement questionable, since people nowadays consider more than simply driving distance when choosing shopping destination (De Juan, 2004).
If people commute because of increased benefits (Eliasson et al., 2007), such as increased choice of goods or services or simply a different supply, shopping malls must be able to capture this opportunity and provide those benefits. Shopping malls should strive to trigger the economic and/or the social factors that will ultimately drive the customer to make the decision to go there. If the person is a commuting shopper, the benefits compared to another location will have won.
Currently there is a lack of research made on the subject of what the authors have chosen to call commuter shopping. Commuter shopping is a term embracing shopping made by customers that for different reasons choose to go to a shopping destination that is not closest to their home location. Customers’ eagerness to possess new products, the increased awareness among customers’ to use their power and the constant work made by shopping malls to attract and offer benefits to customers in combination with the
term commuting will be the base in this thesis in the work of defining the term commuter shopping.
The authors of this thesis try to define the term of commuter shopping and investigate the reason or reasons why people are engaged in it.
3 Purpose and research questions
The purpose of this thesis is to find evidence for how the term commuter can be translated into the context of shopping. Moreover, the goal is also to identify the reasons for why people are willing to commute to a shopping destination not closest to their home location. The authors will also provide a definition for the term commuter shopping.
In order to fulfil the purpose, focus will lie on answering the following research questions:
• How can the term commuter be applied in the context of shopping? • Which attributes motivate people to engage in commuter shopping?
3.1 Delimitations
The survey conducted in this study is focused on A6 Center’s customers, which leads to the results being related to A6 Center and can therefore not be used as a general view of shopping malls. However, the survey is only used to get understanding for the second research question, which is about the attributes. The research on how to understand commuting in the context of shopping is not biased towards A6 Center and its customers.
The researchers are confident that the survey was constructed in the best possible way. The design of the survey, and the number of questions, meant that the survey was as smooth as possible for the respondents. More questions in the survey would perhaps meant that the researchers would have gained more information, but the purpose of the survey was merely to find which attributes the customers of A6 center value, and therefore they chose to have a fewer number of questions.
Moreover, the researchers instead focused on cross-tabbing the results rather than gathering more information.
4 Methodology
In this section the methodology for the thesis is presented. This includes the choice of research approach and a description of the research design. The research design is described by the sampling design process. Furthermore methods of data collection and analysis of data will be presented. Combined, all sections will provide the reader with an overview of the methodology of the thesis where each approach is presented and argued for.
4.1 Research design
The research design is the general plan of how to be able to answer the research questions. This includes specifying the sources from which data will be collected, how one intend to collect and analyse these, as well as identifying possible constraints such as access to data, time and location (Saunders, Lewis & Thornhill, 2012). A description of the research design for this thesis is provided in the following section.
4.1.1 Research approaches
Saunders et al. (2012) states that there are two main research approaches when completing a study, namely the deductive approach and the inductive approach. Which one to use is based upon the extent to which the authors are clear about the theory in the beginning of the research.
The deductive approach occurs when the conclusion is derived logically from a set of premises, like hypothesis. Ketokivi and Mantere (2010) mean that the conclusion is held true when all the premises are true (cited in Saunders et al., 2012). This approach is suitable when researchers can take advantage of much literature on the topic and thereby enables hypothesis testing and construction of frameworks to use. One can describe the deductive approach as it goes from theory to data.
In contrast to this, the inductive approach emphasises a gap in the logic argument between the conclusion and the premises examined. This means that one does not know if the conclusions really are true even if it is supported by the observations. The inductive approach is preferred when the research is conducted within a field that is not
yet much explored. Here, the researchers aim to explore data by starting with the data and from there create a theory (Saunders et al., 2012).
According to Easterby-Smith (2008) it is more common to work with qualitative data when using the inductive approach (cited in Saunders et al., 2012). But since this research primarily aims to create understanding of a phenomenon and not to test hypothesis it first seemed to be more useful than a deductive approach even if a quantitative method would be used. The choice of making qualitative or quantitative research will be discussed in the following section.
However, if neither of these two main approaches is perfectly suitable, there is an option to use an abductive approach, which could be described as a combination of the two approaches mentioned above (Saunders et al., 2012). This approach allows a movement back and forth between data and theory. It explores phenomena in means of data and patterns are identified and then new theories are created as well as existing theories could be modified into the present context. Saunders et al. (2012) state that the abductive approach is suitable when there is much research made within one context, but less research made within the context in which the present research is conducted.
This thesis makes use of existing theories regarding commuting, shopping malls and the branding of them in order to explore and combine these in a new framework. As mentioned previously, Saunders et al. (2012) suggest collecting data from contexts where much literature exist and merge them together and modify them into a new context when that is suitable for the purpose. Therefore, in order to answer research questions an abductive approach seemed to be most appropriate in this case.
4.1.2 Qualitative and quantitative research
A basic way to distinguish between qualitative and quantitative research is to divide the data into numeric, for quantitative, and non-numeric, for qualitative, data. Quantitative research is thereby often connected with questionnaires and graphs or statistics, while qualitative is a synonym for in-depth data collection, like interviews (Saunders et al., 2012).
This thesis makes use of a questionnaire (survey), which mainly belongs to quantitative research. However, the data collected is rather based on opinions than on facts, and this could be referred to as qualitative information. Therefore, the survey is a combination of
qualitative and quantitative methods. Moreover, personal conversations with the Center Manager of A6 Center were administrated, which is more of a qualitative character. One of two main reasons for rejecting a pure qualitative research was the limited amount of time available. Constructing, executing and coding in-depth interviews are very time-consuming and due to the fact that more than one interview could be useful in order to obtain un-biased information, this kind of interviews were not a proper alternative.
However, focus-group interviews were considered with the purpose of collecting information from more than one person at a time, but analysing the results from that kind of conversations would also be unnecessarily time-consuming and maybe hard to interpret. Thereby, the authors concluded that this method would be too costly in relation to possible results gained.
During discussions about how to execute the primary data collection of this thesis the authors ended up with the decision of prioritising the possibility to draw more general conclusions around the topic and research questions. This was the second reason for why qualitative methods were rejected in favour of a survey of quantitative kind.
An approach like this is similar to a mixed method research, where both quantitative and qualitative research is combined (Saunders et al., 2012). Johnson and Onwuegbuzie (2004) explain the mixed method research as a type of study where the researcher combines qualitative and quantitative methods, techniques, approaches and concepts in a single study, which is the case in the present one.
Moreover, Creswell and Plano Clark (2007) describe a type called sequential mixed method research as an approach involving more than one phase of data collection. In this approach one method is followed by another one in order to expand or elaborate the initial set of findings (cited in Saunders et al., 2012).
With this combination in mind it was possible to execute a survey with the purpose of collecting general perceptions about the subject followed by an interview. The aim with the interview was to receive valuable input through a qualitative method, which could not be obtained by the use of the quantitative method chosen.
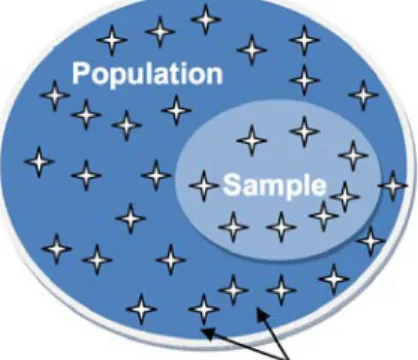
Figure 4.1 Population, sample and individual cases. (Saunders et al., 2012, p. 259).
Moreover, Johnson and Onwuegbuzie (2004) discuss the importance of being able to combine both qualitative and quantitative methods while conducting research and that both of them are useful and important. Depending on the context, developing a suitable mixed research method can provide the study with good insights from both qualitative and quantitative research that fit the current purpose (Johnson & Onwuegbuzie, 2004). This was something that the authors of this thesis could take advantage of since they recognised a need for both approaches which was also in line with the choice of making use of an abductive research approach.
Additionally, mixed method research is a way to provide a better product and end result instead of researchers being restricted towards certain methods to use (Johnson & Onwuegbuzie, 2004). Therefore, this thesis makes use of both qualitative and quantitative approaches in order to obtain more appropriate answers to current research questions. It also contributes to the opportunity to use strengths of one approach in order to overcome weaknesses by another.
However, a mixed method approach is described to be more time-consuming than choosing one single approach (Johnson & Onwuegbuzie, 2004), but since time was already limited and restricted the authors from conducting very extensive research by any single approach, mixed method research could still be executed in order to obtain reliable answers to the stated research questions.
4.2 The sampling design process
Quantitative research is mainly analysed through numbers and statistics (Malhotra, 2004). When working with this kind of study it is
of importance to be familiar with the concepts population, element and sample.
Saunders et al. (2012) defines the population as “The full set of cases from which a sample is taken” (p. 260). This means the total number of elements, in this case people, with the right characteristics to participate in the research. Each
possible person is equal to an element or case.
For large populations it is impractical, too costly as well as too time-consuming, to investigate all possible elements. Therefore one needs to draw a sample that will represent the population of interest (Saunders et al., 2012).
A sample is a subgroup of the population selected for participation in a certain study. Budget and time limits are constraints favouring the use of a sample. If the whole population is chosen it is called census (Malhotra, 2004).
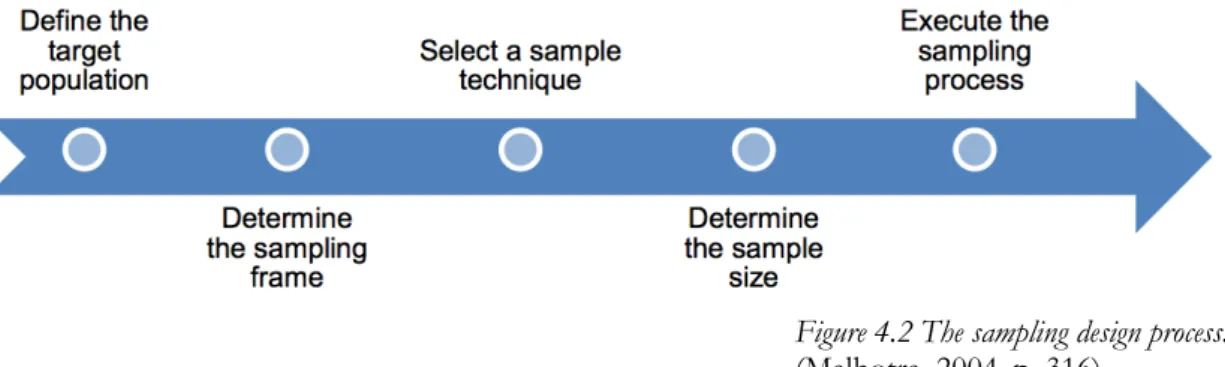
Malhotra (2004) presents a five-step model which is useful to describe sampling design processes. Therefore, that model is used in this thesis to explain the current sampling design process. The figure below shows the five main components of the model and how the sampling process proceeds sequentially. In the following section each step will be explained in more detail.
4.2.1 Define the target population
To be able to complete a survey through a quantitative approach it is necessary to define the population to focus on. The target population can be defined as “The collection of elements or objects that possess the information sought by the researcher and about which inferences are to be made” (Malhotra, 2004, p. 315). This is about which people will be included in the research as sufficient respondents in order to answer research questions.
In this thesis the target population consist of people above 18 years old who go to A6 Center to shop. Both local and commuting customers are included. The choice to use the customers of A6 Center in particular was mainly because of convenience, since it is a shopping destination close to the authors home and study location. However, people
Figure 4.2 The sampling design process. (Malhotra, 2004, p. 316).
under the age of 18 were excluded based on the following quotes from ESOMAR World research codes & guidelines - Interviewing children and young people (2009).
• "The welfare of the children and young people themselves is the overriding consideration..."
• "The parents or anyone acting as the guardian of any child or young person taking part in a research project must be confident that the latter's safety, rights and interests are being fully safeguarded".
• "The interviewers and other researchers involved in the project must be protected against any misunderstandings or possible allegations of misconduct arising from their dealings with the children or young people taking part in the project".
• "The authorities and the public generally, must be confident that all research carried out with children and young people, is conducted to the highest ethical standards and that there can be no question of any possible abuse of the children and young people involved".
4.2.2 Determine the sampling frame
The purpose of a sampling frame is to ease the possibility to identify the different elements in the target population. A sampling frame could be a map or a provided list with e-mail addresses or telephone numbers (Malhotra, 2004). During this research it was not possible to get access to any form of customer information, since A6 Center does not collect any data of that kind. Therefore no sampling frame could be presented in this case. However, this was not of major importance since it is usual within business research, especially in market surveys, that one does not have any sampling frame (Saunders et al., 2012).
4.2.3 Select a sampling technique
The various sampling techniques available can be divided into two main types, namely probability and non-probability sampling (Saunders et al., 2012). It is important to decide which of the sampling techniques to use throughout a research process (Malhotra, 2004).
Simple, systematic, stratified and cluster sampling are examples of probability samples. With these techniques the probability for each element in the population to be selected is equal (Saunders et. al., 2012). In other words, the sampling units are selected completely by chance (Malhotra, 2004).
When using non-probability samples it is possible for the researcher to select sample elements by personal judgements (Malhotra, 2004). Quota, purposive, volunteer and convenience sampling are examples of non-probability techniques. By these, the probability of each element being selected is different and unknown. Thereby it is also impossible to make statistical conclusions from the population as a whole. However, it is important to remember that it is still possible to generalise about the population from non-probability samples, but not on statistical grounds (Saunders et al., 2012).
When there is no sampling frame available, it is not possible to do any form of random sampling. The sample must then be selected on another basis (Saunders et al., 2012). The options that remain are all non-probability sampling techniques. Three of them are explained below.
4.2.3.1 Convenience sampling
One form of non-probability sampling is the convenience sampling. The elements in the sample are selected by the interviewer on the basis that the respondent happens to be in the right place at the right time. This is the least costly and least time-consuming of the sampling techniques. A big advantage is that the sampling units are easy to access and easy to measure.
However, there are also limitations with this technique. For example, the study has the potential of being biased since people can choose themselves whether to respond to the survey or not. Thereby, there will only be answers from a certain kind of people willing to respond (Malhotra, 2004).
4.2.3.2 Judgmental sampling
Judgmental sampling is a variant of convenience sampling. Accordingly, the researcher chooses which units to include in the sample, but more consciously than on just a convenient basis. The researcher make choices relying on that the units chosen are appropriate to represent the population (Malthotra, 2004).
In this research, the authors purposely excluded people under the age of 18 years due to legal and ethical issues, as mentioned previously. Except from that, all men and women of all ages and cultures were included and asked to participate. It was of great importance to receive respondents representing all kinds of characteristics within the population.
4.2.3.3 Quota sampling
Quota sampling is an extension of the judgmental sampling technique. It is a two stage approach where the population elements first are divided into control categories, called quotas. The research then includes respondents from quotas proportionally representing the whole population (Malhotra, 2004). For example, if the population consists of 60 per cent women, the sample will also consist of 60 per cent women. The quotas could be with respect to for example gender, age and race (Malhotra, 2004).
Using quota sampling appropriately could be very time consuming and was presumably not even possible due to lack of sampling frame during this thesis. Therefore a judgmental sampling technique has been used. According to Jacobsen (2002), going into a shopping mall asking people to respond to a survey, as in this case, is convenience sampling.
However, that is based on that the researchers use convenience as the only factor of choice and not involve any consciousness. With that in mind, the judgmental technique still was the most adequate method.
4.2.4 Determine the sample size
Malhotra (2004) argues the importance of deciding how many elements of the population that will be included in the study, in other words, the size of the sample. Before conducting the survey in this research it was hard to foresee peoples’ willingness to respond. Moreover, this contributed to difficulties in assigning time to spend at A6 Center collecting answers.
A sample between 400 and 600 units is in general sufficient for drawing general conclusions. This is independent of the size of the population (Jacobsen, 2002). With this as a base, a minimum of 400 respondents was the objective for this study. This was reached within a reasonable time frame. The strategy was to ask people to participate in the survey until a minimum of 400 answers was reached.
4.2.5 Execute the sampling process
In order to execute the sampling process a specification of the previous parts of the sampling design process model must be compiled (Malhotra, 2004). This includes a description of the population, sampling frame, sampling technique and sample size. Furthermore, Malhotra (2004) also emphasize the importance of how the researchers will proceed if people chosen to be included in the sample refuse to respond.
In this study the target population was identified as all people above 18 years who go to A6 Center, and is per definition seen as a customer. Both local and commuting customers were of interest and therefore all its customers were included. The sample in this study is every approached customer, no matter if they responded or not to the survey. Instead of deciding a sample size the authors aimed at 400 responses in total. This is due to the difficultness of knowing the customers willingness to respond and therefore hard to decide a desired response rate. Since the authors did not count how many approached customers were unwilling to answer no response rate is available for this survey.
As mentioned previously the demand for participants above the age of 18 occurred because of legal and ethical issues. If people turned out to be unwilling to respond to the survey, the researchers planned to assign enough time at A6 Center in order to reach the 400 responses demanded.
Since Newsec have carried out surveys among A6 Center’s customers before using the same method as in this research, with a good result and response rate (K. Krantz, personal communication, 2014-04-01), the authors were confident that the responses would be collected within a sufficient time frame. Therefore, no other alternative to gather this data seemed necessary.
4.3 Information sources
The kind of literature used in this research is mainly secondary. Saunders et al. (2012) describes secondary literature as academic journals, books and newspapers where primary literature such as reports, theses and company reports are published. The number of secondary literature sources available continuously expands as new resources are developed via the Internet.
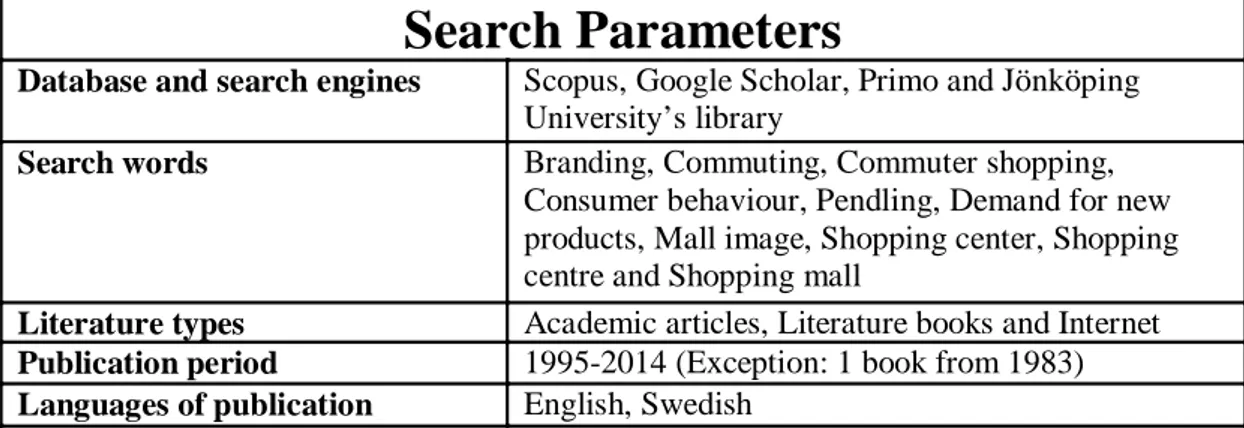
Moreover, most research projects will make the greatest use of secondary literature, since it is often peer reviewed and therefore more reliable (Saunders et al., 2012). In order to gain valuable knowledge of the history of commuting and how it could be put in the context of shopping different kinds of literature have been used. The table below explains what search engines and search words have been used.
Search Parameters
Database and search engines Scopus, Google Scholar, Primo and Jönköping University’s library
Search words Branding, Commuting, Commuter shopping, Consumer behaviour, Pendling, Demand for new products, Mall image, Shopping center, Shopping centre and Shopping mall
Literature types Academic articles, Literature books and Internet Publication period 1995-2014 (Exception: 1 book from 1983) Languages of publication English, Swedish
To search for information and literature for this thesis, the four databases; Scopus, Google Scholar, Primo and Jönköping University’s library has been used.
There is a time span of 19 years in time of publications due to the lack of findings within the relevant topic. One exception is a book regarding shopping malls which was published in 1983. To be able to find enough information to support this thesis the authors needed to use articles, books and information on the Internet from a large period of time. Even if all information provided within the sources is not modern, parts, to different degrees, were relevant for this thesis.
When searching for literature regarding shopping malls the authors found a new edition of Dawson’s (1983) book from 2014. Unfortunately it was not possible to access and therefore the original edition was used. However, when reading the abstracts from both editions it seemed that they were very much alike, and the old edition contributed with sufficient information within the field even if it is published during the 1980’s.
Since all three authors are of Swedish origin it was possible to search with both English and Swedish words to find relevant information, articles and literature books.
4.4 Methods of data collection
Data collection can be divided into two different kinds of information, primary and secondary data.
“Primary data are originated by a researcher for the specific purpose of addressing the problem at hand” (Malthotra, 2004, p.102). Methods used to gather primary data are for example interviews, observations or surveys (Jacobsen, 2002). This is data gathered with respect to fulfil the current purpose.
Secondary data, on the other hand, is collected previously by someone else for other purposes than for the current study. This could be for example books, articles and websites (Saunders et al., 2012).
To be able to reach conclusions about the problem statement both secondary and primary data are being used in this thesis. It is secondary data in terms of articles and books, and primary data in form of a quantitative survey on location in order to get direct answers from the mall customers. Kristoffer Krantz, who is employed by Newsec as Center Manager at A6 Center, have been used as a contact throughout the research process and has contributed with information about branding and marketing regarding the shopping mall and the approach towards customers.
Furthermore, Krantz also has experience from previous surveys regarding marketing and development and suggested the method of conducting a survey among the visitors at the shopping mall in order to approach both local and commuting customers most efficiently.
The survey was conducted with electronic aid in form of iPads from Newsec, where the online survey tool SurveyMonkey was chosen to collect data. Moreover it was executed on location during the weekends. This choice was made from the fact that the visitors then come from a larger catchment area than during the weekdays (K. Krantz, personal communication, 2014-04-01). This means that answers were gathered from people from a wider geographical area, which is the objective of this study.
4.5 Data collection
4.5.1 Primary data
The primary data is mainly collected through a survey among A6 Center’s local and commuting customers. The survey conducted took a standardized form where all participants responded to the same questions (Malhotra, 2004). A majority of the questions had limited alternatives to choose from, while a couple included an option to give an individual open answer. This opened up for important input which was not in the minds of the authors when constructing the survey questions and their alternative answers.
It is a risk to combine quantitative and qualitative research like this, since it may be difficult to interpret the mix of standardized and individual answers (Malhotra, 2004). The researchers wanted to avoid the risk of being biased if only providing alternatives found relevant by themselves. According to Jacobsen (2002) that is otherwise a risk by standardized surveys. Therefore the researchers opened up for individual answers as well.
The choice of providing an open-answer alternative in the survey is described as follows; the authors wanted to avoid completely standardized answers developed when constructing the questions and alternatives. By only providing fixed alternatives to choose from there was a risk that people’s real reasons for going to A6 Center would not be mentioned.
Since the authors created the alternatives based on their pre-knowledge about the shopping mall it could not be excluded that the alternatives would be based on biased thoughts. By giving the respondents the opportunity to create their own reason for visiting the shopping mall the risk of being biased and receiving a limited result could be eliminated.
By the use of an online survey tool on iPads it was easy and convenient for the researchers to fill in approached customers’ answers. The result was also easier to compile as well as to compare the gathered data in order to identify relations between different factors. The weakness of this method was the dependence on the cooperation of the customers and that there was no guarantee for an optimal outcome. To prevent this from harming the results of the survey a lot of time was designated at A6 Center to
make sure to gather enough answers to be able to draw relevant conclusions. The primary goal was to reach 400 respondents, as Jacobsen (2002) mentions as a sufficient sample size.
In order to sufficiently collect data to base the research on, the authors chose to make use of primary research using judgmental sampling. It is a variant of convenience sampling which was the best option for making this specific survey. It was not possible to do random sampling, which is statistically more reliable, since a sampling frame then is needed.
In addition to the survey, primary data was also gathered by a conversation with Kristoffer Krantz, Center Manager at A6 Center. The reason for this contact was mainly to receive first hand information about how shopping malls work to attract commuting shoppers from a wide geographical area. This conversation was managed as an open interview with a few questions constructed beforehand, which is a common type of interview (Jacobsen, 2002).
Furthermore, Jacobsen (2002) argues that an open interview is appropriate when researchers are interested in a specific person’s opinion in a certain topic, or how that individual interprets specific phenomena. Krantz contributed with much valuable and reliable information within the field of interest in this thesis.
When discussing suitable methods for primary data collection the possibilities with a survey as well as more in-depth interviews and focus groups were considered. However, in order to obtain general information about people’s reasons to engage in commuter shopping it was necessary to use a quantitative method where a large number of answers could be collected.
The overall aim with this thesis was never to gather information about perceptions of specific individuals. Therefore, interviews and focus groups could be excluded. Also, it would have been too time-consuming trying to reach and talk to sufficiently many people to draw general conclusions.
The choice of executing the survey face to face at A6 Center was easy to make. It was simply the only reasonable method since there was no e-mail or telephone number list available.
4.5.1.1 Structure of survey
When creating the following questions
1. Gender – To be able to distinguish between women and men to see patterns. Alternatives are female or male
2. Age – In order to see patterns between different age groups.
Alternative in intervals from 18 years old, since we want participants of legal age, up to the last alternative which will be "65 years or older"
3. Where are you from? – Important when distinguishing between local and commuting customers.
The alternatives will be municipalities within A6 Center’s catchment area and one option if the respondent is from outside the catchment area.
4. Is A6 Center the shopping mall closest to your home location? – Yes, No or I don’t know
5. Why do you visit A6 Center? Choose 1-3 alternatives - Alternatives: store range, restaurant/café range, free parking, kids area, close to the highway, on-site events, nice atmosphere, other big stores nearby e.g. IKEA or Elgiganten, convenience, one open ended option if the answer is not listed.
6. How did you become familiar with A6 Center? – To be able to recognise differences between local and commuting customers.
Alternatives: By their marketing activities, passing by on the highway, have known it for a very long time, other: please specify.
7. The target groups of A6 Center are families and young adults, when you see commercials for the mall or when you are there visiting, do you recognise this? Yes, No or I don’t know
4.5.2 Secondary data
The collection of secondary data for this thesis was mainly for the purpose of getting deeper understanding about the topic of commuting. Burns and Warren (1995) discuss how people’s choice of shopping destination is a topic that received increasing attention in the 1990’s. However, when collecting data for this study no evidence could be found that this trend has continued. It rather seems to be an unexploited area and therefore it was only possible to collect a limited choice of secondary data regarding this topic. Therefore, the secondary information is more from a general context than focused on commuter shopping.
However, to be able to interpret the term commuting in the context of shopping, this thesis includes some previous thoughts about consumer behaviour among shopping mall visitors as well as the importance of branding in the shopping mall industry.
4.6 Data analysis
To statistically analyse the data from the survey, the methods and tools explained below will be used. Since the survey is a quantitative method this will be a quantitative analysis. The goal is to show how the respondents answered and to see if there is any statistical association between different variables and if there is, how strong it is. The variables chosen will be declared further into the study.
4.6.1 SurveyMonkey
The online survey tool SurveyMonkey was used to conduct and execute the survey as well as to analyze the data gathered. The extended version Select was purchased on the website to be able to collect enough answers, create frequency distributions, cross-tabulations and also to create figures to make the result easy to understand. As a complement, Excel was used to create cross-tabulations, calculate Chi-Square and
Cramer’s V mentioned further down, and summarise the statistical results in a correlation matrix.
4.6.2 Frequency distribution
Malhotra (2004) explains frequency distribution as: "…one variable is considered at a time. The objective is to obtain a count of the number of responses associated with different values of the variable" (p. 427). The frequency of the different values is conveyed in percentages and produces a table of frequency counts, percentages and cumulative percentages for all values of the chosen variable (Malhotra, 2004). This method makes it clear of how respondents answer different questions in surveys which is the reason it is used in this thesis.
4.6.3 Cross-tabulation
“Whereas frequency distribution describes one variable at a time, a cross-tabulation describes two or more variables simultaneously. A cross-tabulation is the merging of the frequency distribution of two or more variables in a single table" (Malhotra, 2004, p. 438).
This method helps to understand how one variable is related to one or two other variables. Cross-tabulations provide tables that show the joint distribution of two or more variables with a specific number of categories. The table includes a cell for each combination of the categories of the chosen variables. The number in each cell represents how many respondents gave the specific combination of responses. When computing tables for this method the general rule is to have the dependent variable on the rows and the independent variable in columns (Malhotra, 2004).
Cross-tabulations is common in commercial marketing research because the analysis is simple to conduct, can be easily interpreted and understood, and may provide greater insights into the subject in matter (Kivetz & Simonson, 2002; Feick, 1984; cited in Malhotra, 2004).
The introduction of a third variable in the cross-tabulation often clarifies the association observed between the two original variables. It can either refine the association, confirm the initial association, indicate no association even if an association initially was
observed, or indicate an association even if there was no association initially (Wright, 2002; Sirkin, 1999; cited in Malhotra, 2004).
When cross-tabulating relations between two variables can be found, for example an association between gender and why people decide to go to A6 Center. Relations between three variables can also be detected e.g. when combining gender and why people decide to go to A6 with the home location of the respondents. With this information, conclusions can be drawn of both the local and commuting customers and eventual differences and similarities may be analyzed.
4.6.4 Chi-Square
Chi-Square is used to test a null hypothesis about the statistical significance of the observed association from cross-tabulations. This method helps to decide if a systematic association between two variables exists. It is conducted by computing the expected cell values and then compares them to the actual observed value from the cross-tabulation (Malhotra, 2004). The formula for this is found in Appendix 2.
To be able to reject or accept the null hypothesis, i.e. no significant association between the variables, the Chi-Square value is compared with a critical value in the Chi-Square distribution table. Which critical value to use depends on which degree of freedom (Appendix 2) and alpha is used (Higgins, 2002; Pett, 1997; cited in Malhotra, 2004). The null hypothesis will only be rejected when the Chi-Square value is larger than the appropriate critical value. Rejection means that there is a significant association between the variables. If chi-square is smaller than the appropriate critical value, then the null hypothesis is accepted since there is no significant association between the two variables (Malhotra, 2004).
4.6.5 Cramer's V
The Cramer's V is a modified version of the Phi Coefficient which is used to measure the strength of an association found with Chi-Square. Cramer's V is used with tables larger than 2x2 (two rows and two columns) where the number of rows and columns differ from each other (e.g. 3x5). Cramer's V is calculated with a formula (Appendix 2) containing the following factors; Chi-Square, total population and the one of rows or columns there is less of. The number calculated with this method ranges from 0 to 1 where 0 is the weakest relation and 1 is the strongest (Malhotra, 2004).
5 Frame of reference
In this section the data from previous research will be presented. It consists of theories and information relevant for this thesis. Furthermore, it is divided into sub-sections named Commuting, Shopping malls, and Branding in order to provide an overview of the collected information. What is included in this section creates understanding of how the term and theory of commuter shopping is assembled.
The research in this section mainly aims to answer research question 1.
5.1 Commuting
Commuting is most often talked about in relation to labour mobility or referring to people travelling to work on a regular basis (Eliasson et al. 2007; Torége et al. 2008). Except from that, it is very hard to find any research made on the subject of commuting. To find some answers to general reasons why people engage in commuting, without relation to work or labour mobility, one must look closer on each single component. So, without regards to work, the basic foundation in why people commute is utility maximisation. The decision to commute to a certain destination, and not a corresponding destination closer to home, is motivated by a benefit that cannot be found closer to the home location (Eliasson et al., 2007).
Eliasson et al. (2007) describe that the benefit can be in the form of increased number of options, or be characterised by material factors (something physical, e.g. good variety of goods) or immaterial factors (something mental, e.g. a nice atmosphere).
For as long as people have been demanding goods or services they have done what they can to get a hold of them. In the beginning, on a very fundamental level of life, food (e.g. grains, vegetable and meat) has been exchanged for material such as wool (Magnusson, 2010). When the industrialisation of societies began, it contributed to a new era as the agricultural society shifted into an industrial society. The jobs available became centralised to the larger cities where the factories were built. Furthermore, the customer demand shifted to goods and services of a “luxurious” kind and the people who did not follow the migration into the industries had to go the cities in order to get what they wanted (Magnusson, 2010).
Research indicates that people are willing to commute longer distances than before (Torége et al., 2008). Moreover, the amount of commuters has increased in numbers thanks to developed communications but also thanks to an increased tolerance and
acceptance regarding commuting (Torége, Gillingsjö, Lexén & Norberg, 2003). In the context of work, commuting is proven to be very beneficial for the labour market. Labour demand and labour supply can easier be met. There are also individual and universal factors affecting the decision to commute.
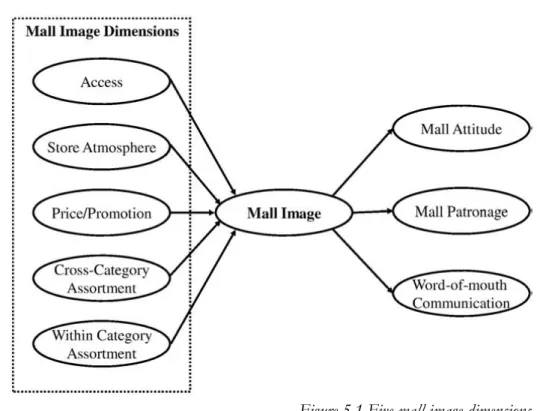
A Spanish study made by Maria D. De Juan (2004), which may as well be applicable worldwide, concludes that customers take other factors into consideration when choosing shopping destination except from driving distance. Car parking options, opening hours and possibility to comfortable shopping from store to store are important features (De Juan, 2004). These features can easily be linked to the five dimensions of mall image presented by Chebat, Sirgy and Grzeskowiak (2010) which will be described further later in the thesis.
5.2 Shopping malls
The term shopping mall is frequently used nowadays. However, it is sometimes not correctly used since people tend to use the term rather loosely when talking about a group of shops (Dawson, 1983). According to Urban Land Institute (1977) the definition of a shopping mall is: “A group of architecturally unified commercial establishments built on a site which is planned, developed, owned, and managed as an operating unit related in its location, size, and type of shops to the trade area that the units serves” (cited in Dawson, 1983, p. 1).
The definition stated above helps to distinguish a shopping mall from a shopping district. The difference is that a shopping district is merely a concentration of individual stores on individual sites, which provides some kind of general bundle of shopping activities. The shopping mall, on the other hand, is a distinctive and carefully planned collection of store units (Dawson, 1983).
Moreover, the core in the definition is that shopping malls are in fact a feature in the process of developing the urban landscape, in which both the public and private landowners develop and dedicate land intentionally for shopping mall cites (Dawson, 1983).
Shopping centres exist in a wide range of cities with different politics and cultures over the world. The history of shopping malls is as long as the history of urban property development planning. Shopping malls have been built in all periods of urban major redevelopment or growth since the 19th century. However, at first the shopping malls were simply a terrace of stores rather than the sensibly and thoughtfully managed and highly promoted shopping malls we have today. Most of the growth has occurred since the 1940’s due to improvement of management procedures that has made it possible to cope with large scaled investments (Dawson, 1983).
Furthermore, the design of the shopping malls has changed over the years, now there is more planning and thought behind the architectural layout. There is a clear purpose behind the architectural layout: to exploit the opportunity of management methods to turn the shopping mall into a confident and fierce generator of increased customer activity. There was no such thought behind the architectural design in the shopping malls a hundred years ago. To maximise profits from retail sales for the stores in the shopping mall, the tenants, there is much effort put into location, size and type of stores (Dawson, 1983).
In the modern shopping malls of today there is a clear correlation between architecture and function. These artificial shopping locations are built in huge enclosed constructions, where the shopping environment is highly supervised and controlled with help of a competent management (Dawson, 1983).
Shopping malls have long been designed in relation to the trade area where it is located, but increasingly competitive marketing has turned this relationship into a more inter-related state where the shopping mall and trade area are more symbiotic (Dawson, 1983). Also, with changes in the consumer behaviour and pattern, analyses of trade areas are concerned with specific customer segments rather than with a total customer population. Speciality malls are an extreme example of shopping malls that target one specific segment, meaning they only sell one group of good e.g. only women’s high fashion goods or only technology-goods (Dawson, 1983).
There are three main types of shopping malls, and Dawson (1983) describes them as follows; the neighbourhood mall, the community mall and the regional mall. The neighbourhood mall is supposed to provide personal service and a widespread range of
convenience goods. The element of personal service is an important element in this type of shopping mall and the assumed catchment area is somewhere around 2’500 to 40’000 people within a six-minute drive. A significant characteristic or merchandising concept, of this type of shopping mall is convenience (Dawson, 1983).
The second type of shopping mall, the community mall, aims to offer customers an even greater depth and variety of assortments compared to the neighbourhood mall. Community malls have a catchment area from 40’000 to 150’000 people and the use of anchor stores is more exploited (Dawson, 1983). An anchor store is usually a big store established to attract and lure customers to go a certain shopping destination. They are strategically placed deep in the shopping mall, so that the customers have to pass many other stores on the way there, which hopefully will lead to more shopping (Konishi & Sandfort, 2003). Many shopping malls that start off as a neighbourhood mall can grow into becoming a community mall (Dawson, 1983).
Finally, the third type, the regional mall, offers wide-ranging shopping goods, general merchandise, apparel, home furnishings and furniture - all in full variety and depth. It targets a catchment area with a population with over 150’000 people. Moreover it is closely located to motorway or freeway intersections (Dawson, 1983).
A shopping mall can be managed to maximise the economic benefit for both the management and the tenants, by a controlled and careful selection of the tenant mix. The development and management process, the industry of shopping malls has come to grow into a multi-million-pound sector in the western economies. Another factor that has contributed to the growth in this sector is the fact that it is a lucrative investment opportunity for land developers and speculators (Dawson, 1983).
The steady advancement and rapid growth in number of shopping malls over the world since the 1950’s, are the main reasons behind the almost evolutionary development of the shopping mall form, and new forms are constantly appearing. Dawson (1983) states that even though the shopping malls are constantly evolving, it is important to keep in mind that the shape of the industry as well as the characteristics and shape of the shopping malls themselves is not a coincidence; it is a result of conscious decisions made in the development process.
Previous studies are in many ways very consistent on how to attract customers. Chebat et al. (2010) specifically states some key activities for malls to engage in when it comes to increase the number of visitors, which is important to continuously work to keep up and develop.
1. Shopping mall promotion in terms of social and entertaining events taking place in the mall (Parsons, 2003; cited in Chebat et al., 2004)
2. Recruit and retain large anchor stores (Pashigian and Gould, 1998; cited in Che-bat et al., 2004)
3. Target shoppers with specific demographic, socio-economic, cultural or psychographic characteristics (Laroche et al., 2005; cited in Chebat et al., 2004)
The fact that shopping malls are using promotional activities more frequently in order to differentiate from other actors through image or brand communication is discussed by Le Hew and Fairhurst (2000) (cited in Parsons & Ballantine, 2004; Parsons, 2003). Dennis, Murphy, Marsland, Cockett and Patel (2002), are also identifying an increasingly competitive environment in the shopping mall market and that branding activities will continue to be even more relevant in the future. That is something the shopping malls of today really need to consider in order to stay competitive.
5.3 Branding
To be able to engage in commuter shopping, the customers need to know what attributes are offered in order to find their optimal benefit. The shopping malls use branding to promote their attributes. Therefore, the following section is an important part of the work towards obtaining the aim of this research.
A company’s brand is often thought of as the biggest enduring asset of the company (Kotler, et al., 2008). However, it is important to remember that brands go beyond the meaning of just names and symbols. A brand is the key element in building a relation with customers as the brand communicates a message. The customers then perceive this message, e.g. it will trigger emotions and thoughts about the good or service the brand represents – everything the brand means to each individual customer. Therefore the
development and strategies of the brand should be carefully developed (Kotler et al., 2008)
The companies’ that successfully manage to capture the customer’s preference and loyalty are seen to have a successful brand. This is defined as that the customers have brand awareness (Kotler et al., 2008). Moreover, brands that possess brand preference have a very high degree of brand loyalty, which means that customers chose their product or service over others simply because of the brand. These brands are not chosen only because of good quality or unique benefits, but because they have managed to reach the customer in a personal way, which gives a strong connection (Kotler et al., 2008).
There are differences in how to establish in customer’s minds depending on if you are representing a shopping mall including many brands or if your focus is on one brand only (De Juan, 2004), since a shopping mall needs to build its brand by representing different sub-brands offering different products and services. Previous research states that image is a term more commonly used than the term brand in the context of shopping malls. However, branding is continuously becoming more important within this context (Dennis et al., 2002).
When discussing brands, the term brand equity often is mentioned. Brand equity is typically associated with a strong brand and is defined as the positive differential effect it has on the customers’ response towards the brand. Brands with high brand loyalty, proven good quality, strong name awareness, and strong and positive brand associations or other assets such as trademarks or patents have a higher degree of brand equity. A way to measure brand equity is to look closer on the extent to which the customers are willing to pay more for the product or service, which the brand represents, compares to other similar products or services (Kotler et al., 2008). With this in mind, Kotler et al., (2008) argues that a brand that possesses brand equity is a very important asset. Once a brand has been established it is time for the challenging work of the marketing team, they need to position their brand in a way that it will further target the customers’ minds. There are four different levels that can be used in positioning. On the first level, and also the lowest one, the marketing team often position their brand on product attributes, e.g. high quality or nice atmosphere. The attributes level is the least desired