A PROBABILISTIC ASSESSMENT OF RESERVOIR FILL UNDER A RANGE OF WINTER FLOW REGIMES
Lyn Benjaminl ABSTRACT
Regulated flow regimes below irrigation reservoirs frequently create undesirable conditions for downstream biota. In order to meet reservoir fill deadlines, winter discharge below Island Park reservoir on the Henry's Fork of the Snake River, eastern Idaho, has been dramatically reduced from pre-dam flows of approximately 400 cfs, affecting trout and trumpeter swan populations. The purpose of this study was to model the probability of meeting storage deadlines while providing minimum instream flows during the winter months. Five different winter release scenarios were simulated using actual outflow and reservoir storage data for each water year from 1940 to 1995, and the probability of reservoir fill was calculated for each of these scenarios. The sensitivities of reservoir fill to reservoir starting levels and fill deadlines were also compared by running the simulations with different reservoir starting levels and fill deadlines. Results indicate that the probabilities of meeting the April 1st fill deadline with winter flows of 200 and 300 cfs are 55% and 42%, respectively. Bureau ofRec1amation operating procedures that link all reservoirs within the Minidoka system mandate filling Island Park by April I st, despite the observations that irrigation water is rarely needed from Island Park before July 1 st and spring runoff occurs in April and May. When later fill dates were modeled, probabilities of reservoir fill became greater. Reservoir fill is very sensitive to reservoir levels at the start of storage season; fill occurs 100% of the time by May 1 st with winter outflows of 200 cfs when starting contents exceed 65,000 acre feet. These results suggest that in order to provide for both instream flow and irrigation needs, water managers consider the moving the mandated fill date for Island Park Reservoir later in the spring and implementing water
conservation measures that will maximize reservoir contents at the end of irrigation season.
INTRODUCTION
The character and quality of stream ecosystems is ultimately dependent on the geomorphology and hydrology of the system. However, human use of both land and water are substantially altering hydrologic regimes throughout the western United States. Irrigation, hydropower, and flood-control demands often produce hydrologic regimes that create undesirable conditions for downstream ecosystems. Irrigation or hydropower needs can generally be quantified, but it is difficult to know the optimal flow regime for all parts of the aquatic and riparian ecosystems.
1 Candidate for MS in Watershed Science, Utah State University, Logan, Utah 84322
It is more productive to gain an understanding of the unaltered flow regime, how it differs from the regulated regime, and where flexibility exists to bring the two flow regimes closer together. In any watershed, allocation of available water resources requires balancing the needs of all the surrounding communities. The 1996 spring flood through the Grand Canyon is an example of a recent trend in managing regulated river systems with a broad range of objectives, which include protecting the downstream ecosystem.
The Henry's Fork of the Snake River in Eastern Idaho supports a world renowned blue-ribbon trout fishery and provides winter habitat for a large trumpeter swan population. Recent fluctuations in fish and swan populations, and the macrophytes that support both fish and swans, have prompted inquiry into the relationship between the regulated flow regime and population changes. Island Park Reservoir is primarily operated for irrigation purposes, which results in reduction of flows during storage season. Until 1972 winter flows were held at an extremely low level; since 1972 the winter flows have been higher, with only five years of flows below 20 cfs. It is thought that fish and swan populations remained depressed because of low winter flows prior to 1972 and that subsequent improvements in winter flows resulted in at least temporarily increased population numbers. However on the Henry's Fork the relationship between winter flow and population numbers hasn't proven to be as simple as ''more water equals more fish and wildlife." Indeed, over the past ten years rapid increases in wintering swan numbers has negatively impacted the macrophyte community and, in turn, trout habitat. Although the relationship between flow regime and downstream biological response is still being studied, it is evident that large changes from year to year in winter flows have precipitated population fluctuations. Attempts to achieve more consistent winter flows through cooperative management of water resources in the basin have initiated a study to assess the feasibility of meeting both irrigation requirements and winter flow needs. The objectives of this paper are to use statistical methods to provide a probabilistic assessment of Island Park reservoir fiU with a range of winter flow regimes and to compare the sensitivity of reservoir fill to reservoir starting levels and fill deadlines .
. STUDY AREA
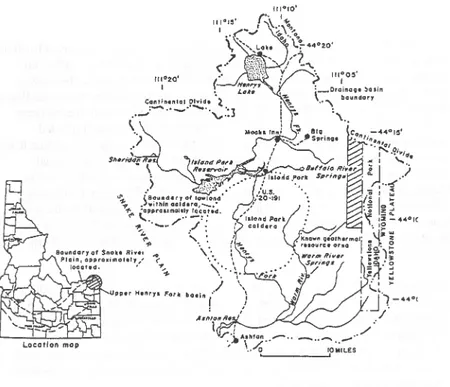
The focus of this study is Island Park Reservoir in the Upper Henry's Fork of the Snake River basin, Eastern Idaho. Figure 1.
Probabilistic Assessment of Reservoir Fill
265
Fig. 1. Map of Upper Henry's Fork basin.
The upper basin, generally considered to extend downstream to Ashton, drains an area of 1,070 mi2
and has an estimated permanent population of 4,000 residents. The basin is bounded to the north by the crest of the Continental Divide, to the east by the Yellowstone Plateau, and to the south and west by the northeastern end of the Snake River Plain. Altitudes range from over 10,000 feet along the
Continental Divide to 5,200 feet at Ashton, with a mean elevation of 6,700 ft. The basin has one ofthe coldest climates in the western United States. Mean annual temperatures at Ashton and Island Park Reservoir are 5.30
and 2.30
C, respectively; freeze free periods are 90 and 40 days, respectively. Annual precipitation averages 16.9 inches in Ashton and 28.9 inches at Island Park Reservoir. Annual basinwide precipitation, most of which falls as snow, is estimated to average 35 inches (Whitehead, 1978). Vegetative cover at higher elevations in the upper basin consists of lodgepole pine and open meadow
communities, and land use is timber production and grazing. The lower plains near Ashton are irrigated croplands producing grain, potatoes and hay (Idaho Water Resource Board, 1992).
The Island Park area forms a geologic and topographic transition between the Yellowstone Plateau and the Snake River Plain (Anderson, 1994). During Cenzoic
time the Island Park caldera, a large elliptical bowl, was formed by the collapse of a shield volcano in the south-central part of the Henry's Fork basin. After the caldera formed, rhyolitic ash from the Yellowstone Plateau covered the eastern part of the caldera rim and basalt flows impinged on the southern rim (Idaho Water Resource Board, 1992). During the late Pleistocene, glaciation in the northern and eastern parts (the present-day Henry's Lake flats) ofthe basin provided outwash to valleys and stream channels. Contemporaneously, basalt emerged from vents south and west of the caldera and flowed onto the caldera (Whitehead, 1978). The Plateau Rhyolite, in the eastern basin, has particular significance to basin hydrology due to its highly permeable nature that allows rapid infiltration with little surface runoff or evaporation. As a result, these areas of the basin are characterized by an absence of well-defined stream patterns and the presence of large downgradient springs, such as Big Springs, the Buffalo River and Warm River Springs.
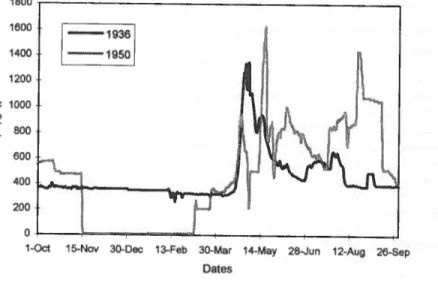
The unregulated hydrology of the Henry's Fork of the Snake is strongly influenced by the presence of these spring systems, which are estimated to contribute 42% to the total flow of the river at Ashton. Winter base flows are higher, and the range of discharges is narrower, than those generally observed in a typical Rocky Mountain runoff-dominated stream. The timing of peak flows is influenced both by snowmelt on the Island Park plateau and by the later melt in the high elevation Centennial Mountains. Figure 2.
1800~---~ 1600 1400 1200 ~ 1000 u. 800 600 400
t'""-
4'"'
-
-
--'\tw-
-IfI-()
200 O~--_4----~----~GL~---+_--~----~1-Oct 15-Nov 3Q-Oec 13-Feb 3Q-Mar 14-May 2lhJun 12-Aug 26-Sep Dates
Fig. 2. Hydrograph of Unregulated and Regulated Flow at Island Park. Henry's Fork of the Snake, Id. Water Year 1936 and 1950.
I
l
1
/
Probabilistic Assessment of Reservoir Fill
267
Since 1923 and 1939, streamflow below Henry's Lake and Island Park reservoir respectively has been regulated, as part of the Minidoka system, to meet irrigation demands. As a result, flows on the Henry's Fork below Island Park reservoir now show characteristics of an irrigation-based hydrograph with reduced flows during the storage season (November 15th
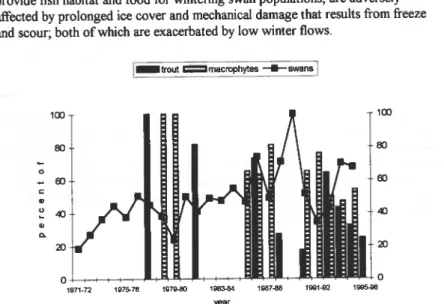
to April 1 It), a short spring runoff peak with a steep recession limb, and prolonged high flows in late summer. Figure 2. Recent declines in the downstream fisheries and high mortality rates among wintering trumpeter swan populations (fig. 3) have prompted studies into the relationship between the altered flow regime, specifically reduced winter flows, and the status of trout, swan and aquatic macrophyte communities. Preliminary studies indicate that early winter, when river temperatures are coldest, is the most critical time for the survival of juvenile trout, which must find cover in cobbles where temperatures are 0.2°_1.0° C higher than overlying water (Smith and Griffith, 1994). High winter flows make this cover available, but low flows out of Island Park Reservoir make this habitat unavailable. Aquatic macrophytes, which provide fish habitat and food for wintering swan populations, are adversely affected by prolonged ice cover and mechanical damage that results from freeze and scour; both of which are exacerbated by low winter flows.
100 100 eo eo 0
-
&l"
..
~ <D <D..
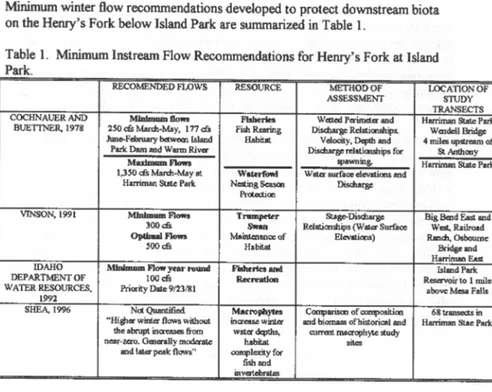
Q. 20 20 1971-n 18~78 1979-80 1983-64 1Q67-88 199M~2 yearMinimum winter flow recommendations developed to protect downstream biota on the Henry's Fork below Island Park are summarized in Table 1.
Table 1. Minimum Instream Flow Recommendations for Henry's Fork at Island Park
RECOMENDED FLOWS RESOURCE METHOD OF LOCATION OF
ASSESSMENT STUDY
TRANSECTS
COCHNAUER AND MInImam_ F1Iberies Wdled P<rimctcr and Huriman State Parit
BUETI'NER, 1978 250 cIS Mardi-May, 177 cIS Fish Rearing Discharge Rdationships. WendeU Bridge
Jun ... February bciwccn Island Habitat Vdocity, Depth and 4 mil .. upstream of
Parit Dam and Warm River DisdJarse tdlltionships for St Anthony
MulmamFlows spawning. Harriman StIlt. Plrk
1,350 cIS Mardi-May at Wllterfowl Woter swflce devations and
Huriman State Park Nesting Season Discharge
Protedion
VINSON,I991 MInImum Flows Tnunpder Stege-Discharge Big Bend East IUd
300 cIS
-
Rdaticmsilips (Wilter Surface W<J#., Roilrood0pIiIIIaI Flows Maintawlce of Elevaticms) Randt, Osbourne
500 cIS Hlbitat Bridge and
Huriman East
IDAHO MJnimom Flow yoar roWld Flsherles_ Island Parit
DEPARTMENT OF 100 cIS R«reatIon Rcs«Voir to 1 mile
WATER RESOURCES, Priority Dole 9/23/8\ above Meso FaUs
\992
SHEA, 1996 N .. Quantified Murop/lytft Comparison of ~on 68 transeas in
"Higlter winter flows without inac:asewi:nte'l' and biomass of historical and Huriman Sloe Parit
the abrupt inac:ases from wllter dqJths, currcm maaoph)'l<> study
near-zero. o..,eraUy rnodenIe hlbitat sites
ond lilterpeak flows" complexity for
fish and
invatdxat.es
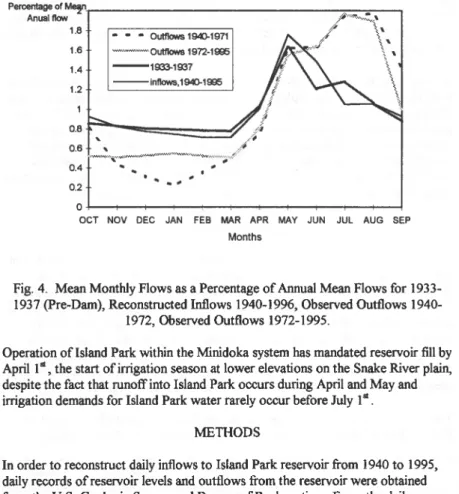
Prior to 1972 winter flows from Island Park reservoir were frequently reduced to below 20 cfs; however, since 1972 the Bureau of Reclamation, in an attempt to meet fish and wildlife instream flow needs, has increased storage season flows to at least 100 cfs. This change in management strategy is shown in Figure 3, which gives mean monthly flows as a percentage of annual mean flow for the pre-dam period, reconstructed inflows 1940-1996, observed outflows 1940-1972 and observed outflows 1972-1995
Probabilistic Assessment of Reservoir Fill Pe~~m~'r-________________________________ ~-=
__
~ Anuall\ow . ?"'~~"..
1.8 _ _ _ Outflows 1940-1971 \ ' \ ' 1.6 ~-H_·Outflows 1972-1996 " , 1 4 --1933-1937 '\ 1'.2 - - inl\ows,I940-1996 '\. -:~ .• tilt .. JIll JIll
0.2
0+-~~~--~--~--~~~~--~--~--~-4
OCT NOV DEC JAN FEB MAR APR MAY JUN JUL AUG SEP
Months
269
Fig. 4. Mean Monthly Flows as a Percentage of Annual Mean Flows for 1933-1937 (pre-Dam), Reconstructed Inflows 1996, Observed Outflows
1940-1972, Observed Outflows 1972-1995.
Operation ofIsland Park within the Minidoka system has mandated reservoir fill by April 1 st , the start of irrigation season at lower elevations on the Snake River plain,
despite the fact that runoff into Island Park occurs during April and May and irrigation demands for Island Park water rarely occur before July 1 st .
METHODS
In order to reconstruct daily inflows to Island Park reservoir from 1940 to 1995, daily records of reservoir levels and outflows from the reservoir were obtained from the U.S. Geologic Survey and Bureau of Reclamation. From the daily change in reservoir storage and average daily outflows, inflows were calculated using the mass balance equation:
Change in storage
=
inflow-outflow (1)Using reconstructed daily inflows, outflows of 0 cfs, 100 cfs, 200 cfs and 300 cfs and the reservoir level on September 30th (the end of irrigation season) daily reservoir contents until the following July 1 st were modeled for each year of
record. This was done by adding the difference between each outflow and daily reconstructed inflows to successive reservoir contents to project daily reservoir contents until July 1 st. The date of reservoir fill, which occurs with 135,000
into contents in acre-feet by the Bureau of Reclamation, and cubic feet/sec were converted into acre-feet/day by multiplying by 1.98. The probabilities of reservoir fill by Aprilllll, May 1111, June 1111 and July 1111, with winter outflows of 0 cfs, 100 cfs, 200 cfs and 300cfs were calculated from these results.
In order to examine the sensitivity of reservoir fill dates to reservoir starting levels I calculated the mean and median of the reservoir contents on September 30th
, and also graphed the chronological time series of contents on September 30th
for the period of record. The model was then rerun with six different starting contents (15,000 acre-feet, 35,000 acre-feet, 55,000 acre-feet, 85,000 acre feet, 95,000 acre feet and 65,000acre-feet) and 0 cfs, 100 cfs, 200 cfs, 300 cfs and 400 cfs outflows. The percentage of time the reservoir filled by April 1111, May 1111 and June
1111 as a function of these start contents was calculated and compared.
RESULTS
Results from the reservoir content simulation modeling are shown in Table 2. For the 56 years of record, reservoir fill would occur by April 1111, 83% of the years with 100 cfs outflow, 55% of the years, with 200 cfs outflows, and 42% of years, with 300 cfs outflows. Fill would occur by May 1111, 97% of the years with 100 cfs outflow, 85% of years, with 200 cfs outflows, and 48% of years, with 300 cfs outflows. Fill would occur by June 1111, 100010 of the years with 100cfs outflow, 97% of years, with 200 cfs outflow, and 70010 of time with 300 cfs outflows. By July 1111, fill would occur 100010 of years with outflow of 100 cfs, fill occurs 98% of years, with 200 cfs outflows, and 96% of time, with 300 cfs outflows.
Table 2. Percentage of Years that Island Park Reservoir would Fill by April 1111, May 1111, June 1111 and July 1111 with winter outflows of 0, 100,200 and 300 cfs.
OCFS 100 CFS 200 CFS 300 CFS
OUTFLOW OUTFLOW OUTFLOW OUTFLOW
Percent fi1l by April 1111 98% 83% 55% 42% Percent Fill by May 1111 100% 97% 85% 48% Percent Fill by June 1111 100% 100010 97% 70010 Percent Fill by July 1" 100% 100% 98% 90010
Reservoir contents on September 30th, for the years of record, range from 15,000
acre-feet to 115,000 acre-feet, with mean value of 72,000 acre-feet. Mean reservoir contents on April 1111 are 118,000 acre feet, for May 1" are 124,000 acre feet and for June 1111 are 135,000 acre feet.
1
\
I
Probabilistic Assessment of Reservoir Fill
Probability of Fin All by Apr111at
100 00 eo 70 eo 50 40 30 :20 10 0 100 00 eo 70 E() 50 40 30 :20 10 0 15000 100 00 eo 70 E() 50 40 30 :20 10 0 15000
FIN by May 1at
Fill by June lat
--100 --e-:200 -6-300 -+-400
3&XXl
Reservoir Contents. acre-feel
Fig.S. Probability of ReselVoir Fill as a Function of ReselVoir Contents on September 30th, with 100, 200
300 and 400 cfs Winter Outflows
Probability of Fil 200 CFS OUTFLOW 100 _ .•.•...•...•. _ ... __ _ 90 so 70 _,.n ED 50 40 3J 20 10
.
.
..
.
. .
~
==
- - 6 5 ( X X ) • _ ... -.. 66CXXl --~ o+---~---~ l·Apr 100 90 so 70 ED 50 40 3J 20 10_
.
~,,--
-
. --
-
-
-1-May 300 CFS OUTFLOW.
.
.
. . .
.,.
l.JunO~==========~~---~
l·Apr 1-May l.Jun1oor-_________________ ~~~C~F~S~0UTF~~LOW~ __________________ --, 90 so 70 ED 50 40 3J 20 10 ~, ... <...,~.:;. .... ;;.' _ • O~~~~~~~~~~==---~ 1-Apr 1-May FIR Da1e
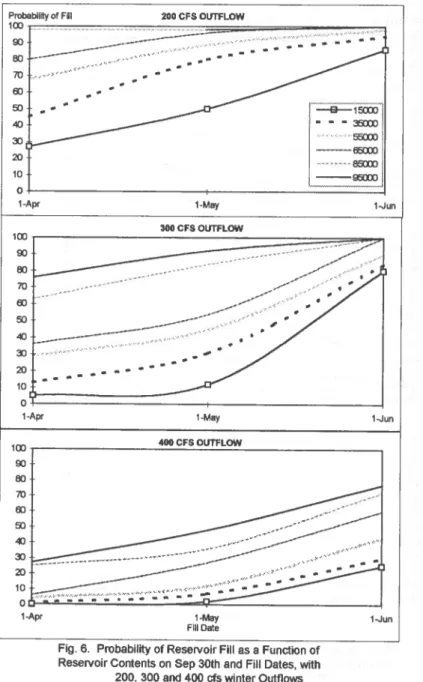
Fig. 6. Probability of Reservoir Fill as a Function of Reservoir Contents on Sep 30th and Fill Dates, with
200, 300 and 400 cfs winter Outflows
Probabilistic Assessment of Reservoir Fill
273
Sensitivity of reservoir fill to reservoir contents on September 30th is illustrated in Figure 5. Fill by April 1 st , with outflows of 100 cfs, is most sensitive to start contents between 15,000 and 45,000 acre feet, above this the probability offill does not increase greatly. Sensitivity to start contents with 200 cfs outflows ends at 85,000 afabove which probability offill does not increase. 300 cfs outflows show start content sensitivity throughout the range but between 55,000 and 65,000 af sensitivity is reduced. With 400 cfs outflows sensitivity to start contents is only shown between 65,000 and 85,000 acre feet. Fill by May 1st with 200 cfs outflows is only sensitive to start contents up to 35,000 af, with 300 cfs outflows fill is most sensitive between 65,000 and 85,000 afand outflows of 400 cfs show moderate sensitvity throughout the range. Fill by June 1 st with outflows of 200 and 300 cfs has a 100% probability of occurrence with start contents above 62,000 acre feet, with 400 cfs outflows sensitivity to fill is fairly consistent through the range.
A comparison between the sensitivity of reservoir fill to reservoir start contents and fill deadlines is shown in Figure 6. At 200 cfs outflow maximum increases in fill probability occur between May 1st and June 1st with 15,000 acre feet start contents (35%); between April and May with 35,000 acre feet start contents (32%) and on April 1st between 35,000 acre feet and 55,000 acre feet start contents (33%). At 200 cfs these adjustments in start contents or fill deadlines are roughly equivalent to each other. At 300 cfs outflow maximum increases in fill probability occur between May 1st and June 1st with 15,000 acre feet (65%); between May 1st and June 1st with start contents of 55,000 acre feet (38%) and 65,000 acre feet (45%); and on April 1st and May 1st between 65,000 and 85,000 acre feet (29%). At 300 cfs a 45% increase in probability can result from moving the fill deadline or increasing the reservoir start contents from 65,000 acre feet to 95,000 acre feet with a fill deadline of May 1st. At 400 cfs outflow a maximum increase in fill probability occurs between May 1 st and June 1 st with start contents of85,000 acre feet (47%) and is most sensitive between 65,000 and 85,000 acre feet start contents on April 1st (20%). The 47% increase due to change in fill deadline is approximately equivalent to an increase in start contents from 35,000 to 85,000 acre feet with a June 1st fill deadline.
DISCUSSION
The objective of the study was to provide a quantitative basis to establish minimum winter flows on the Henry's Fork below Island Park within the constraints of irrigation needs. Results from the model furnish several options for meeting this objective, including using 118,000 acre feet as the fill objective for April 1st, moving the fill deadline forward to May 1 st or 15th and starting the storage season with as high reservoir levels as possible. The following recommendations that optimize the probability of reservoir fill while maximizing winter flows.
For the period of record the mean reservoir contents on April lsi is 118,000 acre-feet, and mean contents on May lsi and June lsi are 124,000 and 135,000 acre-acre-feet, respectively. At present the Bureau of Reclamation uses 135,000 acre feet on April 1" as the objective with which to calculate winter flows; however this is unrealistic because flood control curves rarely allow for this amount of water to be in the reservoir on this date. Ifinstead an objective of 118,000 acre feet on April 1" was used an extra 40 cfs would be available for daily winter flows, which represents a significant proportion of winter base flows.
Fill occurs most frequently (40% of the years) between May 1" and 15th, which suggests that a more realistic fill deadline to use in calculating winter flows is May 111 or 15th. Moving the fill deadline has previously been viewed as posing a risk to irrigation water supply, but inflow reconstruction and a new gauge station on the Henry's Fork above Island Park have both provided a more accurate assessment of the constant nature of winter inflows into the reservoir. Figure 3 shows that the lowest inflows into the reservoir occur in March and that these flows are only 12% below October flows. This information indicates that dramatic decreases in inputs to the reservoir do not occur over the winter and that October inflows give a reasonable approximation of inflows throughout the winter months. Additionally, snowmelt runoff is known to occur in late April and May so the probability of adding additional water to fill the reservoir is high.
The probability of reservoir fill is clearly sensitive to reservoir contents at the start of the irrigation season. Higher reservoir levels at the end of the irrigation season provide a higher likelihood of biologically adequate winter flows and reservoir fill. Although the amount of water used from the reservoir during irrigation season is largely climatically controlled, conservation efforts will improve the following year's refill probability. If the reservoir level at the start of storage season is low, winter outflows from the reservoir should be distributed to release a greater portion earlier and decrease flows later, if needed. This is a more appropriate strategy than reducing flows early in the winter because the critical survival period for juvenile trout appears to be early winter, and more accurate predictions of snow runoff are available in later winter.
The model provides a method to assess winter flow options for the Henry's Fork below Island Park and quantify the probability ofIsland Park reservoir fill under a range of scenarios. The sets of curves shown in Figs. 5 and 6 show the sensitivity of reservoir fill to starting levels and fill deadline dates with given winter flows.
Decisions about the size of winter flows can be made using these curves to predict the likelihood offill under each scenario. Each year presents a different set of hydrologic conditions that determine the way irrigation and instream flow needs can be met. This type of analysis can apply different conditions to the constraints of a given reservoir system and be used as a tool to manage water resources and balance potentially conflicting demands.
Probabilistic Assessment of Reservoir FIll 275
Literature Cited
Bureau of Reclamation. 1996. A Description of Bureau of Reclamation Systems Operations above Milner Dam. Bureau of Reclamation, Boise, ill.
Cochauer, T. and E. Buettner. 1978. Stream Resource Maintenance Flow Determinations on Idaho Streams. Job #2. Idaho Department ofFish and Game, Boise, Idaho.
Shea, R.S., E.O. Garton and I.J. Ball. 1987. The history, ecology and management of the Rocky Mountain population of trumpeter swans. U.S. Fish and Wildlife Service and Montana Wildlife Resources Cooperative, Missoula, MT. Shea, R. 1996. Assessment of Aquatic Macrophytes at Harriman State Park and at other Key Wintering Sites within the Henry's Fork Watershed, Idaho. Executive Summary. Unpubl.
Smith, R.W. and J.S. Griffith. 1994. Survival of Rainbow Trout during Their First Winter in the Henry's Fork of the Snake River, Idaho. Transactions of the American Fisheries Society 123:747-756
Vinson, D.K. 1991. Base Flow Determination for wintering trumpeter swans on the Henry's Fork of the Snake River. U.S. Fish and Wildlife Service, Boise, ill.