Pedestrian Protection System -
Hood lift study
Summary
Every year approximately 400 000 pedestrians are killed worldwide in road related injuries where children and elderly are the most exposed age groups. The design of the front-end of a vehicle and the structural stiffness have a significant influence on the kinematics and injury risks of the pedestrian body. To create a clearance between the rigid hood structure and the hood, the hood is lifted. A lifted hood does however not provide protection over the cowl, windscreen and A-pillar areas.
This study is performed at Autoliv Sverige AB and the purpose is to examine how fast the hood can be lifted 100 mm using a pedestrian protection airbag. The airbag give an extended protection while covering the cowl, windscreen and A-pillar areas.
A concept generation session was performed where modifications of the current pedestrian protection airbag, for a faster hood lift, were proposed. The generated concepts proceeded to a concept screening session where the Autoliv evaluation matrix was used.
The selected concepts went further to static testing where the performance of each concept was tested. The performance include the lift time of 100 mm for the most rearward section of the hood, positioning of the cushion and pressure distribution. The tests were carried out in a room temperature environment.
To conclude the thesis work, one winning concept could not be obtained. Two concepts excelled themselves from all the concepts and a difference in the performances between these two concepts could not be found.
In this thesis no calculations on costs such as material costs and manufacturing costs has been made. This can be the major aspect on choosing one winning concept but due to the fact that there is no time for a cost analysis in this thesis, the PPA development team will take over.
Date: April 12, 2015
Author: Kristian Abdallah
Examiner: Mats Larsson, University West
Advisor: Ulf Magnusson, Autoliv Sverige AB Fredrik Kjell, Autoliv Sverige AB Thomas Carlberger, University West
Programme: Mechanical Engineering, 180 HE Credits
Main field of study: Product Development and Design Education level: Bachelor Credits: 15 HE credits
Keywords Autoliv, Pedestrian, Protection, Airbag, PPA, Hood, Lift, Vehicle, safety
Publisher: University West, Department of Engineering Science S-461 86 Trollhättan, SWEDEN
Preface
With this thesis work the mechanical engineering programme at University West, which was educational and fun, has ended. University West is one of few universities that offers studies with the possibility to do a trainee at a company. I did my trainee at Autoliv Sverige AB which is one of the world leading supplier of automotive safety products. Throughout my trainee at Autoliv, the love I have for problem solving and vehicles have increased. That’s why I will continue my education in Chalmers with a master in Automotive Engineering.
I would like to express my gratitude to Ulf Magnusson, Project Team Leader and Fredrik Kjell, Group Manager for their kindness and giving me the opportunity to show them my skills and my willingness to learn.
A special thanks to David Jonsson Holm, Project Engineer for his kindness and guidance throughout the thesis work.
Thanks also to Thomas Carlberger, my tutor at University West for his support during this thesis work.
Finally I would like to thank the employees at Autoliv that helped me whom without your help this thesis would not be possible.
Vårgårda, 16 March 2015
Contents
Summary ... i
Preface ... ii
Symbols and glossary ... vi
1 Introduction ... 1
1.1 Autoliv Sverige AB ... 1
1.2 Pedestrian Protection System ... 1
2 Problem formulation ... 2
2.1 Purpose ... 3
2.2 Delimitations ... 3
3 Literature studies ... 3
3.1 Priorities of pedestrian protection – a real life study of severe injuries and car sources ... 3
3.2 The Head Injury Criterion (HIC) functional ... 4
3.3 HIC measurement limitation ... 5
3.3.1 Influence of impact speed on head and brain injury outcome in vulnerable road user impacts to the car hood ... 5
4 Theory ... 6
4.1 Gas and pressure ... 6
4.2 Material science ... 7
4.3 Strength of material ... 9
4.4 Pedestrian Protection Airbag ... 10
4.5 Concept Development ... 12
4.5.1 Clarification of the problem ... 13
4.5.2 Consultation of experts ... 13
4.5.3 Brainstorming ... 13
4.6 Concept selection ... 14
4.6.1 Autoliv evaluation matrix ... 14
5 Concept development... 15 5.1 Parameters ... 15 5.2 Concept generation ... 15 6 Patent infringements ... 16 6.1 Found patents ... 16 7 Concept selection ... 17 7.1 Equipment... 18
7.2 Body in white, BiW ... 18
7.3 Hood ... 19 7.4 Hinges ... 20 8 Measuring methods ... 21 8.1 Accelerometers ... 21 8.1.1 Diadem ... 21 8.2 Patrick marking... 22 8.2.1 TEMA ... 23 8.3 Camera ... 23 8.3.1 Falcon Extra ... 24 8.4 Pressure measurement ... 24
9 Testing and results ... 25
10 Analysis and discussion ... 26
10.1 Time of hood lift of 100 mm ... 26
10.1.1 Repetitive behaviour within the concepts ... 27
10.1.2 Comparison of lift times for all concepts ... 29
10.2 Pressure ... 31 10.3 Positioning ... 31 11 Conclusions ... 32 12 Future work ... 33 References ... 35
Table of figures
Figure 1. WAD illustration ... 2Figure 2. Illustration of the relation between HIC values, hood lift distance, and car velocities upon impact ... 6
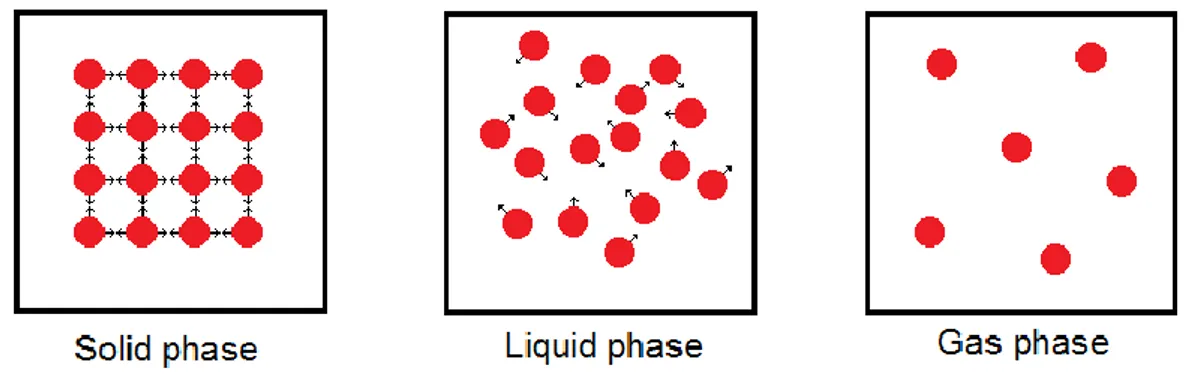
Figure 3. Illustration of the solid, liquid and gas phase ... 6
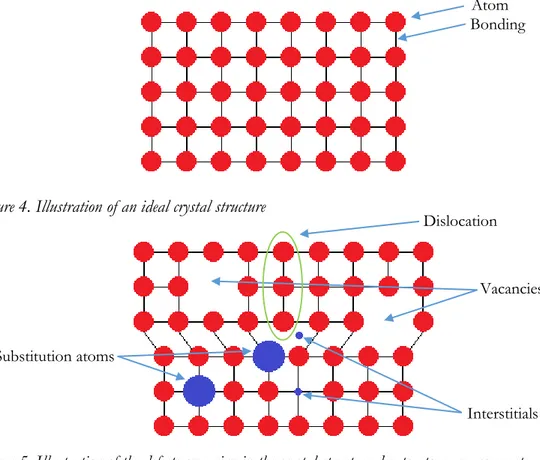
Figure 4. Illustration of an ideal crystal structure ... 8
Figure 5. Illustration of the defects occurring in the crystal structure due to atom arrangements ... 8
Figure 6. Illustration of the shear stress principle ... 9
Figure 7. Illustration of the hood placement over the cowl ... 10
Figure 8. Illustration of a point load acting on the hood ... 10
Figure 9. Illustration of a distributed load acting on the hood ... 10
Figure 10. Illustration of the cushion positioning used as reference ... 11
Figure 11. Illustration of the scientific principle of a head-to-cushion impact with A2=2A 11 Figure 12. Illustration of a head-to-cushion impact with wide attachment placement ... 12
Figure 13. Illustration of a head-to-cushion impact with close attachment placement ... 12
Figure 14. Cut out of the evaluation matrix showing the criteria’s ... 18
Figure 15. The body in white used for the testing's ... 19
Figure 16. Foam used to create a stiffer cowl surface ... 19
Figure 17. The hood used in the testing's ... 19
Figure 18. Welded attachment and support placement on the hood ... 20
Figure 19. Illustration of closed vs. lifted hood mode of the hinge ... 20
Figure 20. On-hood placements of the accelerometers ... 21
Figure 21. Illustration of a Patrick marking ... 22
Figure 22. Placements of the Patrick markings ... 23
Figure 23. Camera placement and view ... 24
Figure 24. Placements of the pressure nipples ... 24
Figure 25. Descriptive image of the right, mid and left placement ... 25
Figure 26. Test results for concept I plotted into a time-distance graph and a DIAdem vs. TEMA comparison. ... 27
Figure 27. Test results for concept J plotted into a time-distance graph and a DIAdem vs. TEMA comparison ... 28
Figure 28. Test results for concept B plotted into a time-distance graph and a DIAdem vs. TEMA comparison ... 28
Figure 29. Test results for concept G plotted into a time-distance graph and a DIAdem vs. TEMA comparison ... 28
Figure 30. Test results for concept F plotted into a time-distance graph and a DIAdem vs.
TEMA comparison ... 29
Figure 31. Graph showing the lift time of all concepts in Y0 ... 29
Figure 32. Graph showing the lift time of all concepts on the left side ... 30
Figure 33. Graph showing the lift time of all concepts on the right side ... 30
Figure 34. Illustration of cushion positioning... 31
Table of Tables
Table 1. List of patents ... 16Table 2. List of test results ... 26
Table 3. List of concepts linked to appendices ... 26
Table 4. List of test results for each concept ... 27
Appendices
A. Concept selection: Autoliv evaluation matrix
B. Test results. Concept B C. Test results. Concept F
D. Test results. Concept G E. Test results. Concept I F. Test results. Concept J
Symbols and glossary
WAD – Wrap around distance HIC – Head injury criterion
PPA – Pedestrian protection airbag
GIDAS – German In-Depth Accident Study AIS - Abbreviated Injury Scale
Cowl – Rigid structure between hood and windscreen. Home to wiper attachments. Y0 – Mid of the hood
BIW – Body in white
1
Introduction
A car-to-pedestrian impact is a common type of accident. Every year approximately 400 000 pedestrians are killed worldwide. The most exposed age groups are children and elderly people where children have the highest frequency of pedestrian accident involvement and elderly pedestrians have the highest injury and fatality risks. (Fredriksson et.al. 2010)
The outcome of this study is a winning concept which will be decided after a testing phase. Together with Autoliv Sverige AB this study will get the company one step closer to a zero vision where no one gets seriously injured in road related accidents.
1.1 Autoliv Sverige AB
Autoliv Inc. is one of the world leading supplier of automotive safety products. The vision of the company is to substantially reduce traffic accidents, fatalities and injuries which is achieved by following the mission to create, manufacture and sell state-of-art automotive safety systems. (Autoliv, 2014)
Autoliv Sverige AB was founded in 1953 in Vårgårda, Sweden, by two brothers and since then the company has grown to supply all the leading car manufacturers in the world. The company’s products save 30 000 lives every year. (Autoliv, 2014)
Today Autoliv Inc. has 60 000 associates in 28 countries. In these countries Autoliv has 80 facilities including 18 Tech Centers and 20 Crash Test tracks. (Autoliv, 2014)
1.2 Pedestrian Protection System
In the event of a car-to-pedestrian impact the pedestrian can suffer from impacts with the bumper, hood and windscreen. The design of the front-end of the car and the structural stiffness have a significant influence on the kinematics and injury risks of the pedestrian body (Venkatason et.al. 2014). Vehicle crash data in the US, Germany and Japan has shown that the head is the most frequently injured part of the human body (Fredriksson et.al. 2011).
Depending on the length of the front-end of the car, the head impact location will differ. For a standard family car, the head impact for adults will be on the hood whereas in smaller city cars, the head impact will be on the windscreen and/or the hard area between the hood and the windscreen. For small city cars impacts on the A-pillars are also common. (Autoliv, 2014)
In the car industry, a special Wrap Around Distance (WAD) which measures the distance from the ground to a point on the hood along the front structure of the vehicle as shown in figure 1 is widely used when designing a car. (Euro NCAP, 2015) The points on the hood are where the head impact is estimated to occur. For a child or a
small adult the head will most likely hit the area from WAD 1000mm to WAD 1500mm and for an adult the head will likely hit the area from WAD 1500mm to WAD 2100mm.
Figure 1. WAD illustration
Today the hoods used in cars are commonly made from aluminium. Aluminium is a low density metal which is easily processed and is suitable for cold forming (Ullman, 2003). The soft hood structure have the ability to absorb energy during the impact and give a reduction of the HIC, Head Injury Criterion. (Masoumi et.al 2010). To let the hood deform it needs to be lifted to give a clearance above the rigid engine structure beneath. Studies made by Fredriksson have shown that in a car-to-pedestrian impact in 40km/h the hood must be lifted 100mm to create minimum injuries. This is done by hood lifters with stops that limits the lift height. (Autoliv, 2014)
A headform to windscreen study have been made at Autoliv where the tested windscreens shows HIC values below 1000. HIC values and their meaning will later be described. The windscreen is considered as a soft structure with low HIC and is feasible for a head impact. However the HIC values increase further to the A-pillar area and the cowl. (Wingren, 2009)
An impact on the cowl and also on the hard A-pillars require a pedestrian protection airbag to enable a soft impact. (Autoliv, 2014)
2
Problem formulation
In smaller cars, a hood lift gives required clearance between the rigid engine structures. Due to the fact that the front end of the car is small, the WAD impact points will be on the windscreen, the cowl or on the A-pillars. The hood lifters do not provide any protection in this area however an airbag, which is a rapidly inflated cushion placed over the rigid structure, will give a soft landing spot upon impact.
Autoliv Sverige AB is today developing a Pedestrian Protection Airbag, (PPA) which lifts the hood itself, replacing the hood lifters.
2.1 Purpose
The purpose of this study is to examine how fast the hood can be lifted 100 mm using the pedestrian protection airbag. The definition of a movable hood is: (Euro NCAP, 2015)
“All structures connected to the hood that move with the whole assembly when activated in a pedestrian impact. The rear end of the hood is the most rearward point of the movable hood when it is closed.”
A concept generation session will be performed where modifications of the current pedestrian protection airbag, for a faster hood lift, are to be proposed. The generated concepts will proceed to a concepts screening session where positioning and repetitive behavior of the PPA is highly prioritized.
Winning concepts proceed to testing where the performances such as lifting time of 100 mm, positioning and pressure distribution time are tested.
2.2 Delimitations
This is an initial study of a hood lift which will lead the way to further development to cover a whole functional system. Exact calculations of the functions in the concepts will not be made. The concepts will not have an optimal performance. Performances in low temperature, -35 ºC, and high temperature, +90 ºC, are not going to be examined. The verification of the concepts are limited to only two tests per concept with no fullscale testing which would include a wiper system and shear pins on the hinges. Also no Free Moving Head, (FMH) tests are made.
3
Literature studies
3.1 Priorities of pedestrian protection – a real life study of
severe injuries and car sources
The German In-Depth Accident Study, (GIDAS) is an organization specialized in accident research. GIDAS provides information on vehicle safety to automotive and supplier industries. In the database of GIDAS, information and documentation of real life accidents are stored and available for researches and developers. (GIDAS, 2015) In GIDAS, information of car-to-pedestrian accidents since 1999 are stored where the injuries of the pedestrians spread from moderate injuries to severe injuries. To classify the injuries, GIDAS uses the Abbreviated Injury Scale, AIS which denote the injuries with a number from one to six depending on the severity of the injury. AIS1 denote a minor injury and AIS6 denote maximal injury, AIS1+ denote at least a minor injury. (Fredriksson, 2010)
In the event of a car-to-pedestrian collision, the collision starts by the pedestrians legs getting impacted by the car bumper. The body of the pedestrian wraps itself around the car body followed by a chest impact. Lastly the head impacts on the hood and/or the windscreen area. According to GIDAS, for severe AIS3+ injuries on adult pedestrians, the windscreen was the major source followed by the hood. The major source of the child pedestrian injuries was caused by the hood followed by the windscreen. (Fredriksson, 2010)
In Fredriksson’s study of severe injuries and car sources, the injuries of the pedestrians were divided into five body regions: Head, neck, chest, arms and legs.
The study is based on data from GIDAS database ranging from 1999 to 2008 where only AIS3+ injuries, which denote a serious injury of the pedestrian, were examined. In 1030 cases of injured pedestrians studied, 161 were AIS3+ classified. The study showed that
43% of the pedestrians sustained head injuries
37% of the pedestrians sustained chest injuries
58% of the pedestrians sustained leg injuries The injuries in the rest of the body regions were neglected.
3.2 The Head Injury Criterion (HIC) functional
The HIC is a tool used by Euro NCAP to measure the head injuries upon an impact with, for pedestrian protection, a vehicle structure such as the hood and the windscreen area. The HIC tool is defined by the acceleration of the head impact of the pedestrian:
𝐻𝐼𝐶
={
[
1 𝑡2− 𝑡1∫ (√
𝑎(𝑡)𝑥 2 + 𝑎(𝑡) 𝑦 2 + 𝑎(𝑡) 𝑧 2)
𝑑𝑡 𝑡2 𝑡1]
2.5(
𝑡2 − 𝑡1)
}
𝑚𝑎𝑥Euro NCAP uses a headform with three perpendicular accelerometers attached to the center of mass of the head to measure the accelerations ax, ay and az to obtain data for
the HIC computation. The acceleration measurement data is plotted as a function of time where t1 is the time of an initial head contact and t2 is the time when the head
leaves the contact area. (Euro NCAP, 2015; Hutchinson et. al. 1998)
In an impact with a rigid vehicle structure the retardation of the head results in high HIC values. The HIC functional is used by automobile manufacturers to assess the quality of the design of the vehicles to meet the Euro NCAP requirements. The vehicle structures are optimized to absorb the energy of a head impact to achieve minimum HIC values. (Hutchinson et. al. 1998)
The Federal Motor Vehicle Safety Standard, (FMVSS) are standards written in terms of minimum performance requirements for vehicles. According to FMVSS 201, a HIC value over 1000 is not approved. The performance is given under an impact condition featuring a head form which freely moves at a velocity of 40 km/h and impacts on the structure of a vehicle. (FMVSS 201, 1995)
3.2.1 HIC measurement limitation
In the event of a head impact on the vehicle structure, the impact results in both translational and rotational acceleration of the head. The accelerometers in the head forms used in testing, are limited to linear accelerations where the rotational acceleration is ignored. (Hutchinson et. al. 1998)
The rotation of the head leads to high neck injury risks. Even with a HIC value under 1000 the neck may break. (Hutchinson et. al. 1998)
A HIC value measure is not always a reliable method due to its limitations. A lot of engineering judgments need to be implemented for the best results.
3.3 Influence of impact speed on head and brain injury
outcome in vulnerable road user impacts to the car
hood
Improvements of the pedestrian protection and new requirements have changed the way to design and develop pedestrian-friendly vehicles. The Euro NCAP requirement for a HIC value on a head-to-car impact is HIC≤1000 at a velocity of 40 km/h. A HIC value over 1000 is not approved. (FMVSS 201, 1995)
Automotive manufacturers aim to minimize the HIC values. By developing a deformable and soft vehicle front end, the vehicle structure absorbs the energy of the head impact to achieve minimum HIC values.
Figure 2 summarizes the head-to-hood impact tests performed by Fredriksson (2007). For each under-hood distance the tests were performed for different velocities.
Figure 2. Illustration of the relation between HIC values, hood lift distance, and car velocities upon impact
The result of the testing that is to obtain HIC values below 1000 in a velocity of 40 km/h, the under-hood distance must be at least 100 mm.
4
Theory
4.1 Gas and pressure
For a substance there are usually three different phases – solid, liquid and gas phase, as shown in figure 3. These phases are due to pressure and temperature. In low temperature and high pressure the substances are usually liquid and in high temperature and low pressure the substances are in a gas phase. (Cengel & Boles, 2011).
Figure 3. Illustration of the solid, liquid and gas phase
In a solid phase the intermolecular bonds between the molecules are strong which makes them fixed in a position. In a liquid phase the intermolecular bonding are weaker
increasing heat makes the atoms in the molecules vibrate in the liquid phase. In a gas phase the intermolecular bonding is the weakest which results in a random movement of the molecules. Due to the random movement, the molecules collide with each other and on obstacles, like for example the walls of a container. (Cengel & Boles, 2011) To inflate an airbag Autoliv uses two different types of inflators; pyrotechnic and Hybrid inflators. In both types, solid propellants are combusted using voltage applied to a squib. This creates heat which changes the solid phase of the propellants to a gas phase. The heat of the gas created is too high to inflate the cushion and has to be cooled down. The cooling procedure of the inflators differ. In a pyrotechnic inflator the gas is cooled down by a metal filter while passing through. For hybrids, the inflators have, besides the propellants, stored gas. The gas generated by the propellants is mixed with the stored gas and results in a gas mixture with reduced heat. (Odwong, 2003)
When the gas enters the cushion it starts hitting on obstacles, wherever it’s the cushion wall or the air inside the cushion. The wall can be seen as a solid which have a higher density, matter per unit volume, than gas. When the gas collides with the wall the molecules of the gas can’t pass through. Due to the elastic characteristics of the molecules, a bouncing effect forces the gas molecule movement to change direction. The density of the air inside the cushion is lower than the density of the gas. The gas molecules pass through the air molecules and inflates the cushion. This scientific principle is applied on hot air balloons. (Cengel & Boles, 2011)
When the gas is inflating the cushion, a pressure is building up. In the cushion the pressure is due to gas molecules colliding with the cushion wall and exerting a force on it. The pressure generated is a strong function of the density and the temperature. Too much gas in the cushion give high density and high pressure of the gas inside the cushion which lead to a solid characteristic of the cushion and results in high HIC values upon a head impact. If the amount of gas in the cushion is low, both the density and the pressure is low. This lead to the head form traveling far into the cushion and is likely to hit the rigid structure underneath. (Cengel & Boles, 2011)
4.2 Material science
When the cushion is inflated, a pressure is building up and the hood is lifted rapidly. If the initial contact area between the hood and the inflated cushion is small, high forces created by the gas pressure will act on the hood. This assumption is based on the formula:
𝐹𝑜𝑟𝑐𝑒 = 𝑃𝑟𝑒𝑠𝑠𝑢𝑟𝑒 × 𝐴𝑟𝑒𝑎
High forces on a small area will bend the hood, creating a plastic deformation in the material upon a hood lift. The plastic deformation is a hardened area of the material which results in high HIC values upon a head impact to the hardened area. In order to
reduce risk of a plastic deformation of the hood material, a deeper scientific understanding of the strength of materials and material science is needed.
When shaping the hood in a manufacturing process, the hood is exposed to plastic deformation. The plastic deformation is 2-4 % and give the hood a hardened surface. The hood meets the Euro NCAP requirements but further deformation might lead to not high HIC values.
The general material of the hoods used in today’s vehicles is as described earlier Aluminium. In Aluminium the atoms cooperate through bonds and arrange themselves in crystal lattices. Figure 4 shows an ideal crystal structure. In the atom arrangement however, defects occur partly by natural causes. The defects can be: (Ullman, 2003)
Vacancies – a missing atom creates an unoccupied place in the lattice
Substitution atoms – foreign atoms located on a regular atom position in the lattice
Interstitial – foreign atoms located in the lattice cavity
Dislocation – a defect in the lattice construction These defects are shown in figure 5.
Figure 4. Illustration of an ideal crystal structure
Figure 5. Illustration of the defects occurring in the crystal structure due to atom arrangements
When the hood is lifted the material is exposed to tensile and compression forces. In the crystal structure, shear stress will arise and when the stresses reach a certain value
Atom Bonding Vacancies Substitution atoms Interstitials Dislocation
the dislocation will change atom layer. If the shear stress is kept and no obstacles stops the dislocation, the dislocation will run through the crystal and a plasticization of the material will occur.
When the dislocation moves the lattice is stretched and cavities are created. Foreign atoms in form of substitute atoms and interstitials seeks to the area around the dislocation and attaches themselves to the lattice. The different types of foreign atoms around the dislocation create a firm lock for the dislocation and the shear stress which would normally make it move have to increase. (Ullman, 2003)
This is why a plastic deformation of a material results in a hardened area which needs to be reduced to obtain low HIC values.
4.3 Strength of material
As described in the material science chapter, the hood material is exposed to tensile and compression forces when lifted. In the crystal structure of the material, shear stress arises and are the basis for a plastic deformation of the hood material.
To illustrate shear stress, τ a block has been glued to a wall and a vertical force is acting on it as shown in figure 6. The shear stress acts along the cut surface and is dependent on the contact area between the block and the wall. (Niklasson, 1997)
Figure 6. Illustration of the shear stress principle
The shear stress can easily be calculated using 𝜏 =𝐹 𝐴
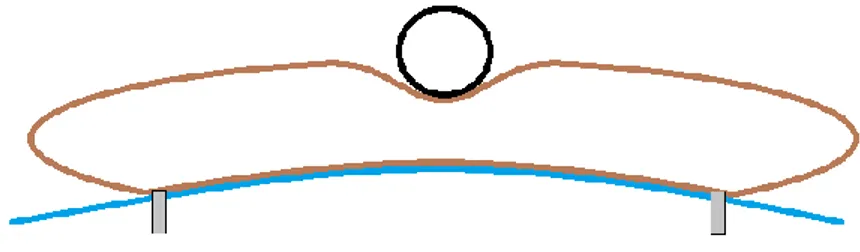
In the event of a hood lift, the airbag is inflated with gas. Initially the distance between the hood and the cowl has been measured to approximately 50 mm depending on the car design which is illustrated in figure 7.
Figure 7. Illustration of the hood placement over the cowl
The airbag is located between the hood and the cowl and when deployed, the cowl acts as a rigid structure and give the cushion a support. The cushion is inflated and pushes the hood upwards giving it a lift. As described by the shear stress formula, a high force acting on a small area on the hood will give high shear stresses which could lead to a plastic deformation of the hood material, as shown in figure 8. This illustrates a bad concept.
Figure 8. Illustration of a point load acting on the hood
With a distributed load acting a larger area on the hood will give lower shear stresses, reducing the risks for a plastic deformation of the hood material as shown in figure 9. This illustrates a good concept.
Figure 9. Illustration of a distributed load acting on the hood
By distributing the gas on a larger area, the forces acting on the hood are reduced. This however give a slower hood lift. High forces acting on the hood give a faster hood lift but the risks for a plastic deformation is also higher.
4.4 Pedestrian Protection Airbag
When the airbag is deployed it has to be positioned over the stiffer, compared to the hood, structures of the car. Figure 10 shows the positioning of the airbag used as a reference in this thesis. A study made on Autoliv shows how the airbag attachments to the hood affects the stiffness of the airbag and the related HIC values. (Lindberg & Östling, 2014) A Cowl P Airbag Airbag P A
A – Projected contact area between the cushion and the hood
P – The pressure inside the cushion F – Illustrates point load
A – Projected contact area between the cushion and the hood
P – The pressure inside the cushion F – Illustrates distributed load
Figure 10. Illustration of the cushion positioning used as reference
Figure 11 shows a simplified illustration of the principal forces created by a head-to-cushion impact. F1 is the force of the head form striking the cushion in the projected
contact area, A1. The pressure inside the cushion is P. F2 is the reaction force, created
by F1, and is distributed on the projected area which is twice the area A1.
𝐹2 = 𝑝 × 𝐴2
𝐹1 = 𝑝 × 𝐴1
Figure 11. Illustration of the scientific principle of a head-to-cushion impact with A2=2A
The ratio between the forces are 𝐹2 = 2 𝐹1 if the projected area A2=2A. If the projected
area is 1.5A, the ratio between the forces will be 𝐹1= 1.5 𝐹2.
According to Newton’s 3rd law, two bodies affect each other by equally but opposite forces. When the head impacts the cushion with a force, the same force affects the head form and when the distributed force, F2 is pushing on the cowl area, an equally large
force is oppositely directed. The larger the projected area is the lower the force per area is created due to the force being distributed.
This is implemented in a pedestrian protection airbag. Wide attachment placements give a larger contact area due to the fact that the cushion is forced to take the same shape as the hood. This lead to a stricter cushion towards the cowl as shown in figure
12 which increases the HIC values upon a head-to-cushion impact because of the high acting forces. Wide attachments however, thanks to the large restricted area of the cushion, also works as a guidance for the positioning upon deployment. 30mm lugs at 570 mm from the middle of the hood along both directions of the y-axis are chosen as a reference due to that they are judged to perform best in positioning the cushion in a deployment test. (Lindberg and Östling, 2014)
Figure 12. Illustration of a head-to-cushion impact with wide attachment placement
If the attachments of the cushion are placed further to Y0 which represents the middle of the hood, the contact area gathered will be small. This is due to the cushion not being restricted as shown in figure 13. The cushion ends are freely moving which affects the positioning negatively. In HIC value aspects, near Y0 placements of the attachments are good. As described and shown in figure 11 the small projected area A2 give rise to
small forces.
Figure 13. Illustration of a head-to-cushion impact with close attachment placement
The wider the attachments are placed, the stiffer the cushion becomes which lead to higher HIC values. For an optimized performance of the cushion, the cushion need to have the correct positioning to obtain low HIC values upon a head-to-cushion impact.
4.5 Concept Development
When a new idea for a problem solving product or solution is generated a development phase is started. The idea can be generated by a need or a new technology. To assure a
good solution for a problem a large amount of concepts are generated. A concept describes the technology, working principles and the design of the product or solution which is expressed as a sketch and a textual description. The amount of concepts generated are decreased by concept selection stages where the concepts are tested upon different criteria’s until a winning concept is chosen. (Ulrich & Eppinger, 2012)
4.5.1 Clarification of the problem
If a problem or a product which is to be developed is complex, it could be difficult to understand what to improve. To develop a deeper understanding of the problem, the problem is decomposed into simpler sub problems. These sub problems can be to break down a function, a design or a component. The sub problems are focused on individually and when the decomposition is done, the development team have a five minute discussion on which sub problem is the most critical and should be addressed first for the success of the product. (Ulrich & Eppinger, 2012)
4.5.2 Consultation of experts
When searching for solutions an external search is used. An external search is an information-gathering process which contains an expert consulting stage. Experts includes professional consultants, technical representatives and experts at the firm. The experts can provide valuable information from their knowledge’s of the different subproblems. Direct solutions can also be provided and the experts can give ideas for further investigation. (Ullrich & Eppinger, 2012)
4.5.3 Brainstorming
Brainstorming is an internal concept generation process which is ideally first performed individually and then in groups. In an individual brainstorming every concerned personal is spending a couple of hours alone to generate concepts. A group session is scheduled where the individuals get together to discuss and improve the concepts generated. A brainstorming activity is the most open minded session in a product development project where the creativity and knowledge of personal and development team members is used to generate concepts. (Ullrich & Eppinger, 2012)
To improve the brainstorming session both an individually and in a group, Ullrich and Eppinger have listed four useful guidelines (2012):
Guideline No.1: Don’t judge the generated concepts
During the concept generation sessions, the concepts are not allowed to be judged or criticised. Judging a concept can lead to insecurity and have a bad influence for the continuing concept generation sessions.
Guideline No.2: A large amount of ideas should be generated
The larger the amount of concepts generated the lower the chances is to miss a valuable concept or a solution. With no limitation of generated concepts, ideas that
at first seemed infeasible for some attendants is now worth mentioning which increases the chances of finding good solutions or concepts.
Guideline No.3: All ideas are welcomed, even if they seem infeasible
In a brainstorming session many ideas can seem good and is accepted. Even if some ideas can seem infeasible all ideas should be welcomed. A bad idea can be improved and therefore an infeasible idea can turn into being a valuable idea.
Guideline No.4: The use of graphical and physical media, when possible, should be implemented
An oral description of a design might be difficult to understand. For a complete understanding the language needs to be complemented with graphical sketching.
4.6 Concept selection
When the concept generation session is finished, a large amount of concepts are generated. The concepts continue to a concept selection stage where concepts are evaluated with respect to criteria’s set by the development team. For this thesis, Autoliv evaluation matrix has been used for the concept selection process. To eliminate the risks of personal favourites winning the concept selection, the session is done within the development team.
4.6.1 Autoliv evaluation matrix
Autoliv Evaluation Matrix is a combination between a concept screening and a concept scoring matrix and is used in the process of selecting one or many winning concepts to proceed to the testing phase. In the evaluation matrix, relative strength and weaknesses of the concepts are compared and ranked. Appropriate criteria’s used in the evaluation matrix are according to Autoliv:
Function
Packaging
Price
Assembly
Development cost
Risk and time
The criteria’s are only headlines which is of standard use. Each headline is filled with appropriate parameters for the different projects and product developments. After the ranking the best concept wins. There can be more than one winning concept. If two or three concepts have a close ranking an engineering judgement is implemented and the development team makes a decision on which concepts to go further with.
5
Concept development
Since this thesis work is done for a pre development department at Autoliv there is no specific OEM, original equipment manufacturer, customer. The projects are internally funded and are presented to customers. If successful they go further to an application department where the product is further developed to meet the customer requirement. The target specification will be defined by the project. Since these are new products, there is no other product in the market to compare with. Everything done in this thesis work is an initial study on an ongoing development project.
5.1 Parameters
To be able to develop a successful product, a number of parameters has been established. The parameters will act as guidelines for the development of the product and ensure that the concepts generated are technically and economically stable. The parameters are set by the PPA development team and are listed below:
Cushion coating integrity
Cushion covering area - positioning
System interaction – avoidance of obstacles
Deformation of hood
HIC value on hood
HIC value on bag
Gas expansion inside the cushion
5.2 Concept generation
After clarifying the problem and developing a general understanding of the principle of lifting a hood using a PPA, a list of identified problems were created. The problems are
The hood needs to be lifted in Y0 to create a hood contraction which will slide out the shear pins in the hinges
The hood must have a plastic deformation which is soft enough to lower the risk for high HIC values.
The airbag must first give an adequate hood lift distance to obtain low HIC values and then position itself above a coverage area.
Understanding and identifying the problem opened up the ability for both internal and external searches for solutions. The main focus on the search was the functionality but other aspects as costs and the ease of manufacturing was taken in consideration.
The external search was performed by consulting experts on inflatable curtain, IC, platforms, whom are working with developing products which have functions that direct the airbag to an intended direction. The experts presented their products and gave a number of ideas for the concept generation stage.
In the internal search a brainstorming session was performed which included an individual and a group session. The attendants was employees that are in some way working with PPA. These employees are PPA development team members, Textile development team members and Autoliv Research team members. Each of the team members provided ideas and solutions from the individual sessions which was presented and discussed in the group session.
6
Patent infringements
When the concepts were generated a search for patent infringements was made by Autoliv patent office. The search was divided into an internal and an external search using Autoliv Patent Information System, APIS for the internal search and Orbit Questell for the external search.
The search in APIS was made to find out if Autoliv already have patented similar solutions. If that’s the case it is ok to use it. If a patent search shows infringements on a patent owned by a competitor or anyone else, the patent need further examination and decision whether to drop the concept or to by the rights to use the patent.
6.1 Found patents
The folding’s used in some of the generated concepts are patented by the PPA development team in Autoliv. The folding’s are used in other products but the function can be implemented in the concepts of an airbag lifting a hood. No further infringement search in this area was made because the patents are already owned by Autoliv. Three patents were found that had similarities with some of the generated concepts. These patents are presented in table 1. The components are similar but not the function. A concept may use a component to control a gas expansion where a similar component is patented but for another type of function. In this case some adjustment can be made on the generated concept to make it unique.
Of all of the generated concepts, Richard Erixon, a patent engineer on Autoliv made the decision that it is possible for patenting 3 of the generated concepts.
7
Concept selection
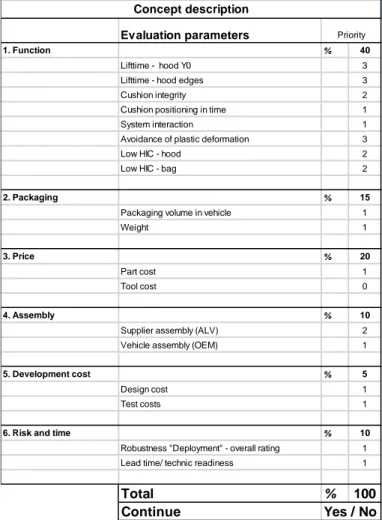
A multivoting session performed by the PPA development team narrowed down the numbers of concept to 10. These concepts went further to the Autoliv evaluation matrix where they were evaluated with respect to criteria’s set by the PPA development team. A cut out of the evaluation matrix, shown in figure 14, shows the headlines and the content of each criteria. The parameters that guided this study are included and standard parameters such as part cost, tool cost, design cost etc are used in the evaluation matrix. To eliminate the risks of personal favourites winning the concept selection, the concept selection session was performed by the PPA development team consisting of four engineers.
After evaluating and ranking all the concepts there were five concepts that excelled themselves from the rest with scores from 61 to 63 comparing with 41-59. This can be shown in appendix A where a complete and detailed version of the Autoliv evaluation matrix can be found. The five winning concepts B, F, G, I and J are proceeded to a performance test where lift time, cushion integrity, positioning and hood deformation are tested.
Patent No. Title Status
EP 2 492 156 B1 Pedestrian protection airbag for a vehicle Granted/Published EP 1 349 752 B1 Scuttle area airbag for pedestrian protection Granted/Published CN 203946059 U Pedestrian protection airbag Granted/Published
Figure 14. Cut out of the evaluation matrix showing the criteria’s
7.1 Equipment
The equipment used are regular, no special, components which are manufactured by the car industries. In the testing, the components represents the behaviour of a general city car.
7.2 Body in white, BiW
A body in white, BiW is a car body in the manufacturing stage where the sheet metal have been welded together. For this testing a BiW representing a small city car is used as shown in figure 15. To simulate a real environment for the airbag deployment, important areas such as the windscreen, the hood, the hinges and the cowl coverage are prepared and examined.
Evaluation parameters
1. Function % 40
Lifttime - hood Y0 3
Lifttime - hood edges 3
Cushion integrity 2
Cushion positioning in time 1
System interaction 1
Avoidance of plastic deformation 3
Low HIC - hood 2
Low HIC - bag 2
2. Packaging % 15
Packaging volume in vehicle 1
Weight 1
3. Price % 20
Part cost 1
Tool cost 0
4. Assembly % 10
Supplier assembly (ALV) 2
Vehicle assembly (OEM) 1
5. Development cost % 5
Design cost 1
Test costs 1
6. Risk and time % 10
Robustness "Deployment" - overall rating 1
Lead time/ technic readiness 1
Total % 100
Continue
Concept description
Priority
Concept evaluation matrix: Small module PPA - Hood lift
Figure 15. The body in white used for the testing's
Due to the thesis being a pre-study for a hood lift, the cowl coverage is not designed. To simulate a cowl cover that will act as an impact point for the PPA a plastic sheet is used. The plastic sheet is cutted so it fits on the cowl area. The empty volume underneath the cowl cover is filled with foam to create a stiffer surface for the PPA to collide with as shown in figure 16.
Figure 16. Foam used to create a stiffer cowl surface
7.3 Hood
Figure 17 shows the hood used in the testing’s. The hood is a regular aluminium hood for small city cars which is suited for the BiW. Since these types of cars don’t have a hood mounted airbag there is no attachment for the airbag in the hood.
Three airbag attachments was created using a metal plate as a flat basis and threaded pop-nuts which made it possible to tighten the airbag in place using screws. Figure 18 shows the attachment placements and a supporting bent metal sheet was used to help direct the airbag deployment. The total weight of the airbag with one support and 3 attachments is 9,30 kg.
Figure 18. Welded attachment and support placement on the hood
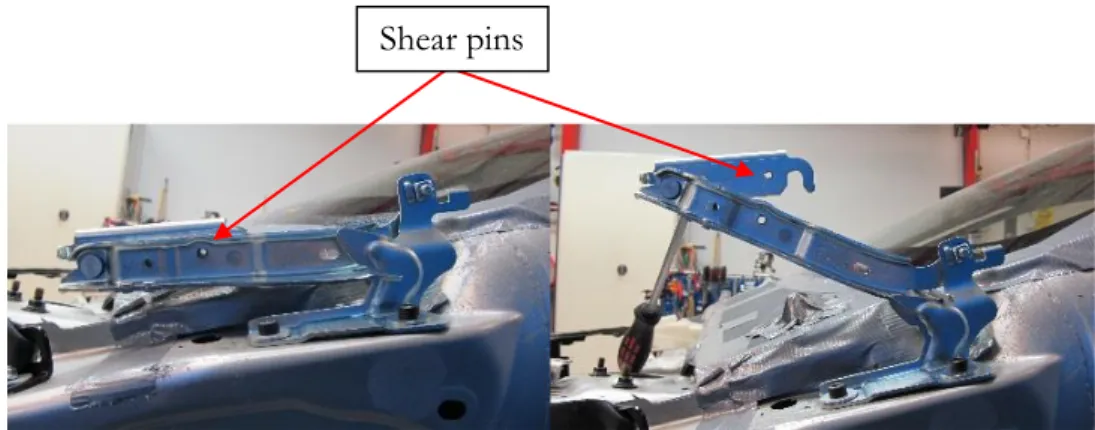
7.4 Hinges
The hinges used are a new type of hinges with the function of lifting the front end of the hood to enter the engine room and lifting the rear-end upon a pedestrian collision. In the hinges there is a shear pin, see figure 19, which secures rear-end lifting of the hood in normal use and driving. Upon a pedestrian collision the airbag deploys and give an initial lift in Y0 for the hood which makes the hood contract on the sides, sliding out the shear pins on the hinges and allowing the hood to lift. Figure 20 shows the hinges in a closed hood mode and in a lifted hood mode.
Figure 19. Illustration of closed vs. lifted hood mode of the hinge
Airbag attachments
Bent metal sheet
8
Measuring methods
8.1 Accelerometers
To measure the lift distance and lift time of the hood three accelerometers are placed on double sided tape on top of the hood. The accelerometers are able to handle 2000g and are used to measure the acceleration of the hood from a stationary point to the lift height of 100 mm in absolute direction. In earlier testing accelerometers of 1000g was used but due to the fact that this type of testing is going to be more intense because of the initial lift in the middle, the accelerometers had to handle larger accelerations. The accelerometers located at the sides (2) in figure 20 are located above the hinge attachments. The accelerometer in Y0 (1) in figure 21 is placed as near the hood edge as possible.
Figure 20. On-hood placements of the accelerometers 8.1.1 Diadem
The measurement data gathered from the accelerometers are stored in different tables. To convert the acceleration data into lift time and lift height a software tool called DIAdem is used. DIAdem is developed by National Instruments, NI and is used to quickly and easily visualize, inspect and analyse measurement data collected during data acquisition. (National Instruments, 2015)
In DIAdem the acceleration measurement data is located in one channel and the time measurement data is located in another channel. Integrating the acceleration measurement data once gives the corresponding velocity of the hood lift. DIAdem uses the trapezoidal rule as the integration method. (National Instruments, 2015) The measuring data was not filtered. Integrating the velocity data, the distance data is
2
obtained. This is done for all three accelerometers and the result is presented in a distance-time graph.
When using accelerometers small errors occur. These errors is due to calculation errors and measuring quality. The quality of the accelerometers is due to their resolution. The higher the resolution is, the more measuring points are obtained which minimizes the errors.
To confirm the result a second measuring method is used.
8.2 Patrick marking
A Patrick is a marking, see figure 21, used by Euro NCAP and Autoliv to follow and measure the deformation or displacement of car structures and occupants. For this testing the Patricks are used to analyse the displacements and time of the hood lift.
Figure 21. Illustration of a Patrick marking
The Patricks are placed on the right side of the BiW in front of the camera, as shown in figure 22. Patrick No. 1 and 2, see figure 22, are placed on the rigid BiW along the x-plane and represents the starting position. The Patricks are placed at a distance of 300 mm between the centres of the markings. Patrick No. 3, see figure 22, is placed on the hood along z-direction above Patrick No. 2. Patrick No. 3 is the only moving marking and when measuring the displacement, the marking is tracked and the displacement is an ongoing comparison between the starting positions and the current position for Patrick No. 3. To minimize errors in the measuring method the Patricks must be placed on the same distance from the camera lens so that all Patricks are measured with the same pixel sharpness. In this testing the Patricks was placed on the z-x plane.
Figure 22. Placements of the Patrick markings 8.2.1 TEMA
TEMA is a world leading system for advanced motion analysis and is used to track moving objects, as in this case the lift of a hood. (Image Systems Motion Analysis, 2015) The “after test” images are imported into TEMA where the Patrick markings are located and defined by the operating engineer. The program runs the images and as the hood is lifted the program tracks the displacement and the time. When the TEMA analysis is done the data is stored in tables that can be imported into DIAdem and converted to visual distance-time graphs.
8.3 Camera
Two cameras are used to film the testing’s. Camera No.1 is located on a high altitude as shown in figure 23 and camera No.2 is located on the right side of the BiW as shown in figure 23. Both cameras used are photron fastcam sa8 and are filming with 3000 fps. (Photron, 2015)
Camera No. 1 is mainly used to film the airbag deployment, the airbag positioning and the contraction of the hood sides during the hood lift. Camera No.2 is used to film the movement of the Patrick markings and the hood behaviour upon lifting.
1 2
Figure 23. Camera placement and view 8.3.1 Falcon Extra
Falcon Extra is a software used to analyse motion processes. Multiple image sequences can be merged and compared. (Falcon, 2015) The “after test” images are imported into Falcon Extra where the films captured by camera No.1 and camera No.2 are synced. The hood and airbag behaviour is easily analysed from different camera views.
For this theses Falcon Extra have been used to create image sequences that describes the motion of the hood and airbag during deployment.
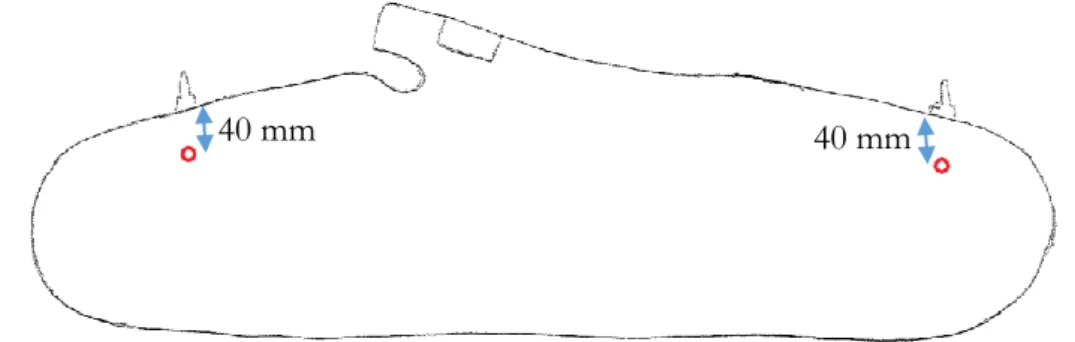
8.4 Pressure measurement
The pressure inside the cushion created by the amount of gas has to be examined upon testing. If the pressure is too high the cushion becomes stiff and the HIC values increases. If the pressure is too low the head can upon an impact reach the rigid structure underneath the cushion and give an increase in HIC values. This is based on the theory chapter on gas and pressure. The pressure distribution can differ depending on the design of the cushion. Pressure nipples was placed 40 mm from the outer seams of the cushion under the attachments as shown in figure 24.
Figure 24. Placements of the pressure nipples
40 mm 40 mm
9
Testing and results
The selected concepts went further to static testing where the performance of each concept was tested. The performance include the lift time of 100 mm for the most rearward section of the hood, positioning of the cushion and pressure distribution. The tests were carried out in a room temperature, RT environment.
For each concept two tests was carried out, one initial test and one confirmation test. All tests was measured by the three measuring methods described earlier, Patrick marking, accelerometers and pressure measurement.
In the tests the BiW acted as a rigid body, which can be seen in figure 16. The BiW is welded to a transportation rig with wheels that are fastened to the ground upon testing. Due to cushion deployment the BiW is not deformed however the hinges and the hood were deformed. Upon each test the hinges were bent back to a functional state which was manually controlled by the operator.
As the hood inventory at the company was small the same hood was used twice, i.e. for two tests. The hood was bent back to an initial shape upon the confirmation test. A deformed hood does not have the same properties as a new one. It was decided however that the difference is neglectable as long as the hood had the same form as a new one.
The test result is summarized in table 2. Each test number is listed with the concept and test result linked to it. The DIAdem and TEMA results is connected with figure 25 which shows where the results originates. At the positioning column a scale of three is made to describe the result where yellow is a state between OK and NOK.
Table 2. List of test results
In table 3, the concept result is linked to an appendix where further information can be found.
Table 3. List of concepts linked to appendices
10 Analysis and discussion
The deployment tests gave an initial idea of the performance of the concepts. To decide which concept had the best or worst performance, the test results need to be examined. The concepts with the fastest total lift time of 100 mm are the most desired but the lack of repetitive behaviour and a complete positioning are two factors that can ruin a concept.
After performing the tests, the data was placed in graphs and image sequences was made to capture the positioning of the cushion.
10.1 Time of hood lift of 100 mm
Accelerometers and Patrick marking was used to measure the travelled distance of the hood. Two different kind of measurement method was used because neither of the methods are 100% accurate. When using accelerometers small errors are obtained when integrating from acceleration to distance and when using Patrick marking, the placement of the Patricks are very important upon a video tracking where the slightest misplacement creates a differ in camera pixels.
To compare the concepts guidelines as the repetitive behaviour and lift time of the concept have been used.
10.1.1 Repetitive behaviour within the concepts
Each concepts was tested twice, one initial test and one confirmation test. The confirmation test was to see if the behaviour of the concept was repetitive. As presented in table 4 and shown in the corresponding figures, the results of the two test per concept was placed in the same graph to compare the lift distances and lift time for each test making it easier to follow the behaviour of the concepts. This was made for the three different locations; right, left and mid as shown in figure 25.
Table 4. List of test results for each concept
Comparing the tests of each concept we can see that they are almost identical in a lift time performance. Concept B, G and I have a differ of 1 ms between first and second test and are excelling themselves from concept F and J which has a differ of 3 to 4 ms. Looking at the TEMA analysis, where the measurement are made on the right side of the BiW, we can see that the values are higher than the Accelerometer data. As have been described in this thesis, the measuring methods are not 100% accurate which is the reason for the difference in lift time comparing TEMA with Diadem. In the TEMA column in table 4 we can see that the difference is approximately 4 ms. The TEMA measurement is used just to compare the two measuring methods in case of an unreliable value from the accelerometer occurs.
Figure 26. Test results for concept I plotted into a time-distance graph and a DIAdem vs. TEMA comparison.
Concept Test No. Left (ms) Mid (ms) Right (ms) TEMA (ms) Figure
B T-15050291/92 31/31 15/16 29/29 32 29
G T-15050293/94 31/31 14/15 31/30 34 30
F T-15050290/95 31/31 19/15 31/29 33 31
I T-15050286/87 30/30 13/15 28/28 32 27
Figure 27. Test results for concept J plotted into a time-distance graph and a DIAdem vs. TEMA comparison
Figure 28. Test results for concept B plotted into a time-distance graph and a DIAdem vs. TEMA comparison
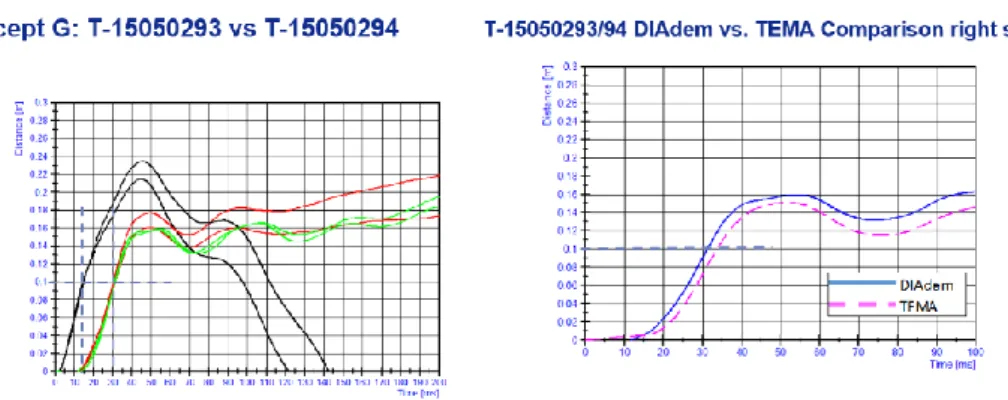
Figure 29. Test results for concept G plotted into a time-distance graph and a DIAdem vs. TEMA comparison
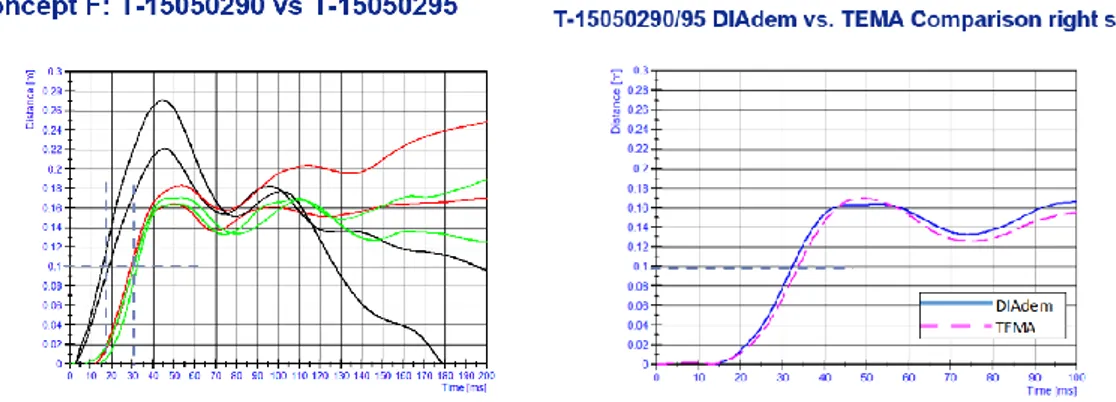
Figure 30. Test results for concept F plotted into a time-distance graph and a DIAdem vs. TEMA comparison
10.1.2 Comparison of lift times for all concepts
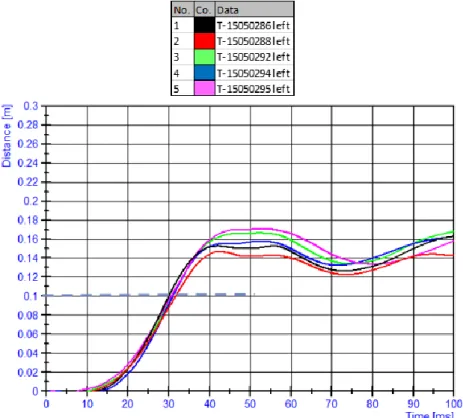
10 tests are narrowed down to 5 because of the repetitive behaviour of the concepts. The tests showed the same behaviour for each concept so one of the got to represent the concept. To compare the 5 different concepts with each other the test curves was placed in one graph. Figure 31 shows the lift time in Y0 for all concepts. As seen it spreads from 13 ms to 19ms. In figure 32 the lift time for the left side is presented where it spreads from 28 to 31 ms. Figure 33 shows the lift time on the right side which spreads from 30 to 34 ms.
As seen on the test results for the different concepts, the performance of the lift time had in fact no significant difference. The difference is in average 4 ms among the concepts which is 0,004 of a second. That is an acceptable value when looking on a real life case if a pedestrian gets hit by a car.
10.2 Pressure
Due to the fact that no tests has been made to obtain HIC values, the pressure measurement cannot be analysed. For this study the pressure measurements have been used to see how the pressure is distributed in the different concepts. The difference between the pressures inside the cushion in the different concepts are neglectable in deployment and positioning.
10.3 Positioning
The positioning of the cushion was a big drawback for this study. As described in the thesis this study is a pre study for a hood lift using a PPA. No similar products or functions are available on the market. This, as a result, lead to no compatible components to use for these kinds of hood lift tests. The hood does not have an airbag area where the airbag just can be mounted on so airbag attachments and airbag supports have to be manufactured and welded on the hood.
The supports work as a wall behind the airbag which forces the airbag to deploy along the windscreen and to not be pushed under the hood. The problem is that the more support the heavier weight is put on the hood and the more work needed to lift the hood. This leads to a slower lift time for the hood. To keep the hood weight as realistic as possible for this tests, minimum supports was used.
The result was not as expected. The cushion did not position itself as intended as shown in figure 34, which is a random picture taken from one of the appendices describing the positioning. The cushion was tilted and a large volume of the cushion was stuck under the hood.
The problem with a stuck hood is due to weak supports. Upon the deployment a reaction force is pushing the cushion in a direction under the hood. With weak supports or no support there are no obstacle that stops the bag from placing itself under the hood, the weak supports tend to bend and areas with no support opens the way for the cushion to travel. Strong supports would stop the cushion traveling under the hood and direct all forces along the windscreen, where the cushion will inflate and position itself. The problem with a tilted cushion is not only due to bad supports. In concept I and J the airbag attachments are moved further to the middle to obtain the function needed. As described in the theory chapter about positioning, the positioning gets worse which has been confirmed by the tests.
When moving the cushion attachments the idea was that the support would help the cushion to position itself but the tilted cushion result showed that the attachment placement was very important for the positioning and should not be changed.
11 Conclusions
The concepts generated for this thesis does not have an optimal performance. Due to the fact that this study is a pre study for a hood lift using a PPA, the concepts and the tests are an initial stage in an ongoing development project. The concepts generated for this study were good enough to lift the hood as fast as possible. No further complementation of the concepts is needed in a functional aspect.
After the deployment tests the concepts were compared with aspects on lift time, positioning and repeatable behaviour.
When it comes to the lift time all concepts showed almost the same behaviour which made it hard to decide which concept had the best performance. Further test data needed for the decision. When looking at the repetitive behaviour of the concepts, Concept B, G and I excelled themselves with a difference of only 1 ms between the concepts. This however does not make them winners without examine the positioning. The positioning of the cushion was a big drawback for the thesis, due to the lack of supports on the hood. The cushion was tilted and a large volume of the cushion was stuck under the hood. This affects the lift time in a way where a faster hood lift is obtained when a large volume of the cushion is stuck under the hood and vice versa. This behaviour occurred in every test which makes the test results reliable, however in the future when the cushion is positioned right, the cushion must be adjusted for the same hood lift time.
As described in the theory chapter about positioning, the wider the attachments are the better stability and positioning the cushion will have. This is seen when examine the positioning of the concepts I and J with the attachments moved further to the middle.
The positioning of concept I and J are presented in the pages 4 to 7 in appendix E and F.
The cushion attachments on concept B and G are not moved. The positioning of the concepts are more stable and symmetric, however a piece of the cushion volume is stuck under the hood. The positioning of concept B and G are presented in the pages 4 to 7 in appendix B and G.
To conclude the thesis work, concept B and G excelled themselves from all the concepts and a difference in the performances cannot be found.
This study was made to examine how fast the hood can be lifted 100mm using a pedestrian protection airbag which resulted in a hood lift of ~30ms. This study is however not finished due to the drawbacks, such as the positioning. Also no HIC value measurements have been done which could lead to changes of the concepts which might result in a worsen hood lift time.
In this thesis no calculations on costs such as material costs and manufacturing costs has been made. This can be the major aspect on choosing one winning concept but due to the fact that there is no time for a cost analysis in this thesis, the PPA development team will take over.
12 Future work
In this study, hood stops were not examined thoroughly but looking back at the thesis work the hood stop does have a big saying in the positioning of the bag. In the future work the hood stop should be designed to the hood after an exact 100 mm lift. This will restrict the cushion to be bent and position itself under the hood as shown in some of the tests.
When it comes to measuring methods the methods used today does not give exact measurements. The accelerometer data is integrated twice and for each integration a margin of error occurs. Also the measuring quality creates error because of the resolution of the accelerometers. The TEMA tracking measurement relies on the test engineer and lab technician to set the Patrick markings either on the exact same plane or have the exact measurements to the camera and between the Patricks.
A better method would be to use a laser that measures the hood lift using triangulation. To be able to measure the hood lift in Y0 using Patricks a bent metal plate can be placed on the hood with a Patrick marking attached on it pointing towards the camera. A second bent metal plate can be placed on the windscreen to work as a reference point. The concept development made in this study is based on the product design and development literature by Ulrich and Eppinger. The methods used in this literature are the best according to the writers but there are other methods such as the Toyota
concept choice method. In a concept generation process one method should not be enough. The development team might use several methods for best outcome.
References
1. Fredriksson R, Rosén E, Kullgren A. (2010). Priorities of pedestrian protection – A real-life study of severe injuries and car sources. Stockholm: Natur och kultur. 2. Autoliv Inc. (2014). Annual report [Electronic]. Available:
http://www.autoliv.com/Investors/Financial%20Reports/AR2014.pdf [2015-03-16]
3. Venkatason K, Abdullah K, Shastri (2014). The Head Injury Mitigation of an Adult and Child Pedestrian in a Frontal Vehicle Impact Using Response Surface Methodology. Switzerland: Trans Tech Publications.
4. Fredriksson R, Shin J and Untaroiu C. (2011). Potential of pedestrian protection system - A parameter study using finite element models of pedestrian dummy and generic passenger vehicles. Stockholm: Natur och kultur.
5. Euro NCAP (2015).Euro NCAP Assessment Protocol [Electronic]. Available:
http://euroncap.blob.core.windows.net/media/1436/euro-ncap-assessment-protocol-pp-v80-june-2014.pdf [2015-03-16]
6. Ullman, Erik & Bengtson, Ulf (2003). Materiallära. 14., [rev.] utg. Stockholm: Liber
7. Masoumi A, Shojaeefard M, Najibi A (2010). Comparison of steel, aluminum and composite bonnet in terms of pedestrian head impact.
8. Wingren, Magdalena (2009). Windscreen study using a free moving headform. Skövde: University of Skövde.
9. GIDAS (2015). Accident Research - GIDAS [Electronic]. Available:
http://www.vufo.de/forschung-und-entwicklung/gidas/?L=1 [2015-03-21] 10. Hutchinson J, Kaiser M, Lankarani H. (1998). The Head Injury Criterion (HIC)
functional. Department of Engineering. Wichita State University, USA. 11. FMVSS 201 (1995). Federal motor vehicle safety standards and regulations:
Standard No. 201 [Electronic]. Available:
http://www.nhtsa.gov/cars/rules/rulings/HeadRest/Head_Impact_Protection.h tml [2015-03-21]
12. Fredriksson R, Zhang L, Boströms O, Yang K (2007). Influence of impact speed on head and brain injury outcome in vulnerable road user impacts to the car hood. Stockholm: Natur och Kultur.
13. Çengel, Yunus A. & Boles, Michael A. (2011). Thermodynamics: an engineering approach. 7. ed in SI Units. Singapore: McGraw-Hill
14. Odwong Robert (2003). Introduction to inflators. Unpublished manuscript. Autoliv Sverige AB. Vårgårda.
15. Niklasson, Kjell (1997). Hållfasthetslära. Opublicerat manuscript. Trollhättan: Högskolan I Trollhättan/Uddevalla
16. Lindberg Ken, Östling Martin (2014). Headform to PPA Theory. Unpublished manuscript. Autoliv Sverige AB. Vårgårda
17. Ulrich, Karl T. & Eppinger, Steven D. (2012). Product design and development. 5. ed. Boston, Mass.: McGraw-Hill/Irwin
18. Diadem (2015). National Instruments [Electronic]. Available:
http://www.ni.com/diadem/ [2015-04-06]
19. Image Systems Motion Analysis (2015). Image Systems [Electronic]. Available:
http://www.imagesystems.se/image-systems-motion-analysis/products.aspx
[2015-04-06]
20. Photron (2015) Photron [Electronic]. Available:
http://www.photron.com/?cmd=product_general&product_id=37[2015-04-06] 21. Falcon (2015). Falcon Extra [Electronic]. Available: