Blekinge Institute of Technology
Thesis for the Master’s degree in Business Administration
Spring 2011
Key Success Factors in Business Intelligence
An analysis of companies primarily in Poland
and primarily from vendor perspective
Supervisor: Dr Klaus Solberg Søilen
Szymon Adamala
szymon.adamala@gmail.com
Linus Cidrin
2
Table of contents
Abstract ... 8
Acknowledgements ... 9
1.
Introduction ... 10
1.1.
Background ... 10
1.2.
Problem discussion and delimitations ... 10
1.3.
Problem Formulation and Purpose ... 11
1.4.
Delimitations ... 13
1.5.
Glossary ... 13
2.
Theory and literature review ... 15
2.1.
The importance of success criteria ... 15
2.2.
Frameworks of success criteria ... 16
2.3.
Discussion of success factors not classified into frameworks ... 23
2.4.
Other aspects relevant for BI success ... 25
2.5.
Literature review summary... 25
3.
Research Method ... 27
3.1.
Phases of research ... 27
3.2.
Sampling ... 28
3.3.
Choice of method ... 29
4.
Research results and analysis ... 32
4.1.
Analysis of individual variables’ impact on BI success ... 32
4.2.
Statistical model of Business Intelligence initiatives’ success. ... 38
4.3.
Measures Analysis - Question 22. ... 46
4.4.
Hypotheses Analysis ... 64
5.
Conclusion ... 73
5.1.
Non-technological problems dominate in Business Intelligence projects primarily in Poland
73
5.2.
Successful projects primarily in Poland share common factors ... 73
5.3.
Successful and non-successful projects primarily in Poland show differences in certain
factors 74
5.4.
Business Intelligence projects primarily in Poland have success factors that differ from IS
projects in general ... 74
5.5.
Clear objective measures for the CSFs can be identified ... 74
5.6.
A statistical model can be constructed that, to a certain extent, predicts success of BI
projects primarily in Poland ... 74
3
5.8.
Implications ... 75
5.9.
Suggestions for future work ... 75
References list ... 77
Appendices ... 80
Appendix I.
Survey questions ... 81
Appendix II.
Demographics of survey results ... 84
II.A.
By country ... 84
II.B. By project side ... 85
II.C.
By customer company ... 86
II.D.
By vendor company ... 87
II.E. By project role ... 88
II.F.
By project successfulness ... 89
Appendix III.
Survey results aggregated by country or region ... 92
Appendix IV.
Comparison of projects in Poland and outside of Poland ... 161
4
List of Figures
Figure 1 - Delone&McLean model for IS success ... 17
Figure 2 - Yeoh&Koronios model of success in BI ... 18
Figure 3 - Hwang & Xu structural model of data warehousing success ... 21
Figure 4 - Wixom&Watson statistical model of DW success ... 22
Figure 5 - Survey results for question 10 - How was the project funded ... 33
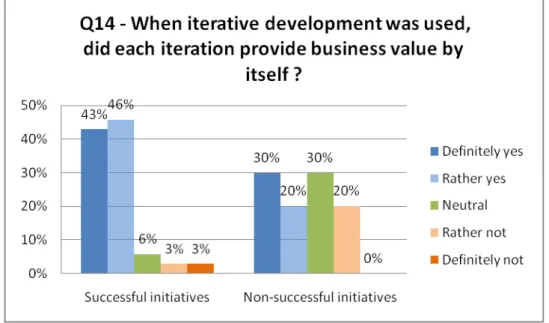
Figure 6 - Survey results for question 14 - When iterative development was used, did each iteration
provide business value by itself ... 33
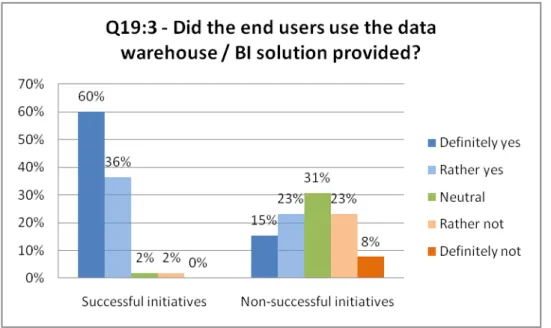
Figure 7 - Survey results for question 19:3 - Did the end users use the data warehouse/BI solution
provided ... 34
Figure 8 - Survey results for question 19:5 - Was there a clear strategic vision for Business
Intelligence or data warehouse ... 34
Figure 9 - Survey results for question 19:6 - Were the business needs that the project tried to solve
aligned to the strategic vision ... 35
Figure 10 - Survey results for question 19:10 - Did project scope definition concentrate on choosing
the best opportunities ... 35
Figure 11 - Survey results for question 19:12 - When an expert was assigned to a team or made
available to a team, was it always the best expert available ... 36
Figure 12 - Survey results for question 19:20 - Were non-technological issues encountered during the
project ... 36
Figure 13 - Survey results for question 19:18 - Were technological issues encountered during the
project ... 37
Figure 14 - Survey results for question 20 - From all the problems encountered, which were hardest to
solve - technological or non-technological ... 37
Figure 15 - Survey results for question 21 - From all the time spent resolving pending issues, most of it
was devoted to technological or non-technological problems ... 38
Figure 16 - Trivial PLS regression model ... 39
Figure 17 - PLS regression model with 5 significant variables ... 40
Figure 18 - PLS regression model with all transformed variables ... 42
Figure 19 - PLS regression model 4 - equivalent of model 2 with transformed variables ... 43
Figure 20 - PLS regression model with the best fit ... 44
Figure 21- Q22:1 Do you think weekly number of distinct users is a good measure of data warehouse
use? ... 46
Figure 22 - Q22:2 Do you think weekly number of queries submitted is a good measure of data
warehouse use... 47
Figure 23 - Q22:3 Do you think weekly number of logons is a good measure of data warehouse use? 47
Figure 24 - Q22:4 Do you think that mean response time for a request is a good measure for access to
subject matter experts? ... 48
Figure 25 - Q22:5 Do you think that percentage of requests responded within one business day is a
good measure for access to subject matter experts? ... 49
Figure 26 - Q22:6 Do you think that average number of questions needed to be asked per subject
matter issue is a good measure for subject matter expert quality? ... 50
Figure 27 - Q22:7 Do you think that the average number of available documents per subject matter
issue is a good measure for subject matter expert quality? ... 50
Figure 28 - Q22:8 Do you think that percentage of questions answered within one business day is a
good measure for subject matter expert quality? ... 51
5
Figure 29 - Q22:9 Is the percentage of man-days spent by business staff on a project an adequate
measure for whether there was enough business staff on the project? ... 52
Figure 30 - Q22:10 Is the mean time to resolve a business issue an adequate measure of whether there
was enough business staff on a project? ... 52
Figure 31 - Q22:11 Is the percentage of business issues resolved within a business week an adequate
measure of whether there was enough business staff on a project? ... 53
Figure 32 - Q22:12 Is the average number of weeks of duration for iterations a good measure for the
size of deliverable in iterative development?Percentage of total project time for each iteration ... 54
Figure 33 - Q22:13 Is the percentage of total project time for each iteration a good measure for the size
of deliverable on iterative development? ... 55
Figure 34 - Q22:14 Is the number of issues a good measure for data quality issues at source systems?
... 56
Figure 35 - Q22:15 Is the number of unresolved issues a good measure for data quality issues at source
systems? ... 56
Figure 36 - Q22:16 Is the average number of man-days of extra project work per issue a good measure
for data quality issues at source systems? ... 57
Figure 37 - Q22:17 Is the number of issues a good measure for data quality issues in BI system or data
warehouse? ... 58
Figure 38 - Q22:18 Is the number of unresolved issues a good measure for data quality issues in BI
system or data warehouse? ... 58
Figure 39 - Q22:19 Is the average number of man-days of extra project work per issue a good measure
for data quality issues in BI system or data warehouse? ... 59
Figure 40 - Q22:20 Is a calculated ROI a good measure of benefits quantification? ... 60
Figure 41 - Q22:21 Is a proposition on how the business intelligence capabilities enables the
realization of business strategy a good measure of benefits quantification? ... 60
Figure 42 - Q22:22 Is the calculation of contribution to the internal rate of return a good measure of
benefits quantification? ... 61
Figure 43 - Q22:23 Is the percentage of business benefits that have detailed written definition a good
measure of business benefits definition? ... 62
Figure 44 - Q22:24 Is the percentage of business benefits that are objectively measureable a good
measure of business benefits definition? ... 62
Figure 45 - Q22:25 Is the presence or absence of business benefits measurements process owner a
good measure of business benefits measurements? ... 63
Figure 46 - Q22:26 Is the monthly amount of time assigned for business benefits measurements
process execution a good measure of business benefits measurements? ... 64
Figure 47 - Most important factors in successful projects... 66
Figure 48 - Most important factors in non-successful projects ... 66
Figure 49 - Survey results for question 14 - When iterative development was used, did each iteration
provide business value by itself ... 67
Figure 50 - Survey results for question 19:5 - Was there a clear strategic vision for Business
Intelligence or data warehouse ... 68
Figure 51 - Survey results for question 19:6 - Were the business needs that the project tried to solve
aligned to the strategic vision ... 68
Figure 52 - Survey results for question 19:10 - Did project scope definition concentrate on choosing
the best opportunities ... 69
Figure 53 - Survey results for question 20 - From all the problems encountered, which were hardest to
solve - technological or non-technological ... 69
6
Figure 54 - Survey results for question 21 - From all the time spent resolving pending issues, most of it
was devoted to technological or non-technological problems ... 70
Figure 55 - Survey result for question 19:20 - Were non-technological issues encountered during the
project ... 71
Figure 56 - Number of answers per project place ... 84
Figure 57 - Number of answers in countries other than Poland ... 85
Figure 58 - Number of answers per project side (for all projects) ... 85
Figure 59 - Number of answers per project side (for projects in Poland) ... 86
Figure 60 - Number of answers per project side (for projects outside Poland) ... 86
Figure 61 - Number of answers per customer ... 87
Figure 62 - Number of answers per vendor ... 88
Figure 63 - Number of answers by project role ... 88
Figure 64 - Was the project you are describing successful? Percentage of answers (for all projects) .. 89
Figure 65 - Was the project you are describing successful? Percentage of answers (for projects in
Poland) ... 90
Figure 66 - Was the project you are describing successful? Percentage of answers (for projects outside
Poland) ... 90
7
List of Tables
Table 1 - (Wixom & Watson, 2001) Hypotheses findings ... 22
Table 2 - Factors used in PLS regression model 2 ... 40
Table 3 - Functions applied to variables ... 42
Table 4 - Variables used in the regression model with best fit ... 45
Table 5 - Spearman’s rank correlation coefficient for the correlation between the success of the
initiative and the different questions ... 65
Table 6 - Summary of veriables analysis ... 71
Table 8 - The support for the five hypoteses of the thesis ... 75
Table 9 - Survey questions ... 83
Table 10 - Survey results aggregated by country or region ... 160
Table 11 - Comparison of projects in Poland and in the rest of the world ... 170
8
Abstract
Business Intelligence can bring critical capabilities to an organization, but the implementation of such
capabilities is often plagued with problems and issues. Why is it that certain projects fail, while others
succeed? The theoretical problem and the aim of this thesis is to identify the factors that are present in
successful Business Intelligence projects and organize them into a framework of critical success
factors.
A survey was conducted during the spring of 2011 to collect primary data on Business Intelligence
projects. It was directed to a number of different professionals operating in the Business Intelligence
field in large enterprises, primarily located in Poland and primarily vendors, but given the similarity of
Business Intelligence initiatives across countries and increasing globalization of large enterprises, the
conclusions from this thesis may well have relevance and be applicable for projects conducted in other
countries.
Findings confirm that Business Intelligence projects are wrestling with both technological and
non-technological problems, but the non-non-technological problems are found to be harder to solve as well as
more time consuming than their technological counterparts. The thesis also shows that critical success
factors for Business Intelligence projects are different from success factors for IS projects in general
and Business Intelligences projects have critical success factors that are unique to the subject matter.
Major differences can be predominately found in the non-technological factors, such as the presence of
a specific business need to be addressed by the project and a clear vision to guide the project.
Results show that successful projects have specific factors present more frequently than
non-successful. Such factors with great differences are the type of project funding, business value provided
by each iteration of the project and the alignment of the project to a strategic vision for Business
Intelligence.
Furthermore, the thesis provides a framework of critical success factors that, according to the results of
the study, explains 61% of variability of success of projects.
Given these findings, managers responsible for introducing Business Intelligence capabilities should
focus on a number of non-technological factors to increase the likelihood of project success. Areas
which should be given special attention are: making sure that the Business Intelligence solution is built
with end users in mind, that the Business Intelligence solution is closely tied to company’s strategic
vision and that the project is properly scoped and prioritized to concentrate on best opportunities first.
Keywords: Critical Success Factors, Business Intelligence, Enterprise Data Warehouse Projects,
Success Factors Framework, Risk Management
9
Acknowledgements
We would like to thank our supervisor Dr Klaus Solberg Søilen for his valuable input and thoughtful
comments that has led us through the work with the thesis. Perhaps it was not always easy for us to
accept his comments, but we would not have achieved the final result without his guidance. Now,
when the hardships are over and we no longer have to “redo and resend”, we are able to appreciate
his help. The supervisor has to be like a father – tough and fair.
We owe gratitude to Dr Gabriel Pietrzkowski, a friend from secondary school who has chosen the
path of fame, for his support in understanding the intricacies of Partial Least Squares and his
challenging and critical comments about our initial models. All the discussions we had stimulated
improvement, but he was wise enough not to suggest specific changes, letting us come with our own
ideas instead.
This thesis would not be in its current shape if not our colleagues and peers who agreed to review it
and offer their comments. Nicklas Bylund, Emil Larsson and Rachel Ramos-Reid did not have an
easy task, but their help allowed us to eliminate errors and increase clarity of argument.
Also, special thanks to all the survey participants that made this thesis possible. Since they were
promised anonymity, we will not mention their names here.
We would also like to thank Dr Christian Ringle, Sven Wende and Alexander Will for allowing us to
use their SmartPLS software (Ringle, Wende & Will, 2005) free of charge for the purpose of
analyzing the primary research data. Having the technical side of data analysis covered saved us a lot
of time.
Finally, we would like to thank those we should mention at the beginning, our families, for all the
support and understanding, especially in the final weeks of our thesis work. For them, it was
especially hard to accept the fact that we needed to spend all of our free time in front of a computer.
We will make up that time to you.
10
1.
Introduction
1.1.
Background
The aim of this thesis is to develop the tools necessary to analyze, predict and manage the success of
Business Intelligence, data warehousing or competitive intelligence initiatives in the contemporary
organizations. “There is no reason that each organization, as it begins and continues to develop data
warehouse projects, must wrestle with many of the very difficult situations that have confounded other
organizations. The same impossible situations continue to raise their ugly heads, often with
surprisingly little relation to the industry, the size of the organization, or the organizational structure”
(Adelman, 2003). If there is indeed little correlation between success and the environmental factors of
those initiatives, the cause of success must be related to something else. It is worth investigating
whether the difficulty, complexity of initiatives and their high probability of failure is related to some
factors inherent to Business Intelligence itself.
In fact, most of the Business Intelligence and data warehouse projects fail and the failure rate is
estimated to be between 50% and 80% (Beal, 2005; Meehan, 2011; Laskowski, 2001; Legodi & Barry,
2010). Why do so many of those projects fail? “The warehouse is used differently than other data and
systems built by information systems” (Inmon, 2002). Therefore, the available knowledge on how to
manage ordinary projects in the information systems domain should not be expected to be readily
applicable in the area of Business Intelligence.
1.2.
Problem discussion and delimitations
Our initial information search revealed that Business Intelligence has been covered in a large number
of academic articles and books. However, Business Intelligence success is not so widely treated. Few
articles attempt to analyze what the factors influencing BI are. Some of them have developed
frameworks, but there is no proven framework which can be relied upon for this particular problem.
The article with an approach closest to ours is (Yeoh & Koronios, 2010). The authors conducted an
empirical, qualitative study to define Critical Success Factors (CSFs) and classified them into 3
categories: organization, process and technology factors that together include committed management
support and sponsorship, clear vision and well-established business case, business centric
championship and balanced team composition, business-driven and iterative development approach,
user-oriented change management, business-driven, scalable and flexible technical framework and
sustainable data quality and integrity. Later, leveraging five case studies, they verified that those cases
that scored high on all or most of the factors were indeed successful. The single case where the factors
were rated low turned out to be an unsuccessful implementation. However, the case study approach
used in this article would not be sufficient to draw conclusions about CSFs of BI solutions in general.
Moreover, Yeoh and Koronios (2010) fail to propose any objective measures for any of the factors.
Despite these shortcomings, this article (Yeoh & Koronios, 2010) can be used as a starting point for
conducting primary research.
In the article by Popovic and Jaklic (2010), the authors concentrate on one of the success factors
identified by Yeoh and Koronios (2010), namely information quality. They distinguish between
content quality and media quality and successfully prove their hypothesis that there is a positive
correlation between BI systems maturity and both content and media quality and that this correlation is
not of equal strength in both cases. We are unsure whether the authors’ proposed causal effect is right
and in fact, it is the information quality that drives BI systems maturity, not vice versa. However, this
issue will remain unaddressed in our thesis.
11
Another article (Legodi & Barry, 2010) is an example that the issue of BI can be analyzed from many
different angles. The authors take a purely risk management viewpoint and treat BI as a project rather
than a process. Therefore, problems tormenting BI initiatives they identified look more like an excerpt
from project management handbook rather than a result of scientific research. We would not like our
research to be that generic and we plan on concentrating on BI specific criteria. Even if they turn out
to be in line with broader success factors applicable in other fields, we would like to identify exactly
what each criterion means in Business Intelligence.
Finally, we would like to mention a book (Kimball, Ross, Thornthwaite, Mondy & Becker, 2008) as a
valuable source of insight into BI implementations. Although the book is targeted at practitioners, one
of the authors holds a PhD and is credited with developing one of the two most successful BI systems
architectures - dimensional modeling. This book highlights many pitfalls present during the
implementation of BI in the enterprise. Despite traditionally technical approach of manuals for
practitioners, this book devotes a significant amount of focus to the business side of BI and potential
issues. It also concentrates on best practices that might be invaluable for structuring our primary
research. Recommendations of the book (Kimball, Ross, Thornthwaite, Mondy & Becker, 2008) are in
line with those of one of the aforementioned articles (Yeoh & Koronios, 2010).
1.3.
Problem Formulation and Purpose
The success of the BI initiatives undertaken by companies depends on various factors. Because BI
implementation depends on the successful use of IT resources, some of those factors are undoubtedly
technological. However, Information Technology is merely a tool in implementing a BI solution. BI
success depends chiefly on organizational and process factors that business administration focuses on.
Despite differences in BI systems between various industries, those factors should be identified and
classified. The existence of link between individual factors or their combinations and success of BI
initiatives should be verified. Moreover, success factors could be classified and a method of
measurement be devised for each individual factor. As the management thinker Peter Drucker once
said, “what gets measured, gets managed”. Currently, BI initiatives have a relatively low success ratio,
estimated to be no higher than 50% (Beal, 2005; Meehan, 2011; Laskowski, 2001; Legodi & Barry,
2010). Successful ones achieve ROI in excess of 400% (according to some vendors). This figure is
even more impressive when taking into account enormous (traditionally capital) investments in the
infrastructure and equally high (traditionally operational) expenses on development projects,
operations, consulting services etc. An ability to assess the chances of success prior to engaging in the
initiative would have two practical benefits:
1. Preventing some of the initiatives from commencing if they score low in the framework of
success factors or allowing them to focus on critical issues that otherwise would have caused
the failure - as a result improving the success ratio of all BI initiatives.
2. Facilitating management of the investment in Business Intelligence and lowering the entry
barriers (given the high level of investment, 50% probability of failure might be too high for
smaller companies if the loss resulting from failure might push the company into bankruptcy).
As the existence of Business Intelligence success factors is not widely covered in the academic
literature and the link between those factors and the success of BI is not scientifically proven, the
research can potentially fill the gap in theoretical knowledge. The purpose of this thesis is to identify
why certain projects fail, while others succeed, by addressing the theoretical question of identifying
the factors that are present in successful Business Intelligence projects and organize them into a
framework of critical success factors.
12
H1.
It is possible to identify critical success factors (CSFs) of BI initiatives primarily in Poland.
H2.
CSFs of BI initiatives primarily in Poland are not the same as for information systems in
general.
H3.
Non-technical and non-technological CSFs play a dominant role in BI initiatives’ success for
initiatives primarily in Poland.
H4.
Technology plays a secondary role and is less critical for BI initiatives’ success for initiatives
primarily in Poland.
H5.
It is possible to develop objective measures for each of CSFs of BI initiatives primarily in
Poland.
If the abovementioned hypotheses can be proved, CSFs of BI initiatives create a framework that can
be used to predict the success in early stages of BI initiatives.
It should be noted that, even though the thesis is primarily studying vendors in Poland, the conclusions
from this thesis may well have relevance and be applicable for other countries as well, especially since
many of the companies studied were global enterprises and other aspects of projects and IT are seeing
globalization, outsourcing, offshoring, nearshoring and other forms of international operations.
Moreover, as can be seen in Appendix III, the differences in survey results between Poland and other
countries were not significant and drawing conclusions from the sample we gathered, we can claim
that our findings are also applicable to Business Intelligence projects in large enterprises worldwide.
The reason for choosing Poland as a primary country is that one of the authors has been working there
for many years and has good access to data points.
In this thesis, the terms project and initiative are being used interchangeably.
There is some ambiguity around the use of the terms data warehouse and Business Intelligence among
practitioners. Historically, data warehousing meant “the overall process of providing information to
support business decision making” (Kimball, Ross, Thornthwaite, Mondy & Becker, 2008, p. 10).
Following those authors, “delivering the entire end-to-end solution, from the source extracts to the
queries and applications that the business users interact with” (Kimball, Ross, Thornthwaite, Mondy &
Becker, 2008, p. 10) has always been a fundamental principle. However, the term business intelligence
coined in the 1990s meant only reporting and analysis of data stored in the warehouse, effectively
separating those two terms. Even now, there is no agreement in the industry – some “refer to data
warehousing as the overall umbrella term, with the data warehouse databases and BI layers as subset
deliverables within that context” (Kimball, Ross, Thornthwaite, Mondy & Becker, 2008, p. 10), while
others “refer to business intelligence as the overarching term, with the data warehouse relegated to
describe the central data store foundation of the overall business intelligence environment(Kimball,
Ross, Thornthwaite, Mondy & Becker, 2008, p. 10).
Because the aim of this thesis is not to define the term of Business Intelligence, but rather to
investigate its success factors, both conventions have to be accommodated. Therefore, articles
referring both to data warehouse systems/projects and Business Intelligence systems have to be
reviewed. There is no difference in their relevance to our study, especially when taken into account the
industry practice that even “though some would agree that you can theoretically deliver BI without a
data warehouse, and vice versa, that is ill-advised (…). Linking the two together in the DW/BI
acronym further reinforces their dependency” (Kimball, Ross, Thornthwaite, Mondy & Becker, 2008).
Despite this argumentation, Business Intelligence is used in this thesis as an overall term instead.
13
1.4.
Delimitations
1.4.1.
NPV calculation for BI projects
The research is concentrated mainly on the factors that lead to the success of BI initiatives, cause the
success (or are able to prevent it) or are otherwise correlated with the success. However, little attention
is paid to the definition of the success itself or its measurement. According to Delone and McLean
(1992; 2003), the success entails the net benefits. To properly define the success, those net benefits
need to be measured. The authors’ goal of obtaining objective measurement criteria would call for a
method to compute the NPV of BI initiative. A similar subject (without the emphasis on BI, but rather
for software in general) has recently been a topic of a PhD thesis (Numminen, 2010). Clearly,
calculating the NPV of BI initiatives will be out of scope for this thesis. Therefore, the success itself
will not be defined as clearly as the authors would want. There would be room for further research in
this area.
1.4.2.
Interdependence between individual independent variables
Several of the models proposed in the literature (Delone & McLean, 1992; 2003; Hwang & Xu, 2008;
Wixom & Watson, 2001) analyzed the interdependency between independent variables. Furthermore,
none of the abovementioned authors proposed a direct correlation with success for those variables that
were used to explain variability of other independent variables. The goal of this thesis is to enumerate
all the CSFs of BI projects, not to analyze how they depend from each other. For each of the
independent variables analyzed, a direct dependency between success and that variable is analyzed.
1.5.
Glossary
1.5.1.
Business Intelligence (BI).
A generic term to describe leveraging the organization’s internal and external information assets to
support improved business decision making (Kimball, Ross, Thornthwaite, Mondy & Becker, 2008, 0.
596).
1.5.2.
Correlation.
The state or relation of being correlated ; specifically : a relation existing between phenomena or
things or between mathematical or statistical variables which tend to vary, be associated, or occur
together in a way not expected on the basis of chance alone (Merriam-Webster Dictionary, 2011)
1.5.3.
Correlation coefficient.
A number or function that indicates the degree of correlation between two sets of data or between two
random variables and that is equal to their covariance divided by the product of their standard
deviations (Merriam-Webster Dictionary, 2011)
1.5.4.
Critical success factor (CSF).
See (Project) Success factor.
1.5.5.
Data warehouse.
The conglomeration of an organization’s data staging and presentation areas, where operational data is
specifically structured for query and analysis performance and ease-of-use (Kimball & Ross, 2002, p.
397).
1.5.6.
Delphi study or Delphi panel.
A method used for a structured study based on communication between a group of individuals (usually
experts) (Linstone & Turoff, 2002)
14
1.5.7.
Framework.
A basic conceptional structure (as of ideas) (Merriam-Webster Dictionary, 2011).
1.5.8.
Information system (IS).
Any combination of information technology and people's activities using that technology to support
operations, management, and decision-making (Ellison & Moore, 2003).
1.5.9.
Iteration.
A procedure in which repetition of a sequence of operations yields results successively closer to a
desired result (Merriam-Webster Dictionary, 2011).
1.5.10.
Likert survey.
Survey with questions that have ordinal level of measurement in which the categories of responses
have rank order. Likert scale are commonly used in questionnaires for measuring attitudes (Jamieson,
2004).
1.5.11.
Partial least squares (PLS).
A method of constructing regression equations. PLS constructs new explanatory variables, often called
factors, latent variables, or components, where each component is a linear combination of independent
variables. Standard regression methods are then used to determine equations relating the components
to the dependent variable (Garthwaite, 1994).
1.5.12.
Program.
A group of related projects managed in a coordinated way. Programs usually include an element of
ongoing activity (Duncan, 1996, p. 167).
1.5.13.
Project.
A temporary endeavor undertaken to create a unique product or service (Duncan, 1996, p. 167).
1.5.14.
(Project) Success factor.
A feature or property of a project that is necessary for it to be successful or to achieve what it set out to
create (Daniel, 1961).
1.5.15.
Retrun on investment (ROI).
The net benefits from an investment or project (gain minus cost) divided by the cost of the investment
or project (Pisello, 2001).
1.5.16.
Statistical model.
A mathematical description of relationships between variables. Can be of different types such as
confirmatory or exploratory (Adèr & Mellenbergh, pp. 271-304). See also PLS.
1.5.17.
Variable.
15
2. Theory and literature review
This chapter is dedicated to the review of available subject matter literature. First, existing frameworks
are being examined. Because of the differences between them, they will be treated separately from
each other. Then, articles enumerating success factors without attempting to organize them into any
framework are discussed. Again, profound differences in the approach suggest there doesn’t exists a
coherent body of theory describing success factors in Business Intelligence. Therefore, the discussion
of success factors will usually be limited to enumerating or summarizing the factors identified in the
literature. After a brief paragraph about the dependence of success from the stakeholder’s interest, a
summary of theory identified in the literature is offered.
2.1.
The importance of success criteria
Starting the discussion of the subject theory, let us take a look at the work of one of the most famous
practitioners in the field of data warehousing and Business Intelligence, Dr Ralph Kimball. He is
credited with developing arguably the most successful data warehouse architecture
1, the dimensional
modeling. The success criteria as described by Kimball are named “readiness factors”. The author
suggests giving up the initiative, if some of the criteria are missing or insufficient. “Readiness
shortfalls represent project risks; the shortfalls will not correct themselves over time. It is far better to
pull the plug on the project before significant investments have been made than it is to continue
marching down a path filled with hazards and obstacles” (Kimball, Ross, Thornthwaite, Mondy, &
Becker, 2008, p. 16).
Why are the success criteria so important? As we have already mentioned in the introduction, “some
data warehouse implementations fail. It’s possible that many of those ‘failures’ would be considered
by some to be successes (or at least to be positioned someplace between failure and success). The
criteria for success are often determined after the fact. This is a dangerous practice since those
involved with the project don’t really know their targets and will make poor decisions about where to
put their energies and resources” (Inmon, 2002, p. 5).
According to (Adelman, 2003), the example measures of success include the following:
- The data warehouse usage.
- Usefulness of the data warehouse, including end user satisfaction.
- Acceptable performance as perceived and experienced by end users.
- Acceptable ROI - benefits justifying the costs.
- Relevance of data warehouse application.
- Proper leverage of a business opportunity (i.e. establishing competitive advantage thank to
the application of data warehouse).
- Timely answers to business questions.
- Higher quality / cleanliness of data (than in the source systems).
- Initiation of changes in the business processes that can be improved as a result of the use of
data warehouse (Adelman, 2003, p. 5&40).
Douglas Hackney emphasized the critical importance of establishing success measures – “The ‘build it
and they will come’ approach (…) does not work in data warehousing” (Adelman, 2003, p. 41). He
further suggests starting with business “pain” by the available data. The words “life-threatening” seem
to accurately describe the problem that need to be chosen to solve (Inmon, 2002, p. 41). An example
of a business “pain” might be the “loss of revenue or excessive operating costs” (Inmon, 2002, p. 42).
1
There is another very popular data warehouse architecture, called Enterprise Data Warehouse (EDW), proposed by William Inmon. Some practitioners prefer it over Kimball’s dimensional modeling technique.
16
2.2.
Frameworks of success criteria
In the academic literature, there exist many frameworks that enumerate, classify and organize success
factors of Business Intelligence or Information Systems in general into a coherent body of knowledge.
Let us examine them one by one, starting with the most renown and most general framework and
moving into specific BI success frameworks afterwards.
2.2.1.
Information Systems Success
The most obvious first choice when trying to discover BI success factors is to look at the information
systems (IS) in general. There exists an excellent framework proposed by Delone and McLean
(Delone & McLean, 1992; 2003) that has been widely cited, revisited, criticized, validated or extended
in hundreds of articles (Delone & McLean, 2003). The original framework proposed by the authors
(Delone & McLean, 1992) has been reexamined in the light of that subsequent research, resulting in a
slightly updated version (Delone & McLean, 2003) that will be discussed here. The proposed
framework defines IS success in terms of system use, user satisfaction and net benefits whereas the
factors leading to the success encompass information quality, system quality and service quality. The
interdependences between those variables is depicted on Figure 1on the subsequent page.
We should note that one should not measure system quality and service quality at all, as they are
inapplicable in Business Intelligence. As Solberg Søilen and Hasslinger found (Solberg Søilen &
Hasslinger, 2009), vendors of BI tools do not differentiate their products and tools (other than
adopting different definitions of Business Intelligence). Therefore, system quality should not be a
factor in Business Intelligence domain. Because Business Intelligence systems are built to present data
and facilitate its analysis, data quality is probably the most important factor. From the “second tier”
variables, intention to use and user satisfaction should play little role in Business Intelligence. If BI is
tied to strategic vision for the entire company, users are obliged to use the solution and not their own
data sources. Therefore, only use as a variable plays a role.
One major drawback of this framework that we identified, is the concentration on technology. Success
of BI initiatives relies on numerous factors that are within the management domain rather than
technological factors. Therefore, although the Delone and McLean model of IS success has been
applicable to many specific information systems, even those that have been unforeseen when the
framework was originally constructed (Delone & McLean, 2003), we think it cannot be applied to
Business Intelligence systems without changes.
A noteworthy fact is that Delone and McLean framework not only does not propose any specific
measurement methods, but it also avoids specific variable definitions, leaving them to be concretized
at the time of framework application, depending on the specific context. According to the framework
authors, that was their intended goal (Delone & McLean, 2003).
17
Figure 1 - Delone&McLean model for IS success
2.2.2.
Critical Success Factors for BI Systems
“The implementation of a BI system is not a conventional application-based IT project (such as an
operational or transactional system), which has been the focus of many CSF studies” (Yeoh &
Koronios, 2010). Having noted that, the Yeoh and Koronios proceeded to propose a framework that
included some of the critical success factors or success variables from (Delone & McLean, 1992) as its
part. System quality, information quality and system use were grouped together and labeled
infrastructure performance. As an equal factors group, process performance was proposed,
encompassing classical project management variables like budget and time schedule. However,
authors emphasized a different set of factors, divided into three broad categories - organization (vision
and business case related factors, management and championship related factors), process (team
related factors, project management and methodology related factors, change management related
factors) and technology (data related factors, infrastructure related factors). All those factors taken
together cause business orientation, which in turn, together with before mentioned infrastructure and
process performance factors lead to implementation success and, subsequently, to perceived business
benefit. This framework is illustrated in the following Figure 2:
18
Figure 2 - Yeoh&Koronios model of success in BI
A summary of success factors across all the dimensions with the highlight of most important points:
x
Organizational dimension
o
Committed management support and sponsorship
sponsor should come from the business rather than from the IT,
sponsor should have a specific business need,
BI initiative should not be funded in a traditional application development
model due to the iterative or evolutionary nature of BI system,
because there is a need for constant funding, it should come directly from
senior management to overcome continual organizational problems,
since BI initiative uncovers many issues across the entire organization,
therefore it should be positioned under senior management authority rather
than under specific departments, including IT department.
o
Clear vision and well-established business case
to establish a business case, a long-term strategic vision is needed,
business case for BI need to be aligned to that vision to prevent BI system
from missing the core objectives of the business,
a strong business case stemming from the analysis of business needs increases
the chances of winning top management support,
instead of being a project, BI initiative is a process that evolves organically
and unpredictably; the growth can potentially be infinite.
x
Process dimension
o
Business-centric championship and balanced team composition
extensive use of data and resources from various business units calls for a
strong champion that will facilitate and coordinate effort, and ensure
collaboration across the entire enterprise,
the team implementing BI initiative requires broad skills and needs to be
composed of the best specialists in all areas,
not only technical staff is required; business side need to be actively involved
as well.
19
appropriate planning and business-oriented scoping should concentrate on
choosing the best opportunities (“low-hanging fruit”),
planning and scoping allows to adapt to changing requirements,
iterative approach to development is advised in as short increments as
feasible,
iterations should be chosen in such a way that each provides deliverables that
add value to the business.
o
User-oriented change management
formal user participation can help meet the expectations of end users,
business users work with the data directly, therefore know it the best,
when done properly, user support will evolve with each development
iteration.
x
Technological dimension
o
Business-driven, scalable and flexible technical framework
flexible and scalable infrastructure design allows for system expansion when
the need arises,
additional data sources (internal or external) could be subsequently added to
the system,
infrastructure involves all technical issues, not only the hardware.
o
Sustainable data quality and integrity
quality of data is crucial, not only in the BI system, but also (or rather
especially) at the source systems,
BI system often uncovers data quality issues or database related issues that
were present in the source and not discovered earlier,
common measures and definitions (standardization) allow for cross-functional
and cross-departmental use of the data,
data architecture should be done at the beginning of BI initiative as it becomes
harder to do it as the subsequent iterations are being delivered (Yeoh &
Koronios, Critical Success Factors for Business Intelligence Systems, 2010).
This framework is considerably more suited for Business Intelligence systems than the Delone and
McLean model of IS success (Delone & McLean, 2003). However, it has a few drawbacks. First, there
are no specific measurement criteria proposed. Since several of the variables are defined in a way that
very different and broad measurement criteria can be defined or it would be hard to devise measures
other than the Likert scale, the framework would be impractical to apply and the results might depend
on the subjective opinions of those that provide or calculate variable’s values, resulting in the false
prediction of the BI initiative success. Another drawback is an artificial reliance on the Delone and
McLean model of IS success (Delone & McLean, 2003). Some infrastructure performance factors
(system quality, information quality) belong under technology category (infrastructure related factors
or data related factors) and should not be repeated at all or the causal dependency should be included
in the framework.
Further criticism of this article (Yeoh & Koronios, 2010) can be based on the way inclusion of
technology related factors was performed. “Business-driven, scalable and flexible technical
framework” and particular variables that fall into this category are too close to the way the vendor that
delivered the solution advertises his product. Also, the fact that (Yeoh & Koronios, 2010) was based
on a single project plays down the objectivity of its findings.
20
2.2.3.
Critical Success Factor Framework for Implementing Business Intelligence
Systems
Let us take a look at a qualitative study presented in Critical Success Factor Framework for
Implementing Business Intelligence Systems (Yeoh, Gao, & Koronios, 2007), in which the authors
performed a Delphi study covering 15 BI systems experts to define a critical success factor framework
for implementing business intelligence systems. The authors propose a framework that is organized
into seven dimensions covering 22 factors. The seven dimensions of this article (Yeoh, Gao, &
Koronios, 2007) are:
x Commitment management support and championship.
x User-oriented change management.
x Business vision.
x Project planning.
x Team skills and composition.
x Infrastructure-related dimensions.
x Data related issues.
The factors in those dimensions are rated by the Delphi panel and a mean is calculated for each
dimension. The above list of dimensions is ordered in a falling mean ranking, starting with the
dimension with the highest rating. Notable is that more technical dimensions can be found at the very
bottom, while non technical dimensions are found higher up in the list.
This article (Yeoh, Gao, & Koronios, 2007) demonstrates that management championship and the
presence of a clear vision for Business Intelligence is important when executing a Business
Intelligence initiative. While the result from this thesis seems to indicate that the technical factors to
be less important than the non-technical, the authors of this article (Yeoh, Gao, & Koronios, 2007)
have included two “technical” dimensions out of seven. It should be granted though, that the ratings of
the two technical dimensions are the lowest out of the seven.
2.2.4.
A Structural Model of Data Warehousing Success
A Structural Model of Data Warehousing Success (Hwang & Xu, 2008) analyzes several factors
influencing data warehousing success. Success is not measured as a separate variable. Instead,
following Delone and McLean (Delone & McLean, 1992; 2003), benefits and quality are used as
proxy, with a distinction between individual and organizational benefits as well as system and
information quality. The independent variables are operational factor, technical factor, schedule factor
and economic factor. Authors propose at least two measures for each variable, dependent and
independent. A model proposed by authors (see Figure 3) is able to explain between 27% (system
quality) and 41% (organizational benefits) of dependent variables variability.
21
Figure 3 - Hwang & Xu structural model of data warehousing success
The most prominent difference in approaches is definition of what a variable is and what a measure is.
Many measures from this article (Hwang & Xu, 2008) are variables in our study, for example business
benefits definition, business benefits measurability or scoping of project. Our aim for objective
measurement methods were not one of the goals of Hwang & Xu (2008) and it is unclear how
measures proposed in their work should be performed in practice. The authors were overly reliant on
the model of IS success (Delone & McLean, 1992; 2003), achieving little explanatory power of their
model in return. From the way model was constructed, it is also hard to determine whether technical or
non-technical factors play major role in data warehousing success.
2.2.5.
An Empirical Investigation of the Factors Affecting Data Warehousing Success
An Empirical Investigation of the Factors Affecting Data Warehousing Success (Wixom & Watson,
2001) examined the factors influencing data warehousing success. Authors verified several
hypotheses. Summarized findings can be seen in Table 1.
Code Hypothesis
Findings
H1a
A high level of data quality will be associated with a high level of perceived net
benefits.
Supported
H1b
A high level of system quality will be associated with a high level of perceived
net benefits-
Supported
H2a
A high level of organizational implementation success is associated with a high
level of data quality.
Not
Supported
H2b
A high level of organizational implementation success is associated with a high
level of system quality.
Supported
H3a
A high level of project implementation success is associated with a high level of
data quality.
Not
Supported
H3b
A high level of project implementation success is associated with a high level of
system quality.
Supported
H4a
A high level of technical implementation success is associated with a high level of
data quality.
Not
Supported
22
Code Hypothesis
Findings
H4b
A high level of technical implementation success is associated with a high level of
system quality.
Not
Supported
H5
A high level of management support is associated with a high level of
organizational implementation success.
Supported
H6a
A strong champion presence is associated with a high level of organizational
implementation success.
Not
Supported
H6b
A strong champion presence is associated with a high level of project
implementation success.
Not
Supported
H7a
A high level of resources is associated with a high level of organizational
implementation success.
Supported
H7b
A high level of resources is associated with a high level of project implementation
success.
Supported
H8a
A high level of user participation is associated with organizational
implementation success.
Supported
H8b
A high level of user participation is associated with project implementation
success.
Supported
H9a
A high level of team skills is associated with project implementation success.
Supported
H9b
A high level of team skills is associated with technical implementation success.
Not
Supported
H10
High-quality source systems are associated with technical implementation
success.
Supported
H11
Better development technology is associated with technical implementation
success.
Supported
Table 1 - (Wixom & Watson, 2001) Hypotheses findings