Health and
Sustainable
Agriculture
Editor: Ingrid Karlsson and Lars Rydén
Rural Development
and Land Use
The Basic Interlinkage – Lessons of
History
A Conflict Betwen Economics and Environment
Throughout human history environmental problems have always been with us; they have caused us to inhabit strange places of the globe, to eat cereals, to kill each other. Our history is rife with environmental disasters (although of a relatively local nature so far) in which cultures perished after depleting their own resource basis, e.g. the catastro-phes of Easter Island in the 16th century and of Lake Aral in the 20th century, which was transformed into a salty desert after the water level had fallen by 13 metres and the water content had been reduced by two-thirds since 1960 as the result of large-scale cotton cultivation and irrigation (Rydén et al., 2003:27,197,541.).
The basic interlinkage between ecology and econom-ics is that economic activity depends upon, and damages, the environment. Economic activity is the origin of en-vironmental problems. It is not the cure, although this used to be a popular belief, especially among economists: ‘Over time, the environment and economic prosperity are not opposing concepts, but rather complementary enti-ties’ (Lomborg, 2001:32,210). Now, environmental
is-sues are being taken increasingly seriously by influential economists (Arrow et al., 1995,2004; Stern, 2007), but
Economic Instruments
Three Interlinkages Between
Ecology and Economics
Hans Aage
Roskilde University, Denmark
unfounded optimism concerning future economic growth is still widespread.
The Naive Belief in Economic Growth
Thus the 2006 Stern Review assumes 1.3% annual GDP growth as the baseline for the next century (Stern et al., 2007:161.). Likewise, the Danish report on future social
welfare assumes 2.0% annual productivity growth and furthermore claims that this is ‘well substantiated’.1It is nothing of the sort; it is an unfounded extrapolation of recent, exceptional historical experience, namely average growth rates of GDP per capita in the 20th century. Global GDP per capita changed little until 1000 A.D. During the following 800 years it grew by 0.05% per annum on aver-age and in the 19th century by about 1%. Since 1900, glo-bal GDP per capita has increased by a factor of 5 (1.6% p.a.), total GDP by a factor of 17 (about 3% p.a.), energy consumption by a factor of 12 (half the original oil re-source is used up), water consumption by a factor of 9 (one-third of total resources is being used), and global population by a factor of 4, from 1.6 to 6.1 billion people (Maddison, 2003; McNeill, 2001; Aage, 2002).
A repetition of the 20th century is physically impossi-ble. Little is known about future GDP growth. Yet, some-thing is known for sure about exponential growth: that it eventually grows very fast and that it eventually draws
to a close, the only questions remaining being when and how.2
The true lesson of our environmental history is quite different. We have displayed a stunning improvidence and lack of long-term foresight or, positively phrased, we have an inborn, impressive ability to repress perplexing problems, which were always abundant, and concentrate on doing something more or less sensible. The funda-mental problem with which mankind has wrestled – with varying success – throughout history is to achieve a bal-ance between:
• Our desire to live comfortably and increase the supply of commodities, first and foremost to withdraw from the starvation limit by increasing food production. • Our desire to proliferate.
• The capacity of our natural base to sustain production (Ponting, 1991:17)
The core problem is the old but increasingly painful awareness that economic activity today may endanger the life and welfare of our descendants hundreds of years from now, and that we do not know how to prevent it. It forces us to weigh our own survival against that of other human beings, to look across the globe and across centu-ries and to live under uncertainty, including a positive but unknown probability of future, man-made cataclysms. This awareness transgresses the habitual limits of our ra-tionality and morality.
A Mistaken Interlinkage – Economy and
Sustainability
Resource Availability is Not Fixed by the Market
Concerning the supply and optimal use of resources and environment, three different classes of issues can be de-lineated and considered separately, related to science, politics and economics, respectively. Compared with the first and second groups of issues, the third group, related to economics, is a very minor one.
The first class of problems concerns sustainability, the environmental effects of economic activity, the magni-tude and nature of resources and the available and
pro-spective technical options, including possible substitu-tions in consumption and production. These are science problems, and naturally they must be investigated using methods of the natural sciences.
Economists, however, have long cherished strong opinions on these topics. Now, this is finally changing for the better, but in the 20th century the shining growth optimism of Marx and Engels prevailed among econo-mists, and mainstream economists figured prominently in the formation of environmental awareness in the last third of the 20th century as a blimpish rearguard party (Aage, 1984, 2008).Resources and the environment more or less disappeared from general economics textbooks, which often include chapters on economic growth containing highly relevant empirical evidence without at all men-tioning ecological problems or nature as a basis for, and limitation to, economic activity. Words such as ecology, environment, pollution, green taxes and resources simply do not figure in the index.3
The core economic argument has two parts: firstly, that there are plenty of resources and plenty of carrying ca-pacity and resilience of the environment; and secondly, that if there were any problems they would quickly and automatically be resolved by market mechanisms.
The first part of the argument against the doom-sayers amounts to neglect or outright denial of the finality of na-ture. Sometimes it is based upon extrapolation of historical trends, assumptions about substitutability and automatic technological progress or presumptions that economic growth improves the environment. Sometimes it is just postulated that Planet Earth ‘is so incredibly much larger than all our needs’ (Lomborg, 1998), that ‘we have more and more oil left, not less and less’, and that our oil re-serves can be compared with a ‘refrigerator’ which, when near-empty, can simply be replenished ‘in the supermar-ket’, because ‘new oil fields will be continuously added as demand rises’ (Lomborg, 2001:125; cf. also the article entitled Plenty of Gloom in The Economist, 20 December 1997, pp 21-23). This might be true given a sufficiently short, very short, time horizon. Yet, the very basis of con-temporary environmental awareness is that Planet Earth is limited in relation to human capabilities and global eco-nomic activities. What we do know for certain is that the number of unknown reserves will go down at precisely the same rate as the sum of used and known reserves goes up.
The suppression of resources and the environment in economics is partly justified by the fact that according to comparative analyses of growth rates in various coun-tries in the 20th century, resource endowments had very limited explanatory power (Maddison, 1991:56-60). The confidence in continued growth relies upon ‘successful adaptation to resource scarcity’ (Maddison, 1991:58), but
in order for this kind of analysis to make sense it must be assumed that certain possibilities for substitution exist. It must always be possible to substitute non-renewable re-sources with greater inputs of labour, man-made capital and renewable resources. According to Solow (1992:9), ‘Without this minimal degree of optimism ...there is no point of talking about sustainability’. This assumption
is the backbone of the particular brand of economic eco-optimism. If possibilities for substitution are very large (the elasticity of substitution between exhaust-ible resources and other inputs is bigger than unity, and the productivity of reproducible capital is sufficiently large), the effect is that according to Solow (1974:11), ‘the world can, in effect, get along without natural re-sources’. Note however that whether this assumption is
valid is not at all an economic problem; it belongs to the realm of science.
The second part of the economic argument is that market prices will reflect scarcity, and until now ‘mar-ket prices give no reason to believe that natural resources are a limit to economic growth’ (Mankiw, 1997:244 - the only reference to natural resources and the environment in this macroeconomics textbook). Furthermore, because
of the market mechanism, scarcity of a resource causes an increase in its price, thereby creating incentives for ex-ploration, substitution and innovation, which will eventu-ally eliminate the scarcity:
‘In fact, prospectors usually discover new natu-ral resources when prices rise, and technologi-cal progress has been rather successful in finding substitutes’ (Maddison, 1991:58)
This argument is based on the economic theory of the market price of a raw material with known deposits (in-cluding a typical hint at a historical argument); it will equal extraction costs plus an increment for scarcity that increases over time by an annual percentage, equalling
the rate of interest (Pearce and Turner, 1990:271-276, cf. section Long-term Exhaustible Resources below.).
However, the market is a peculiar place to search for information on the magnitude of resources and likely technical advances in the future. The sensible thing to do would be to directly address geologists and engineers.
In addition, the problem with the effect of those mar-ket-generated incentives is that the causation chain has two links that are both weak. Firstly, price rises have to happen early and strongly enough for measures towards substitution and technical development to be taken in due time. However, since the scarcity increment may only make itself felt right before depletion, prices will only rise if geological conditions cause sufficiently rapid in-creases in the extraction costs. This first link of the causa-tive chain can be corrected politically by means of ad-ministrative regulation, taxation and subsidies, and also by tradable permits (Cf. Arrow et al., 1995).
Secondly, those endeavours have to succeed. The mag-nitude of resources and the possibilities for technological advances are scientific problems of an entirely different nature than economic effects reflected as rising prices. If the laws of supply and demand do not provide sufficient incentives, they can be corrected by government policy. As for the laws of nature, they do not lend themselves to amendment by decree. Using economic methods in the sphere of sustainability is mistaken and ideological.
Politics and Ethics: Cost-benefit Analysis
The second class of problems are the painful political and moral problems of how we want to allow for the welfare of future generations and to distribute the rights of exploiting resources and environment between rich and poor people. The contribution of economics in this sphere is equally mistaken and ideological. The method is to short-circuit all these political and moral problems by computing monetary values for everything, everywhere, everybody, at every time and comparing them in order to achieve seeming consistency and rationality. This is the principle of social cost-benefit analysis, which defines the social good as monetary values of human lives, global warming, diseases, children, the spotted owl, time saved by fast traffic, unspoiled wilderness, etc., etc.
Cost-benefit analysis is widely used for environmental assessments, including long-term effects of global
warm-ing. Thus the DICE model (Dynamic Integrated model of Climate and the Economy) (Nordhaus, 1994, 2007:697-701), a stylised model of various economic aspects and possible scenarios of global warming for the next century, is constructed upon a host of heroic assumptions, includ-ing growth rates of total factor productivity (1.5%, and then decreasing) and social discount rates (5%). Cost-benefit analysis is appropriate for comparing projects which are small, short-term and well defined. If used for long-term, extensive problems the results become very sensitive to the choice of assumptions, many of which are completely arbitrary, and results are invalidated by fundamental theoretical weaknesses, which include inter-personal comparisons of utility, the rate of discount, as-sumptions of substitutability, monetary values of human life and uncertainty.
Interpersonal comparisons of utility is the very idea
of cost-benefit analysis. Individual utilities are measured as monetary values, and they are added in order to obtain total, utilitarian social welfare. However, an extra dollar of consumption is likely to be worth more to a poor per-son than a rich perper-son. Thus, the Stern Review assumes a value of η=1 (unit elasticity of the marginal utility of consumption) (Stern, 2007:46,161-163). This arbitrary value means that utility grows with the logarithm of con-sumption and that an extra dollar is worth ten times less if the original level of income is ten times higher.
The rate of discount: For short-term private decisions,
present values of future amounts of money are computed by discounting, reflecting the private choice of either consuming income now or depositing it in a bank account at some rate of interest for future consumption. However, attempts at social cost-benefit assessment over long time spans are ruined by the discount rate problem. A discount rate of 6% implies that 30 years from now, $100 will only count as $17 today, while 100 years from now it will be reduced to 29 cents. And 6% is ‘what most economists might think are decent parameter values’ (Weitzman, 2007:707). This means that if the rate of discount is
posi-tive, future generations will have no weight; if it is zero, present generations will have no weight. There are sev-eral suggestions on how to formulate the optimisation problem over time with a reasonable allocation between generations, e.g. by including the condition that welfare must not decrease over time, or by applying a discount
rate approaching zero over time (Pearce and Turner, 1990:211-238). But this is all arbitrary, and the whole
exercise rests on shaky theoretical grounds and belongs more to ideology than to science. Most long-term cost-benefit analyses use discount rates of 3-5%, but the Stern Review does not discount the utility of future generations at all; it uses a low value of the pure time discount rate at δ=0.1% for one reason only, namely the probability that the earth could perish, so that prospective generations will not exist (Stern, 2007:45-47,161-163). Together with
η=1 and an assumed growth rate of 1.3%, this implies a discount rate for income of r = δ + 1.3η = 1.4% (the Frank Ramsey equation). This is far below the conventional 5-6% and fundamentally changes the calculation of costs and benefits of climate change and CO2 reductions.
Assumptions of substitutability: When adding the
monetary value of various goods the possibility of substi-tution is a basic assumption. Therefore price calculations are well suited for marginal decisions that allow substitu-tion, e.g. whether to have gherkins or beetroot with roast pork. Substitution is also presupposed when attempting to calculate so-called true savings, i.e. savings adjusted for natural resources spent and environmental deteriora-tion, namely possibilities of substitution between human capital, man-made physical capital and natural capital. Most economic calculations show that true savings are positive and hence fulfil a weak sustainability criterion, but this depends upon the assumption of substitutability, e.g. that less North Sea oil can be compensated for by more lessons in the French language.4
Monetary values of human life are arbitrary and
dif-fer widely. Thus the standard is about 3 million USD in the USA, 1 million USD in Denmark, and 150,000 USD in the Netherlands (Danish Ministry of Finance: Manual for cost-benefit analysis, Finansministeriet, 1999:63).
Just imagine that physical constants, like gravitation or the velocity of light, differed by a factor of 20 from one country to another.
How to Manage Uncertainty
Of course, the best forecast for our future would hardly be the best decision basis. The task is not to find the best forecast for the future and then act as though that forecast were certain. If there is some probability of less positive scenarios with serious consequences, it can be rational
to try warding them off, thus taking precautionary action upon a less probable forecast. After all, few people would consider their fire insurance premium to be wasted just because their houses did not burn down during the insur-ance period. The risk of fire can be described in terms of probabilities that can be subject to actuarial computa-tions, but a more fundamental uncertainty is a distinguish-ing feature of environmental problems because of the risk of discontinuous, irreversible and cumulative changes, which renders marginal cost-benefit optimisation ab-surd (Arrow et al., 1995; Weitzman, 2007). No company
sells insurance against the effects of climate change. The characteristic of serious environmental problems is their incalculability. Human activity has often proven to have ever more extensive impacts that we had never suspected and many environmental effects have come as total sur-prises: the impacts of DDT in the 1960s, eutrophication in the 1970s, the gap in the ozone layer and the greenhouse effect in the 1980s, and mad cow disease in the 1990s.
We do not know how to handle these ethical problems. We are no wiser from choosing some arbitrary numbers, like the η and δ of the Stern Review, as we cannot attribute any genuine meaning to them, either as moral standards or as objective knowledge. The debate on the proper magnitude of η and δ is as futile as alchemy (Cf. com-ments upon the Stern Report by William Nordhaus and Partha Dasgupta, The Economist, 16 December 2006, p 8; Nordhaus, 2007; Weitzman, 2007.). It is probably not so
that ‘the approach has the virtue of clarity and simplicity’, but rather the virtue of exposing our fundamental igno-rance and bewilderment. Indeed, ‘such excises should be viewed with some circumspection’ (Stern, 2007:30,31).
Everything boils down to the δ and η of the Stern Review (2006), namely the many attempts to solve the problem of the rate of discount and the distribution be-tween rich and poor in a simple and consistent way. The approach is simple and dangerously so, as the inherent contradictions are only suppressed, not solved, simply because the real world including man is contradictory.
When comparing welfare across generations, across the globe, under uncertainty, the quest for consistency and rationality is mistaken and leads to precisely the op-posite: a distorted and irrational perception of reality. Growth rates and discount rates, on which computations rely, are largely guess-work. Cost-benefit analyses
cover-ing long time spans invariably end up in paradoxes. Even for modern physics, time remains a mystery.
The main justification of the quest for rationality is the assertion that priorities are made, at least by implication, and therefore they had better be explicit and rational. The motto is a substitution of simple principle for com-plicated reality: we must choose, ergo we can choose. Sometimes it might be wiser to realise our ignorance and the impossibility of consistent choice, witness Aischylos, Shakespeare, Racine, Corneille and Schiller. For exam-ple, would it not have been better if the wealthy princes of the Italian Rinascimento had spent resources on feeding and educating the poor rather than erecting the duomo in Florence and financing art treasures? It is impossible not to say yes to this question, but to say yes is equally im-possible; the poor are always with us, and an affirmative answer would imply rejection of philosophy, literature, music, architecture, science, religion and all other expres-sions of culture and civilisation.
The Operational Interlinkage – the Use
of Economic Instruments
A Role for Economics
Now for the third class of problems. What are the con-tributions of economics? Squeezed between the first two classes of problems – relates to science and politics – there is little room left for economic analysis, the contribution of which is to examine the effects of economic incentives under various institutional arrangements, once the answers to the first two classes of problems are known. Adequacy of supplies and optimal use of resources are technical, sci-entific and political issues, not primarily economic.
However economics can contribute substantially, al-though marginally, to environmental policy. First of all, there is a need for book-keeping, for tracing the short-term macro-economic effects of environmental changes and policies. Secondly, economics gives useful insights into resource price developments if left to a competitive market. Thirdly, economic analysis is useful concerning institutions, incentives and effects of various policy in-struments, e.g. analysis of pollution taxes vs. tradable per-mits (Cekanavicius et al., 2003).
The Imperative of Political Regulation
A basic insight from economics is that problems of re-sources and environment cannot be left to the invisible hand of market forces. The fundamental theorems of microeconomic welfare theory prove that market allo-cations fulfil a minimum efficiency requirement called Pareto efficiency, which means that resources, labour and capital are not wasted but will provide utility at least for someone. Contrary to cost-benefit analysis, Pareto’s minimum efficiency concept does not imply compari-sons of utility of different percompari-sons, and therefore it says nothing about distribution problems. There are further snags to it, because several preconditions must be ful-filled; if not, the market mechanism will not allocate efficiently, because of market failures, namely (Stiglitz, 2000:76-88):
1. Imperfect competition.
2. Externalities, i.e. economic effects upon other market agents that are not reflected in prices and account books. An important example is air pollution.
3. Public goods, i.e. goods that are not private. A private good can be used by one person only, and payment can be collected. There are several types of pub-lic goods, for example a lighthouse. An important example is fish stocks in the sea and other types of commons, i.e. goods with common ownership. 4. Incomplete markets. An important example is the
insufficiency of markets for long-term decisions. Markets are essentially myopic.
5. Information failures.
6. Macroeconomic disturbances such as unemployment and inflation.
Thus, allocation problems in relation to resources and the environment are beset by market failures: all resource and environment problems involve long-term decisions (cf. section 3.2); pollution problems are normally exter-nalities (cf. section 3.3); and many resources are not pri-vate goods, but rather like common land (cf. section 3.4). Therefore, political regulation is imperative. Whether government allocation will actually work, when the mar-ket does not, is no evident question, as marmar-ket failures are not the only failures – there are also plenty of policy failures.
Long-term Exhaustible Resources
Long-term decision problems are handled by the market by means of a rate of interest. This also applies to utilisa-tion of an exhaustible resource. The owner has a choice between two options: either he can extract it now, sell it and deposit the profit in a bank account and draw the profit plus interest one year from now; or he can leave the resource in the ground for one year and then extract it and sell it. A market equilibrium requires that prices, extrac-tion costs and the interest rate make the owner indiffer-ent between these two options. Therefore, the profit (the resource rent), i.e. the price less extraction costs, must increase by the rate of interest during the year, and the resource price at time t must satisfy:
Pt = Mt + R0(1+r)t = M t + R0eρt
where Pt is the price of the resource at time t, Mt is ex-traction costs at time t, R0 is resource rent at time 0, r is the rate of interest and ρ is rate of interest if computed continuously.
The resource rent thus increases by the rate of interest over the years. Whether this price and the correspond-ing rate of extraction are optimum for society is another problem. If the discounting principle of cost-benefit anal-ysis is accepted, it is not impossible, but this is highly problematic, as discussed above.
It is also problematic whether resource prices will re-flect future resource scarcity. The market price will de-pend on market agents’ preferences for present relative to future consumption, which does not necessarily reflect market agents’ assessment of future raw materials sup-ply: A low price could just as well owe to the fact that the market is myopic, so that the scarcity price increment would be minute until a few decades before depletion. The movements of the market price for oil since 1973 do not follow an exponential growth path.5
We cannot trust the market mechanism to allow for generations yet unborn, even though a profiteering owner of an oil well will let the oil remain in the ground if pro-spective future price rises are sufficiently high. It is true that in theoretical terms market equilibria over long spans of time are possible, and that in theory there is no differ-ence between those living a hundred years from now and, say, those living in Denmark today. Yet, in practical terms
markets only function in the short run, and there is anoth-er, rather more fundamental problem. There is always a large number of possible market equilibria. They produce widely different distributions of the final consumption among market agents, which is precisely the issue here. Which distribution is realised depends on how resource control is distributed at the opening of the market, that is today, when the present generation owns all natural re-sources. The problem confronting future generations is that they do not own anything. It is equally decisive for those living in Denmark how many resources they con-trol, in the short term especially labour and capital.
If future generations are left at the mercy of the mar-ket and an interest rate of say 5%, it will require consid-erable price rises before the market will save anything for posterity. It is possible that the utility value to us of a barrel of oil is 132 times greater now than in a hun-dred years and 17,000 times greater than its utility value in 200 years, which would correspond to a 5% discount rate. Still our great-grandchildren are likely to view things differently. Whether a hundred years is a long time obviously depends upon the point of view, i.e. from which of the two extreme points of the time span it is observed.
Taxation or Tradeable Pollution Permits
Box 25.1.
Assume that there are two polluting enterprises and that total emissions are 225 units, 75 from enterprise A and 150 from enter-prise B. The political target is 75 units of emissions, so that emissions reduction in the two enterprises, RA and RB, should amount to:
RA + RB = 150
Total costs of reduction (TCR) and marginal costs of reduction (MCR) for the two enterprises are different, but both functions reflect that the cost of one further unit of reduction (MCR) in-creases with the amount of reduction already carried into effect: TCRA = 0.10RA2 + 10R A, MCRA = dTCRA/dRA = 0.20RA + 10, 0 ≤ RA ≤ 75, cf. Figure 25.1. TCRB = 0.04RB2 + 5RB, MCRB = dTCRB/dRB = 0.08RB + 5, 0 ≤ RB ≤ 150, cf. Figure 25.1.
The minimum cost solution for RA and RB, given that RA + RB = 150,
is obtained by substitution and differentiation: TCR = TCRA + TCRB
= 0.10RA2 + 10RA + 0.04(150 - RA)2 + 5(150 - RA)
dTCR/dRA= 0.20RA + 10 + 0.08RB(-1) + 5(-1) = 0 0.20RA + 10 = 0.08RB + 5 or MCRA = MCRB,
cf. Figure 25.1.
The minimum TCR solution becomes: RA = 25, RB = 125 and TCR = 1,562.5,
as illustrated in Figure 25.1, where TCR is the sum of the two hatched areas below the MCR curves.
This solution can be obtained by means of various policy instru-ments. One possibility is specific government decrees for emissions for each of the enterprises, but normally the government does not possess specific information on the cost functions of the enterpris-es. If the government roughly decrees that both enterprises should reduce their emissions by two-thirds, total costs of reduction will become TCR = 1650, exceeding the minimum of TCR = 1562.5, cf. the two vertical dot-and-dash lines in Figure 25.1.
Instead, the government can charge the enterprises a price of 15 per unit of emission. Then, as illustrated in Figure 25.1, en-terprise A will reduce emissions by exactly 25 units, because up Figure 25.1. Distribution of pollution reduction costs between two enterprises by means of taxation and tradeable pollution permits.
Taxation or Tradeable Pollution Permits
It is possible to take the welfare of future generations into account without relying on price effects of interest rates. Thus, in Norway, but not in Denmark, part of the re-source rent income from North Sea oil extraction is depos-ited in a government Oil Fund, which is not consumed but invested for the benefit of prospective generations. This policy also mitigates the so-called Dutch disease problem (from the discovery of natural gas in the Netherlands in the late 1950s), namely that large resource rent incomes tend to create a balance of payments surplus and thereby increase the value of the local currency and reduce the competitiveness of other sectors of the economy.
There is one further argument for strong government interference with natural resources, namely that govern-ments need money. The pure resource rent does not origi-nate in any productive activity, but simply from owner-ship of the resource, and taxation of the resource rent is a rare example of an efficient tax in the sense that it will not distort economic decisions; another example is a head tax and other types of lump-sum taxes. Most other taxes, like an income tax or an alcohol tax, inflict distortions upon economic activity, in these particular cases a distor-tion of the supply of labour and a (beneficial) distordistor-tion of alcohol consumption. In addition, it is compatible with
to 25 units the reduction cost per unit is less than 15. Further reductions will cost more than 15 per unit, and the enterprise will prefer to pay the pollution charge. Correspondingly, enterprise B will reduce emissions by exactly 125 units.
It makes no difference whether the pollution charge for the en-terprises takes the form of a tax on emissions or a cost of tradable pollution permits in a cap-and-trade scheme that requires enterpris-es to buy tradable permits for every unit of pollution.
Furthermore, if government supplies 75 units of tradable permits, the market equilibrium price will become exactly 15 per permit. At a price of, say, 10 per permit, enterprise A will demand 75 permits, and enterprise B 87.5 permits; the total demand will be 162.5 units and the price will increase, as it exceeds the supply of 75. At a price of 20, enterprise A will demand 25 units and enterprise B 0 units, that is a total of 25, and the price will decrease.
It makes no difference for the amounts of pollution, the price of permits or the incentive to reduce pollution whether tradable permits are sold at auction or given away for free or to whom they are given, as long as they are given as a fixed amount that does not vary from year to year according to actual amounts of emissions; in the latter case there will be no effect upon emissions. If 75 permits are given for free every year, e.g. 50 to enterprise A and 25 to enterprise B, an extra permit will still be worth 15 for both enterprises. As long as the number of free permits does not depend on actual annual emissions, a unit of pollution still costs the enterprises a price of 15, and ‘grandfathering’ will not imperil incentives to reduce pollution. Thus, the minimum TCR solution can be obtained by all of the four instruments:
1. Specific government decrees to each firm, if government has full information.
2. A pollution tax of 15 per unit.
3. 75 tradable pollution permits sold by auction. 4. 75 tradable permits distributed by grandfathering.
Taxes and tradable permits have essentially identical effects. There are, however, some differences between them:
Firstly, pollution is regulated by price (the tax) of pollution fixed by government in case 2 and by quantity (through the cap) in cases 1, 3 and 4. If government wants a specific quantity, it might be unable to find the proper tax rate in the first place, and it might be necessary to adjust the tax rate in the following years. If it is im-portant to obtain a specific quantity effect at the outset (e.g. for a shoal fish like herring, which can be completely fished up in a short time), quantity regulation will be the solution. For more long-term problems (e.g. CO2 emissions), a tax that is adjusted during a span of years might be sufficient.
Secondly, fiscal effects are different. In cases 2 and 3 the pol-luter will pay, and government receives a revenue, while in cases 1 and 4 there is no government revenue. The possibility of grandfa-thering is probably the main reason for the popularity of tradable permits as opposed to taxes. If permits are given away, not once and for all, but annually depending upon actual amounts of pol-lution of individual enterprises, there will of course be no effect upon pollution at all.
Thirdly, with a tax the price of pollution will be stable, whereas the price of tradable permits can be highly volatile, causing prob-lems for investment planning for pollution reduction. The cap-and-trade schemes for carbon permits in the EU and, since the mid-1990s, for sulphur dioxide permits in the USA, have shown volatile prices, in the USA by more than 40% a year (The Economist, 16 June 2007, p 78).
On top of the costs of reduction come the costs of measur-ing and monitormeasur-ing emissions, which may be considerable or even prohibitive, especially when pollution comes from many, diffuse sources. These costs are the same for the four policy instruments above.
widespread notions of justice that the user right of natu-ral resources should belong to the people and not to any particular individual. It appears that there are heavy argu-ments for heavy taxation of resource rents.
This is especially evident in a country like Russia be-cause of its heavy dependency upon oil, gas and raw ma-terials, which constitute about three-quarters of exports. Competition is not essential from the Russian point of view, and it makes little sense to give away resource mo-nopolies to private capitalists. Taxation of the resource rent is an alternative to public ownership, but the differ-ence between them is negligible. It is not at all obvious concerning property rights of natural resources that ‘pri-vate and privatized enterprises outperformed public en-terprises all over the world’ (Åslund, 2002:260).
Environmental Policy Instruments
No market and hence no market price exist for many eco-logical resources. Urgent problems are linked with emis-sions to the environment caused by resource consump-tion, and even if certain types of polluconsump-tion, notably the most concentrated ones, have been successfully elimi-nated, other and more elusive pollution problems have increased. However, there is no such thing as a market for air with a low CO2 content, or for seawater not
contami-nated with nutrients. Governments must take charge. If a government decides to reduce a certain type of pol-lution by e.g. two-thirds, and there are several polluters with different costs of emission reduction, how can this political target be obtained at minimum cost to society? This is illustrated in detail in a numerical example (Box 25.1), which compares four different ways for govern-ments to reach the target:
1. Specific government decrees to each firm, if gov-ernment has full information.
2. A pollution tax of 15 per unit.
3. 75 tradable pollution permits sold by auction. 4. 75 tradable permits distributed by grandfathering. All these policy instruments are incentives for centrally and politically fixed allocations, i.e. what is normally termed a planned economy. Moreover, the differences between the instruments are easily overrated. Tradable permits are used as an instrument mostly in relation to
pollution, notably CO2 emissions. Curiously, they are
more popular than taxes despite the fact that their effects are largely identical, probably because they are errone-ously considered more consistent with predominant mar-ket fetischism ideology6 – but most likely because
trad-able permits are usually handed out for free in the first place, whereas taxes must be paid from the outset, and also because cap-and-trade schemes allow rich countries to pay poor countries to cut their emissions without in-volving government money. Even administrative regu-lation can become a purely economic incentive in the form of fines, if the public ignores the stigma incurred by the criminal offence of infringing laws and regulations (Aage, 2002:648-650).
No doubt, there are good reasons for using economic and other incentives in environmental policies. Yet they should not be mistaken for a market economy, which is something entirely different, namely that the market is allowed to determine spontaneously and decentrally how resources are to be allocated. On the contrary, environ-mental policy and regulation means central planning: that the allocation (amount of pollution, rate of extraction) is fixed politically in advance, before incentives and mar-kets come into play.
Common Resources Management
Fish stocks and common pasture are a sort of public good, as it is normally difficult to prevent anybody from using them or to collect payment for them. However, they are not pure public goods such as a lighthouse, which can be used by additional ships without harming other users. This does not apply to fish stocks and common pasture, and because of these characteristics there is a tendency for overfishing and overgrazing, ‘the tragedy of the com-mons’, if utilisation is left to individual decisions in the market and not regulated by the government.
The reason is a discrepancy between social and indi-vidual marginal returns and marginal costs. A numerical example which shows sustainable fishing yield as a func-tion of fishing activity (number of fishing-boats) can il-lustrate the problem (See Box 25.2).
In principle the problem is easily solved. The fisher-men could cooperate, but as the number of fisherfisher-men increases, cooperation becomes more difficult, and they could well end up at point C in Figure 25.2. The
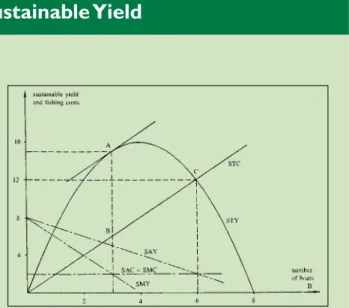
prob-Fishing with Sustainable Yield
Box 25.2.
Figure 25.2. Fishing activity and sustainable yield with and without government regulation.
The curve in Figure 25.2 shows sustainable fishing yield as a func-tion of fishing activity (number of fishing-boats, B), i.e. the yield after some years with a constant number of boats, so that fish stocks and the annual catch have stabilised. A given annual yield (for example 12) can be obtained with a small and a large number of boats (2 and 6); in the first case the stable stock is large and fishing therefore relatively easy; in the second case the stock is smaller, but the same annual yield can be obtained if more boats are operated. Fish prices are assumed to remain constant. STY = -B2 + 8B social total yield
SAY = STY/B = -B + 8 social average yield SMY = dSTY/dB = -2B + 8 social marginal yield STC = 2B social total costs SAC = STC/B = 2 social average costs SMC = dSTC/dB = 2 social marginal costs
SAC and SMC are identical and are shown as the horizontal dot- and-dash line in Figure 25.2; SAY and SMY are the two other dot-and-dash lines.
If government decides the fishing activity, it will increase the number of fishing-boats until the net addition to total yield from the last boat (SMY) is equal to the costs of the last boat (SAC = SMC, as all boats have identical costs). This maximises total social return (the resource rent):
STR = STY - STC social total return (resource rent) dSTR/dB = -2B + 8 - 2 = 0, or
SMY = SMC, which is obtained for
B = 3, STY = 15 and STR = 9, point A in Figure 25.2.
Then resource rent is at its maximum of STR = 9, i.e. the distance AB in Figure 25.2. It is not the maximum sustainable yield (MSY), which is 16 and would be reached with 4 boats. As the resource rent is positive with 3 boats, social average costs are less than so-cial average yield (SAC < SAY), and SMY = SMC = SAC; hence: SAC < SAY
SMY < SAY
This implies that if new boats are added to the fleet of 3 boats already fishing, the additional catch (SMY) will be less than the average (SAY), and the new boats will thus reduce the average. If left to individual decision this situation, point A, will not be stable. An additional potential fisherman compares his costs and his re-turns. His individual costs are equal to social marginal and average costs (all boats have identical costs). But his individual yield exceeds social marginal yield, and therefore he will start fishing. He only considers his individual returns which equal the social average, as all boats get the same amount of fish. He disregards the fact that
his fishing will depress the average yield of the boats already fishing (social average returns are declining).
IMY = SAY > SMY individual marginal yield, IMC = SMC = SAC individual marginal costs. This will go on as long as
IMY > IMC, and the end result will be:
B = 6, STY = 12 and STR = 0, point C in Figure 25.2.
Total fishing costs will increase, the catch will decline, and the re-source rent will be eliminated because of over-fishing.
lem could still be solved, namely by substituting one sin-gle owner for common ownership, and the sinsin-gle owner could be government or any individual. This also applies to the externality problem of pollution, which is closely related to the common ownership problem:
If costless negotiation is possible, rights are well-spec-ified and redistribution does not affect marginal values, then:
• the market allocation of resources will be identical, whatever the allocation of legal rights,
• the allocation will be Pareto efficient, so that there is no problem of externalities,
• if a tax is imposed, efficiency will be lost.
Coase’s theorem, 1960 (Layard & Walters, 1978:192). However, it is very difficult to establish ownership rights to e.g. clean air, and there will certainly be huge trans-action costs in such a market. Furthermore, government regulation of fisheries has proved extremely difficult, and most of the world’s fish resources are extremely overex-ploited because of the other part of the problem, namely the distribution of the profits, the resource rent (Hanley, Shogren and White, 2001:22-24,152-159).
All of the policy instruments (decrees, taxes and trad-able fishing quotas) could be used for this problem, as well as for pollution and externalities. Taxation of catch-es is highly unpopular. Tradable quotas are used in some countries, e.g. New Zealand, Australia and Iceland. In Greenland quotas for shrimp are given away for free for an indefinite span of years; they are tradable, but few are traded, and prices are not public. In Iceland there is a tax on yield value less costs and wages of 6%, increasing to about 10%.
When ownership has been established, the owner fac-es the same problem as the owner of an exhaustible re-source, namely to maximise resource rent over time, only more complicated because fish is a renewable resource. Reproduction of the fish is taken into account here as well as price changes, but many other possible model complications are left out, e.g. discontinuities, rigidity of capacity adjustment, uncertainty and interaction between several fish stocks.
If extraction costs and fishing costs are ignored, the price rule for the exhaustible resource can be formulated as:
ΔP/P = r
where P is the resource price, ΔP is the price change dur-ing the year and r is the rate of interest.
When considering additional fishing the owner of the fish stocks must take into account not only price chang-es and the rate of interchang-est, but also that his decision will influence the increase in the fish stocks, so the rule be-comes:
F’(X) + ΔP/P = r
where X is the fish stock and F(X) is the annual increase in the fish stock, and F’(X) is the annual percent change in the stock.
When fishing costs depend upon the size of the stock, the rule becomes more complicated. Generally, the op-timal fish stock is lower the higher the unit price, the lower the fishing costs per unit and the higher the in-terest rate. If the price is constant and the inin-terest rate required by the owner is higher than the marginal growth rate of the stock, F’(X), the consequence will be that the renewable resource becomes extinct (Pearce and Turner, 1990:241-261).
Case Study: Agricultural Pollution Policy
in Denmark
The Problem: Eutrophication of the Baltic Sea
In the second half of the 20th century the environmen-tal problems in inner Danish waters became increasingly severe. Recurrent episodes of oxygen deficit harmed – and continue to harm – the fish stocks, including the 1997 catastrophe of the Mariager Fjord, with massive fish deaths and extinction of significant parts of marine life. On its way to the ocean all water from the Baltic Sea and its feeder rivers, including polluting substances, pass through the shallow Danish waters. However, the water from the Baltic Sea entering Danish waters is
pre-sumably less polluted than the water it replaces, partly due to hydrographical conditions, namely that polluted water can be retained in the profound areas of the Baltic Sea. According to data from the late 1980s, Poland con-tributed 33% of the total nitrogen pollution in the Baltic Sea, the Soviet Union 25%, and Denmark, Sweden and Finland together 39% (Aage, 1998:215; Hansen, 1998; Aage, 2002).
The main culprit is intensive Danish agriculture, and the main problem is nitrogen leaching to the sea, about 311,000 tonnes in 1985. Since 1987, three government Action Plans for the Aquatic Environment have aimed at reducing eutrophication from the pollution of coastal wa-ters with nutrients.
The First Plan – Reduction of Nitrogen Leaching
Plan I (1987-1993) aimed at reducing nitrogen leaching to the sea by 49%. For agriculture the target was a reduc-tion of 127,000 tonnes i.e. 20%, but only 51,500 were achieved. The policy instruments were mainly adminis-trative. Besides, there were some expectations concern-ing voluntary agreements, which did not materialise. For municipal wastewater the planned reduction was 15,000 tonnes by means of construction of new municipal waste-water cleaning plants, and this plan was overfulfilled with a realised reduction of 22,371 tonnes, but at a heavy investment cost. It is estimated that the costs of munici-pal wastewater cleaning were 70 DKK per kg reduction in annual nitrogen leaching. The corresponding costs of agricultural nitrogen leaching reduction were 6 DKK per kg (Economic Council, 2004:224-227; Jacobsen, 2004; Hansen, 1998). These costs are total social costs, i.e. total costs for society of resources spent, irrespective of who bears the burden of the costs, whether it is government, municipal tax-payers, farmers or other parties.
The Second Plan – Sustainable Agriculture
Because of this disappointing outcome, Plan I was amended by a Plan for Sustainable Agriculture in 1991 with obligations for farmers concerning accounts for the use of mineral fertiliser and concerning education in tech-nology for spraying fields with chemicals. In 1998 total nitrogen losses were reduced to 207,000 tonnes annually, down from 311,000 in 1985, a reduction of 33% but still far from the original target of 49% for 1993.
Plan II (1998-2003) finally reached the original 1993 target, namely annual nitrogen leaching of at most 162,000 tonnes in 2003 or a reduction of 48% compared with the level of 1985. The instruments were again requirements for accounts of fertiliser usage and stricter norms for ferti-liser usage. For every farm, an economic optimum use of nitrogen in mineral fertiliser was estimated, corrected for the nitrogen content of manure for farms with livestock, and the maximum permitted nitrogen utilisation was set as 90% of the economic optimum. Furthermore, the intensity of agriculture was reduced by increasing the area used as fallow, wetland and woodland and by introducing subsi-dies for organic farming. In 2002, nitrogen contracts were introduced in order to reduce nitrogen where costs were lowest. Farmers were asked to offer a certain reduction in their nitrogen quota in return for compensation. However, all bids were accepted and the costs became very high. The scheme was discontinued in 2004 (Jacobsen, 2004:103).
The average costs in Plan II were 15 DKK per kg re-duction in annual nitrogen leaching. The costs of the 90% norm for nitrogen used were 13 DKK. The most cost-ef-fective options were better utilisation of animal manure at 5 DKK and creation of wetlands at 7 DKK, and the most expensive was subsidies for organic farming at 80 DKK per kg nitrogen reduction (Jacobsen, 2004:95).
The Third Plan - Management of Nitrogen
Plan III (2004-2015) aims at a reduction in nitrogen discharges to 141,000 tonnes or less, i.e. a 13% reduc-tion compared with the level of 2003. The instruments include stricter regulations on growing late crops that accumulate nitrogen, better utilisation of the nitrogen in livestock manure, establishment of new areas of wetlands and woodlands, establishment of crop-free buffer zones along streams and lakes and general set-side of agricul-tural land, partly by means of voluntary agreements.
Estimated reduction costs are on average 25 DKK per kg nitrogen leaching reduction and vary from 10 DKK per kg nitrogen reduction by using late crops to 90 DKK per kg by establishing new forests and about 300 DKK per kg by establishing biogas plants. Cost estimates dif-fer according to the absolute size of intended effects and the valuation of beneficial side-effects (Jacobsen et al., 2004:97,128; Economic Council, 2004:226; Jacobsen, 2004:95; Hansen et al., 2003:20,27).
Comparing the Three Plans
The widely differing cost-effectiveness of various instru-ments in all three plans is partly explained by the fact that the plans had several other purposes than reducing nitrogen discharges. Other types of pollution also had to be reduced, especially phosphorus and pesticide pollution in the sea and in surface water and groundwater resourc-es. Other purposes included general nature conservation, protection of biodiversity, and provision of recreational services for the population.
However, it is widely considered that there is room for improving the cost-effectiveness of policy instruments, especially by introducing economic incentives. So far in-struments have been mainly administrative, with an ele-ment of voluntary agreeele-ments. The use of pollution taxes – or tradable pollution permits – is complicated by heavy monitoring costs, because of the diffuse character of pol-lution sources. One possibility is to tax mineral fertilisers as a proxy for pollution, and a tax on phosphorus input to agriculture is in fact included in Plan III.
A more cost-efficient instrument would be a tax where the tax base for individual farms is nitrogen input in fer-tiliser and feed less the nitrogen content in farm output. This comes close to a tax on nitrogen losses from farms to the environment, except that nitrogen accumulation in late crops would not be taken into account. The tax would provide proper incentives for farms to allocate nitrogen reductions efficiently inside individual farms and be-tween farms, as illustrated in Box 25.1. Monitoring costs would probably also be lower than for the administrative instruments currently used. The order of magnitude of efficiency gains from using a tax compared with admin-istrative instruments is estimated at 3 DKK per kg nitro-gen loss reduction, or about 20% for plan II (Hansen & Hasler, 2007:55-59; Jacobsen et al., 2004).
A tax (or tradable permits) would not eliminate the need for supplementary administrative regulation, be-cause the level of nitrogen pollution permitted is lower than average for some particularly sensitive areas, so that it is not only global nitrogen leaching that matters, but also its local distribution.
Long-term Democratic Decisions:
Environment Boards
Besides the operational contributions to ecological sci-ence concerning book-keeping, developments of resource market prices, and the analysis of institutions and policy instrument incentives, there is an important general les-son for environmental policy and democracy to be learned from economics.
At the core of environmental policy problems is the inborn myopia of human nature and the inability to com-pare future hardships against present gains. Long-term foresight is not the forte of the free market, or of politi-cians. Thus the need for long-term decisions presents a problem for the two principal mechanisms of democracy: the market and the political system. However, examples exist of successfully coping with the time problem. Thus in monetary policy the problem is the balancing of present gains (printing money instead of collecting taxes) against future hardships (destruction of the monetary system). A workable, democratic solution has in some cases been successfully achieved, namely that democratically elect-ed politicians devolve monetary authority to an independ-ent cindepend-entral bank, which enjoys confidence and is circum-scribed by strict laws. A more extreme form of independent monetary authority is the system of ‘currency boards’, as known in several former British colonies and recently in the Baltic States and Argentina. Correspondingly, one could imagine an institution of ‘environmental boards’. In Sweden the Vattendomstolen (Water Court) is an ad-ministrative body with some independent, discretionary powers to make decisions concerning construction plans, which may affect the environment, especially construc-tion of hydroelectric power plants.
Environmental issues are taken increasingly seriously by influential economists as witnessed by the manifesto of Arrow et al. (1995, 2004) and by the impressive Stern Review (2006) and Weitzman (2007). Hopefully, the changing attitudes among prominent economists herald a new, constructive role for economics in environmental policy. It is badly needed, as moral reorientation is re-quired if we want to move ahead in less blind darkness than we used to do in the past (this is the true lesson of history) and if we want to approach the global environ-ment and the global distribution – the major challenges of
our time – in a civilised manner without resorting to the familiar regulatory mechanisms, namely wars, famines, migrations and pandemics.
Endnotes:
1. Andersen & Pedersen, 2005:191,200; the confidence in future growth rates of about 2% is widespread among economists for obscure reasons, cf. Weitzman, 2007:707,720.
2. Suppose that Judas kept his 30 pieces of silver and deposited them at a moderate 3% rate of interest. If they weighed 249.6 g in the year 30 A.D., the amount to day, 1977 years later, would be 5.976*1024 kg, which equals the total mass of Planet Earth. A fairly good approxima-tion is that a capital on interest at r per cent per annum doubles every 70/r years.
3. This applies to the excellent and widely used textbooks by N.G. Mankiw (2000) and M. Burda & C. Wyplosz (1993).
4. Interestingly, the fronts regarding green amendments to national ac-counts have been reversed: Environmentalists used to criticise econo-mists for not including environmental effects; now, when attempts are made to do so and true savings appear to be positive, economists are still being criticised, though the criticism has switched sign. Previously, economists used to say, How can I put a price on the lark’s song? Now the environmental organisations are saying with contempt, Two pounds of larks, or two French lessons? .
5. Moreover, for oil, an appreciation based on calorific value only would seem short-sighted, since oil is a combination of chemical compounds with many other and more sophisticated applications than combustion. 6. World Bank, 2003:32; The Economist, 23 April 2005, pp 11,78-80. However this market fetishism ideology might now be on the retreat, cf. The Economist, 9 September 2006, p 9 and 16 June 2007, p 78; Aage, 2008.
Hardin, G. 1968. ”The Tragedy of the Commons”, In: Science, vol. 62, pp. 1243-1248.
Inglehart, R. 1990. Culture Shift in Advanced Industrial Society, Princeton.
Lipset, S.M. 1959. Political Man, London: Heinemann.
Maier, J., 1990. The green parties in Western Europe – a brief history,
their successes and their problems. at: http://www.globalgreens.org/
literature/maier/westerneurope (retrieved 20120925).
Müller-Rommel, F. 2002. “The Lifespan and Political performance of Green Parties in Western Europe” In: Environmental Politics, vol. 11. no1. pp. 1-16.
Norgaard, O. and Pedersen, K.H. 1994 “Political and administrative preconditions for environmental policies in the Baltic States” in Katarina Eckerberg et al. Comparing Nordic and Baltic Countries- environmental problems and policies in agriculture and forestry, In:
TemaNord:572, pp. 98-122.
Olsen, S.B., Sutinen, J.G. Juda, L., Hennessey, T.M. and Grigalunas, T.A. 2006. A Handbook on Governance and Socioeconomics of
large marine Ecosystems, University of Rhode Island. http://www.
iwlearn.net/abt_iwlearn/pns/learning/lme-gov-handbook.pdf (re-trieved 20120925)
Olson, M. 1965. The Logic of Collective Action, Cambridge, Mass: Harvard university Press.
Ostrom, E. 1990. Governing the Commons: The Evolution of Institutions
of Collective Action, Cambridge: Cambridge University Press.
Pedersen, Karin Hilmer and Gert Tinggard Svendsen 2011. ”Farmers as climate heroes?” (in Danish) In: Politica, vol. 43; 4. pp. 459-477. Pedersen, Karin Hilmer and Gert Tinggard Svendsen work in process. Semeniene and Zylicz, 1997
Svendsen, Gert Tinggard 2003. The Political Economy of the European
Union. Institutions, Policy and Economic Growth, Cheltenham,
Edward Elgar.
Truman, D. 1951. The Process of Government, New Your: Knopf Press. Weale, A. 1992. The New Politics of Pollution. Manchester/New York:
Manchester University Press.
World Commission on Environment and Development, 1987
World Development Indicators 2012 at:
http://data.worldbank.org/data-catalog/world-development-indicators (accessed october 2012).
World Justice Project Index 2011. http://worldjusticeproject.org/sites/
default/files/WJP_Rule_of_Law_Index_2011_Report.pdf
Chapter 23
Ministry of Agriculture and Rural Development, 2005. Rural
develop-ment plan for Poland 2004-2006.
Ministry of Agriculture and Rural Development, 2006a. Rural
develop-ment programme for 2007-2013.
Ministry of Agriculture and Rural Development, 2006b. National
stra-tegic plan 2007-2013.
Motyka K., 2007: The EUruralis is approaching, what do we do?
Policy-science interface in rural development practice in Poland.
MSc thesis, Warsaw University of Life Sciences, Interfaculty Department of Environmental Protection, p.132
Poland Central Statistical Office, 2007 http://www.stat.gov.pl (retrieved 20120925)
Chapter 25
Andersen, T.M. and Pedersen, L.H. 2005. Demography, prosper-ity dilemmas and macro-economic strategies (in Danish). In:
Nationaløkonomisk Tidsskrift 143 (November 2005, No.
2):189-229.
Arrow, K., Bolin, B., Costanza, R., Dasgupta, P., Folke, C., Holling, C.S., Jansson, B.-O., Levin, S., Mäler, K.-G., Perrings, C. and Pimentel, D. 1995. Economic growth, carrying capacity, and the environment. In: Ecological Economics 15 (November 1995, No. 2):91-95. Reprinted from Science 268 (1995):520-521.
Arrow, K., Dasgupta, P., Goulder, L., Daily, G., Ehrlich, P., Heal, G., Levin, S., Mäler, K.-G., Scheider, S., Starrett, D. and Walker, B. 2004. Are we consuming too much?. In: Journal of Economic
Perspectives 18 (Summer 2004, No. 3):147-172.
Burda, M. and Wyplosz, C. 1993. Macroeconomics. A european text. Oxford: Oxford University Press.
Cekanavicius, L., Semeniene, D., Oosterhuis, F. and Ierland, E.V. The cost of pollution. In: Rydén et al. 2003. Chap. 19, pp 566-597 Danish Ministry of Finance ; Finansministeriet. 1999. Manual for
so-cial and economic cost-benefit analysis (in Danish). Copenhagen: Ministry of Finance.
Economic Council. 2004: The Danish Economy, Autumn 2004. København: Det Økonomiske Råd.
The Economist, 16 June 2007, p 78
Hanley, N., Shogren, J.F. and White, B. 2001. Introduction to
environ-mental economics. Oxford: Oxford University Press.
Hansen, A.C. Denmark: Energy Efficiency, Water Purification, and Policy Instruments 1998. In: Aage, H. (ed.) 1998. Environmental
transition in Nordic and Baltic countries. Chap. 7, pp. 94-108
Hansen, A.S., Furu, A., Kjellingbro, P.M., Skotte, M. and Vigsø, D. 2003. Knowledge, values and choice. Action plan for the aquatic
en-vironment III (in Danish). København: Institut for Miljøvurdering.
Hansen, L.G. and Hasler, B. 2007. Is regulation of the nitrogen loss to the aquatic environment cost efficient? (in Danish). In: Halsnæs, K, Andersen, P. and Larsen, A. (eds.): Miljøvurdering på økonomisk
vis. København: Jurist- og Økonomforbundets Forlag. Chap. 3, pp
51-68
Jacobsen, B.H. 2004. Final Economic Evaluation of the Action Plan for
the Aquatic Environment II (in Danish with an English summary).
Rapport nr. 169. Copenhagen: Fødevareøkonomisk Institut. Jacobsen, B.H., Abildtrup, J., Andersen, M., Christensen, T., Hasler, B.,
Hussain, Z.B., Huusom, H., Jensen, J.D., Schou, J.S. and Ørum, J. E. 2004. Costs of reducing nutrient losses from agriculture. Analysis
prior to the danish aquatic programme III (in Danish with an English
summary). Rapport nr. 167. Copenhagen: Fødevareøkonomisk Institut.
Layard, P.R.G. and Walters, A.A. 1978. Microeconomic Theory. New York: McGraw-Hill.
Lomborg, B. 1998. Article. In: the Danish newspaper Politiken, 19 January 1998.
Lomborg, B. 2001. The skeptical environmentalist: Measuring the real
state of the world. Cambridge: Cambridge University Press.
Maddison, A. 1991. Dynamic forces in capitalist development. A
Maddison, A. 2003. The world economy. Historical statistics. Paris: OECD.
Mankiw, N.G. 1997. Principles of macroeconomics. Fort Worth: The Dryden Press.
Mankiw, N.G. 2000. Macroeconomics (4th ed.). New York: Worth. McNeill, J. 2001. Something new under the sun. An environmental
his-tory of the twentieth century. London: Penguin.
Nordhaus, W.D. 1994. Managing the global commons: The economics
of climate change. Cambridge, Mass: The IMT Press.
Nordhaus, W.D. A review of the Stern review on the economics of cli-mate change . In: Journal of Economic Literature 45 (September 2007, No. 3): pp. 686-702.
Pearce, D.W. and Turner, R.K. 1990. Economics of natural resources
and the environment. London: Harvester Wheatsheaf.
Plenty of gloom. In: The Economist, 18 Dec 1997 http://www.economist. com/node/455855 (retrieved 20120925)
Ponting, C.A 1991. Green history of the world. Harmondsworth: Pen-guin.
Rydén, L., Migula, P. and Andersson, M. (eds.) 2003. Environmental
science. Uppsala: Baltic University Press.
Solow, R. 1974. The Economics of Resources and the Resources of Economics . In: American Economic Review 64 (No. 2, May 1974):1-14.
Solow, R. 1992. An almost practical step towards sustainability. Washington D.C. Resources for the Future.
Stern, N. (ed.) 2007. The economics of climate change. (The Stern Review, HM Treasury Independent Review). Cambridge: Cam-bridge University Press.
Stiglitz, J.E. 2000. Economics of the public sector. 3rd ed. New York: Norton.
Weitzman, M.L. 2007. A review of the Stern Review on the econom-ics of climate change . In: Journal of Economic Literature 45 (Sep-tember 2007, No. 3):703-724.
World Bank. 2003. Sustainable development in a dynamic world. World
development report 2003. New York: Oxford University Press.
Aage, H. 1984. Economic arguments on the sufficiency of natural re-sources . In: Cambridge Journal of Economics 8 (March 1984, No. 1): 105-113.
Aage, H. (ed.) 1998. Environmental transition in Nordic and Baltic
countries. Cheltenham: Edward Elgar.
Aage, H. 2002. The environment . In: W. Maciejewski (ed.): The
Baltic sea region. Cultures, policies, societies. Uppsala: The Baltic
University Press. Chap. 51, pp 639-650
Aage, H. 2008. Economic ideology on the environment - from Adam Smith to Bjørn Lomborg . In: Global Environment 2008 1 (November 2008, No 2): 8-45.
Åslund, A. 2002. Building capitalism. The transformation of the former
Soviet bloc. Cambridge: Cambridge University Press.
Chapter 26
Autio, M. and Heinonen, V. 2004. To Consume or not to Consume? Young People’s Environmentalism in the Affluent Finnish. In: Young – Nordic Journal of Youth Research, Vol. 12 (2): 137-153. Bauman, Z. 1992. Intimation of Postmodernity. Chatham: Routledge.
Bourdieu, P. 1984. Distinction – A Social Critic of the Judgement of
Taste (translated by R. Nice). London, Routledge & Kegan Paul.
Brower, M. and Leon, W. 1999. The Consumer’s Guide to Effective
Environmental Choices. Three Rivers Press, New York.
Callenbach, E. 2000. Living Cheaply with Style – Spend Less Live
Better. Ronin Books.
Consumer International. http://consumersinternational.org
Cutter, S.L., Mitchell, J.T., Hill, A. Harrington, L., Katkins, S., Muraco,W., DeHart, J., Reynolds, A. and Shudak, R. 2002. Attitudes toward reducing greenhouse gas emissions from local places. In:
Global change and local places: Estimating, understanding, and reducing greenhouse gases. Association of American Geographers.
Global Change in Local Places (GCLP) Working Group. Cambridge, England: Cambridge University Press. Pp. 171-191
Dominguez, J. and Robin, V. 1996. Your Money or Your Life. Penguin Books.
Durning, A.T. 1992. How Much is Enough? – The Consumer Society
and the Future of the Earth. Norton, New York.
Eurostat, 2012a. Motorisation rate: Passenger cars per 1000 inhabitants. http://epp.eurostat.ec.europa.eu/tgm/table.do?tab=table&init=1&pl ugin=1&language=en&pcode=tsdpc340 (retrieved 20120925) Eurostat, 2012b Greenhouse gas emissions (http://epp.eurostat.
ec.europa.eu/tgm/refreshTableAction.do?tab=table&plugin=1&pco de=tsdcc100&language=en)
Eurostat 2007c. Eco-labelling. http://epp.eurostat.ec.europa.eu/tgm/ graphToolClosed.do?tab=graph&init=1&plugin=1&language=en& pcode=tsdpc420&toolbox=legend (accessed 9 February 2008) The UK government gateway to Corporate Social Responsibility http://
www.csr.gov.uk/ (accessed 6 March 2008)
Finnish National Commission on Sustainable Development (FNCSD). 2007. http://www.environment.fi/default.asp?contentid=245442&la n=EN (retrieved 20120925)
Fischer, F. and Hajer, M.A. (eds.) 1999. Living with Nature –
Environmental Politics as Cultural Discourse. Oxford University
Press.
Gabriel, Y. and Lang, T. 1995. The Unmanageable Consumer –
Contemporary consumption and its Fragmentations. London: Sage.
Gabriel, Y. and Lang, T. 2006. The Unmanageable Consumer 2nd ed. London and Thousand Oaks, Sage.
Greenpeace. 2006. The cod fishery in the Baltic Sea: unsustainable and illegal. http://www.greenpeace.org/international/press/reports/cod-fishery-baltic-sea (retrieved 20120925).
Interactive Research Group. 2005. Russian Economic Overview 2005. Libert, B. 1995. The environmental heritage of Soviet agriculture. CAB
International, Sustainable Rural Development Series No. 2. Oxon, UK. 228 pp.
Michaelis, L. and Lorek, S. 2004. Consumption and the Environment
in Europe – Trends and Futures. Danish Environmental Protection
Agency, Environment Project No. 904, Copenhagen, Denmark National Research Council. 2005. Decision making for the environment:
Social and behavioural science research priorities. Panel on Social
and Behavioural Science Research Priorities for Environmental Decision Making. G.D. Brewer and P.C. Stern, editors. Committee on the Human Dimensions of Global Change, Division of Behavioural and Social Sciences and Education. Washington, DC: The National Academic Press. 137 pp, 6 appendices.