Postprint
This is the accepted version of a paper published in Energy Conversion and Management. This paper has been peer-reviewed but does not include the final publisher proof-corrections or journal pagination.
Citation for the original published paper (version of record):
Azimoh, C L., Klintenberg, P., Wallin, F., Karlsson, B., Mbohwa, C. (2016)
Electricity for development:: Mini-grid solution for rural electrificationin South Africa. Energy Conversion and Management, (110): 268-277
http://dx.doi.org/10.1016/j.enconman.2015.12.015
Access to the published version may require subscription. N.B. When citing this work, cite the original published paper.
Permanent link to this version:
Electricity for development: Mini-grid solution for rural electrification in South Africa
1
Chukwuma Leonard Azimoha, Patrik Klintenberga, Fredrik Wallina, Björn Karlssona 2
Charles Mbohwab, 3
a Mälardalen University, School of Business, Society and Engineering, Box 883, SE-721 23 Västerås, Sweden
4
b University of Johannesburg, Department of Quality and Operations Management, Faculty of Engineering and Built
5
Environment, Johannesburg, South Africa 6
leonard.azimoh@mdh.se 7
Abstract
8
The objective of most rural electrification programs in the developing world is to bring
9
about socio-economic development to households. Governments have put in place a
10
number of measures to achieve this goal. Previous studies on rural electrification
11
programs in developing countries show that solar home systems and mini-grid systems
12
are the dominant technologies. Assessments of a pilot hybrid mini-grid project at
13
Lucingweni village have concluded that mini-grid projects are not feasible due to high
14
electricity production costs. As a result efforts towards rural electrification have been
15
focused on the solar home system. Nevertheless, previous studies of the South African
16
solar home system program have shown that the development objectives of the program
17
are yet to be met more than a decade after commissioning. Therefore, this study
18
investigates the viability of a hybrid mini-grid as a solution for rural development in South
19
Africa. Investigations were based on Lucingweni and Thlatlaganya, two rural Villages
20
where the mini-grid and solar home system have been introduced. The mini-grid systems
21
were designed taking into consideration available natural resources and existing load
22
profiles. The results show that a village of 300 households needs about 2.4
23
kWh/household/day of electricity to initiate and sustain income generating activities and
24
that the solar home system is not capable of supporting this level of demand. We also
show that in locations with hydro resources, a hybrid mini-grid system has the most
26
potential for meeting the energy needs of the households in a cost effective manner. The
27
assessment shows that with adequate planning and optimization of available resources,
28
the cost of electricity production can be reduced.
29
Keywords: Mini grid; Solar Home System; Rural Electrification; Techno Economic
30
Analysis; Power quality; Grid Extension Breakeven Distance.
31 32
1. Introduction
33
Even though the Millennium Development Goals (MDG)1 did not specifically mention 34
access to modern energy and clean cooking facilities among its goals, the realization of
35
both is key to the achievement of the MDG [1]. The world energy outlook shows that about
36
1.3 billion people have no access to electricity and about 2.7 billion people still rely on
37
biomass for cooking. More than 95% of these people are either in sub-Saharan Africa or
38
developing Asia, and about 84% live in rural areas [2]. Previous reports have shown that
39
there is a close link between energy access and economic development [3]. Reliable
40
access to electricity has been shown to be a precondition for improving livelihoods in
41
remote rural households [4]. Another study stated that access to electricity will lead to
42
sustainable development and environmental conservation [5]. Despite this, sub-Saharan
43
Africa and developing Asia remain outliers in world energy usage trends [6]. The objective
44
of a majority of rural electrification programs in developing countries is to bring about
45
socio-economic development to poor households. Various measures have been adopted
46
1 In September 2000 world leaders came together at the UN headquarters in New York to adopt the
Millennium Development Declaration to reduce extreme poverty by the year 2015. The most prominent goal is to halve the proportion of people who live of less than 1$ a day by 2015. The other goals concern universal education, gender equality, child health, maternal health, combating HIV/AIDS, environmental sustainability and the creation of a global partnership for development.
by the affected governments to improve energy access to their off-grid populations, but
47
they have met with little or no success. A review of rural electrification programs in
48
developing countries shows that the Solar Home System (SHS) is the foremost
49
decentralized technology used to improve access to energy in rural communities [7].
50
SHS is attractive due to its apparent cost-effectiveness, as most un-electrified households
51
are in remote rural and peri-urban areas where access to the grid is financially non-viable
52
[7]. However, assessment of the development impacts of SHS has also revealed some
53
negative results [8]. An investigation of the developmental impact of the SHS program in
54
Bangladesh found little evidence to show that electricity from SHS supports development
55
[8]. A review of the effectiveness of SHS called into question, the use of public funds to
56
drive SHS programs at the expense of other appropriate technologies [7]. Another review
57
of SHS programs in several countries concluded that despite the social and environmental
58
benefits, the economic viability remains uncertain [9].
59
The South African SHS program was launched in line with the policy objectives of the
60
Integrated National Electrification Program (INEP), which is aimed at increasing energy
61
access to deprived households after the abolition of apartheid. The program initially
62
focused on extension of the national grid, but after the first phase of the program
(1994-63
1999) it became obvious that urban settlers felt greater benefits than rural dwellers [10].
64
This was because Eskom (the main national utility company), who funded the program,
65
found it economically unviable to extend the grid to remote rural areas due to the low
66
income of the inhabitants, dispersed homesteads and low energy demand [10]. Therefore,
67
due to its comparative advantages over the alternatives, SHS was chosen as the preferred
68
technology to electrify rural households [11].
One of the basic elements of INEP is the Free Basic Electricity (FBE) policy, which is
70
aimed at providing electricity access to all South Africans [10]. This policy seeks to
71
address ways and means through which government interventions can bring about
socio-72
economic development to disadvantaged households [12]. For this reason SHS has been
73
used for rural electrification in most remote rural settlements in the non-grid zone2 of South 74
Africa for more than a decade.
75
The SHS program has not achieved this status through its performance, but partly due to
76
huge government spending and the resilience of the Energy Services Companies
77
(ESCOs). The national budget for electrification shows that as of 2013, about ZAR 58
78
million had been spent on the SHS program, and about ZAR 91 million was budgeted for
79
the SHS program in 2014 [13]. Since the inception of the program in 2002 only about
80
68,115 households out of the original target of 500,000 households earmarked for SHS
81
installations have had the system installed [13].
82
Despite substantial government spending on SHS, assessment of the socio-economic
83
impact of the South African SHS program revealed that the energy needs of the
84
households are seldom met due to the low power capacity of the system. Furthermore,
85
the sustainability of the program is facing several challenges which have led to three out
86
of the six energy providers ceasing operations, with another on the verge of opting out
87
[14].
88
The inability of SHS to meet the energy needs of rural households and the policy
89
objectives of FBE, as well as the uncertain sustainability of the program motivate the
90
2 In the South African context, non-grid zones are those areas that do not have foreseeable access to the
search for an alternative energy solution that can meet the energy needs of the rural
off-91
grid populations. Hybrid mini-grid systems have been found to have potential for
92
productive use in Colombia [15]. They also have the potential to alleviate poverty in rural 93
households [16]. However, the use of hybrid mini-grids in rural electrification programs in
94
developing countries has not been widespread due to high investment costs and technical
95
complexity. The low incomes and energy demand of rural households also limits the
96
willingness to invest. This situation lends credence to the argument that a confluence of
97
public and private investments and good regulations are necessary for successful
98
implementation of mini-grid projects in rural communities [15]. A previous study of a hybrid
99
mini-grid project at Lucingweni village in South Africa concluded that mini-grids are not
100
viable due to the high electricity production cost, and that the economies of scale for
101
renewable energy favour the national grid [5]. The Lucingweni mini-grid did not work
102
beyond three months after commissioning, due to the high levelized cost of electricity
103
(LCOE), which was higher than users were willing to pay [5]. An evaluation of the
104
Lucingweni mini-grid project showed that a feasibility study, holistic understanding of the
105
technology’s life cycle and energy needs crucial to ensure sustainability of the project,
106
were missing [17]. Another report opined that since sustainability of projects depends on
107
the ability of customers to pay for services, measures towards local economic
108
development are essential [13].
109
Experience has shown that for a rural electrification program to be sustainable, it must be
110
able to improve the payment capability of the beneficiaries [18]. The argument against the
111
use of the mini-grid system in South Africa has been based on its high electricity
112
production cost. The issues of low power capacity of SHS and its limited socio-economic
development impact on rural households have received little attention. Furthermore, less
114
attention has been given to the mini-grid alternative, partly due to the failure of the
115
Lucingweni pilot mini-grid project and the notion that mini-grids are not feasible in South
116
Africa due to the reported high electricity production cost [5]. This study is focused on the
117
use of hybrid mini-grid systems as an alternative solution to meet the energy needs of
118
rural households in South Africa.
119
In addition, due to the limited success of SHS in bringing development to rural households,
120
this paper also investigates:
121
-The ability of hybrid mini-grid systems to extend the availability of power to rural
122
households without compromising on quality and reliability, so that productive and thermal
123
energy needs are met sustainably.
124
- The optimal energy mix needed to produce electricity at the lowest cost in two South
125
African villages where mini-grid and SHS have been introduced.
126
-The techno-economic justification for including the mini-grid solution in the South African
127
rural electrification program.
128
-How the cost of electricity production in the mini-grid system could be reduced.
129
2. Methods and materials
130
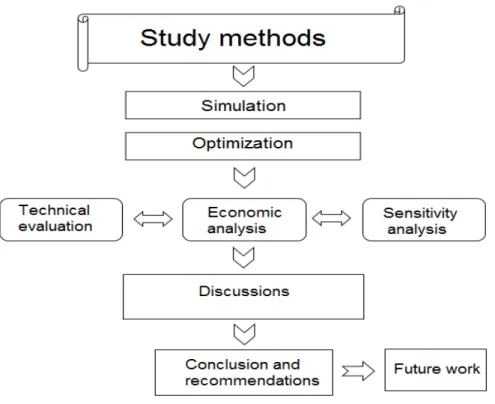
The methods used in this study are illustrated in Figure 1.
132
Figure 1: The research methods used in the study
133
A case study was performed at two locations in South Africa, Thlatlaganya village in
134
Polokwane municipality, Limpopo province (23.5°S and 29.4°E), and Lucingweni Village
135
(32.11°S and 28.46°E) in Eastern Cape Province. System optimization was used to
136
harness the best energy mix from the natural resources available at the two sites. The
137
weather data for the two villages was obtained from the closest station to each village
138
using HOMER™ and RETScreen™ software, i.e. Polokwane for Thlatlaganya and
139
Butterworth for Lucingweni village, at 60 m altitude above sea level and anemometer
140
height of 10 m. Simulations were carried out with 60 minute time steps.
141
142
The average load (0.543 kWh/day) was based on the standard usage pattern of the SHS
143
system at Thlatlaganya village [16], and the load data for the mini-grids was adapted from
144
[5], based on data from the Lucingweni pilot mini-grid project. 300 households were used
as the base case in this study, in line with the South African census figure of 2011 for
146
Thlatlaganya village. The load profile for the two villages was designed to meet the energy
147
needs for domestic use, commerce, agriculture, carpentry, metal works, primary and
148
secondary schools and health services.
149
Evaluation of the economic viability of the hybrid mini-grids was done using financial
150
instruments such as levelized cost of electricity (LCOE), net present cost (NPC), Initial
151
Capital Cost (ICC), operating cost (OC), operation hours (OH), rate of fuel consumption
152
and breakeven grid extension distance (BED). The optimal energy mix and the economic
153
viability of the mini-grid for the two locations were obtained through an optimization
154
process using HOMER™ hybrid energy software. A sensitivity analysis of the systems
155
was performed to assess the impact of varying diesel cost and wind speed on the
156
economics of mini-grid systems. The technical analyses in this investigation were also
157
based on HOMER™ energy model simulations. The power quality of the mini-grids was 158
assessed using the state of charge (SOC) of the battery as an indicator. The expected
159
impact of the electricity from the hybrid mini-grids in Thlatlaganya and Lucingweni was
160
compared with the current state of the SHS program in Thlatlaganya village. The
161
HOMER™ model has been used to assess the feasibility of using renewable hybrid
162
systems to electrify remote rural villages in Cameroon [19], to analyze electricity costs in
163
Rawdat Ben Habbas village in Saudi Arabia [20], and to assess the performance and
164
reliability of a standalone hybrid wind-solar-battery system [21]. It has also been used to
165
compare the techno-economics of SHS and PV micro grids [22] and a range of hybrid and
166
centralized systems [23]. HOMER™ energy model uses the following equations for the
167
techno-economic evaluation of mini-grids.
The total power output from various technologies and energy sources is calculated 169 using equation (1) 170 ∑ ∑ ∑ ∑ ………. (1) 171
Where is the electrical power output from the photovoltaics (PV), and , and
172
are the electrical outputs from wind, hydro and diesel generators respectively.
173
The LCOE is calculated using equation (2)
174
, .
………
(2)
175
, , is the capital recovery factor, is the interest rate (%), is the
176
number of years, is the total net present cost ($), is the marginal cost of the
177
boiler ($/kWh), is the total thermal load served (kWh/yr) and is the total
178
electrical load served (kWh/yr). However, the boiler is excluded in this study, and thus the
179
right side of the numerator is zero while the left side represents the annualized cost of
180
electricity.
181
The total electrical power output from the hydro turbine is given by equation (3)
182
ɳ . . . .
/ … … … ………... ………….. (3)
183
Where ɳ is the hydro turbine efficiency (75%), ρ is the density of water (1000 kg/m3), 184
g is the acceleration due to gravity (9.8 m/s2), h is the effective water head (25 m),and 185
Q is the hydro turbine minimum flow rate (0.25 m3/s). Minimum flow rate ( ) is 186 given in equation (4) 187 . ………. (4) 188 Where, 189
is the minimum flow ratio (50%) and is the designed flow rate (0.5 m3/s). The 190
available flow to the turbine is the difference between the total stream flow and the residual
191
flow rate.
192
The total electrical power output from the PV is given by equation (5)
193
, 1 , … … … … ……… (5)
194
Where is PV derating factor [%], is the PV rated capacity [kW], is the incident
195
global irradiation (kW/m2), , is the incident radiation under standard test conditions 196
(1 kW/m2), is temperature coefficient of power (%, °C), is PV cell temperature [°C] 197
and , is PV cell temperature under standard conditions (25 °C).
198
Generator (diesel) total electrical power output is adapted from equation (6)
199
. . ………….……….. (6)
200
Where, is the electrical output of the generator, is the fuel consumption rate (l/h),
201
is the fuel curve intercept coefficient ( / / ), is the rated capacity of the
202
generator (kW), and is the fuel curve slope ( / / ).
203
The state of charge of the battery system in a hybrid mini-grid during discharge is given
204 in equation (7) [24]. 205 1 . 1 ɳ … … … 7 206
The state of charge when the battery is charging is given in equation (8).
207
1 . 1
ɳ . ɳ … … … . 8
Pb (t-1) and Pb (t) are the battery energy at the beginning and the end of the interval t 209
respectively, (t) is the load demand at the time t, Ph (t) is the total energy generated by
210
PV array, diesel and wind generators at time t, σ is the self-discharge factor and ɳ and
211
ɳ are the battery charge and inverter efficiency (80% and 90% respectively) as obtained
212
from HOMER™ data.
213 214
2.1 Description of the two study areas
215
Thlatlaganya village is situated several kilometers from Polokwane in Polokwane
216
municipality in the Limpopo province of South Africa. Thlatlaganya is one of the villages
217
under the South African SHS concession program. According to the population census of
218
2011 there are around 300 households in Thlatlaganya village, with an average of 4
219
inhabitants per household. The elderly rely mostly on pension income for subsistence.
220
The young depend mostly on subsistence farming and daily paid jobs, while the
221
unemployed rely on grants from relatives and well-wishers. The national grid is available
222
at the periphery of Thlatlaganya village, and most households that can afford the
223
connection fees are connected. Most of those who can afford the Eskom connection fees
224
and tariffs are middle income earners, comprising mainly of retirees and those who
225
alternate living between the city and the village. The poorer members of the community
226
who cannot afford the fees depend on SHS for electricity.
227
The wind profile of Thlatlaganya village indicates an average of 2.93 m/s and the average
228
daily solar irradiation is 5.43 kWh/m2/day. The annual average ambient temperature is
229
17.7°C (Table 1). The SHS used at Thlatlaganya consists of a 75 WP solar panel, a charge
230
controller, and a 100Ah, 12 V battery system.
Lucingweni village is situated in the Transkei region in Ndayeni municipality within OR
232
Tambo district municipality in the Eastern Cape Province of South Africa. The inhabitants
233
are mostly Xhosa tribespeople, the main occupation is farming, and most people depend
234
on agriculture for subsistence. The elderly depend on pensions and grants for their
235
income. As well as the advantage of proximity to the coast and thus high wind speeds,
236
Lucingweni also has high solar irradiation. The average wind speed is 5.6 m/s and
237
average daily solar irradiation is 4.74 kWh/m2/day. The annual average ambient 238
temperature is 19.38°C. The flow rate of the Mbashe River at the nearby Mpozolo village
239
based on 2014 hydrology data was used as the hydro resource for the study [25]. The
240
records show an average flow of 30.75 m3/s with the highest flows recorded in February 241
and March, and the lowest flow in September (Table 1). The Lucingweni pilot mini-grid
242
project was the first of its kind in South Africa. It was designed to supply electricity to 220
243
households, using 6 x 6 kW wind turbines, 560 x 100 W solar panels, 10140 Ah battery
244
storage, 12 x 2.5 kW inverters and 4 x 15 solar regulators [5].
245
Table 1: Mbashe River 2014 flow rate
246
247
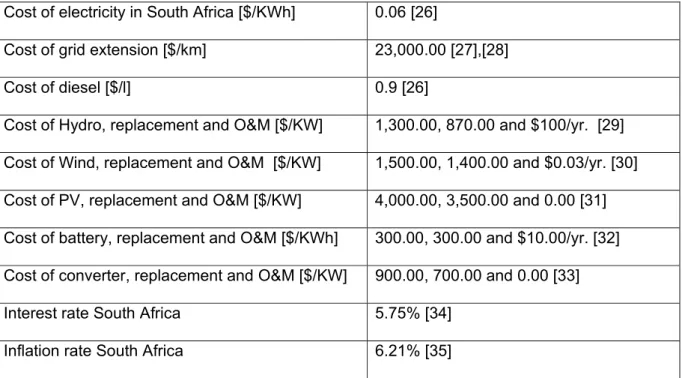
2.2 Costs of components and materials used for calculations in the study
The costs and materials used in the study were based on published data from international
249
organizations and reports from local institutions (Table 2).
250
Table 2: Costs of components and materials
251
Cost of electricity in South Africa [$/KWh] 0.06 [26]
Cost of grid extension [$/km] 23,000.00 [27],[28]
Cost of diesel [$/l] 0.9 [26]
Cost of Hydro, replacement and O&M [$/KW] 1,300.00, 870.00 and $100/yr. [29] Cost of Wind, replacement and O&M [$/KW] 1,500.00, 1,400.00 and $0.03/yr. [30] Cost of PV, replacement and O&M [$/KW] 4,000.00, 3,500.00 and 0.00 [31] Cost of battery, replacement and O&M [$/KWh] 300.00, 300.00 and $10.00/yr. [32] Cost of converter, replacement and O&M [$/KW] 900.00, 700.00 and 0.00 [33] Interest rate South Africa 5.75% [34]
Inflation rate South Africa 6.21% [35] 252
2.3 Assumptions and limitations of the study
253
It was assumed that: the prevailing foreign exchange rate at the time of the investigation
254
was $1 USD to ZAR 10; the load usage pattern was the same for every household; the
255
mini-grid and SHS project lifetimes were both 25 years; and security lights were the only
256
source of energy consumption during the night. 257
The limitations of the study were: non-availability of primary data on the actual cost of
258
components used for the implementation of the hybrid mini-grid project, leading to reliance
259
on international published data; absence of the actual usage pattern in the load profile
260
therefore the load profile was based on an estimate of the average household loads;
limited options for reducing the excess electricity produced with the hydro turbine since
262
only one model is available in HOMER™ Hybrid Energy Software.
263
3 Results
264
3.1 Technical evaluation of the mini-grid and solar home system
265
Technical evaluation of the systems was intended to compare the integrity of power
266
provided by the mini-grid with that from SHS given the low power capacity of the system
267
which hampers its ability to support income generating activities.
268
3.1.1Electricity production capability of the Thlatlaganya mini-grid and the Solar Home
269
System
270
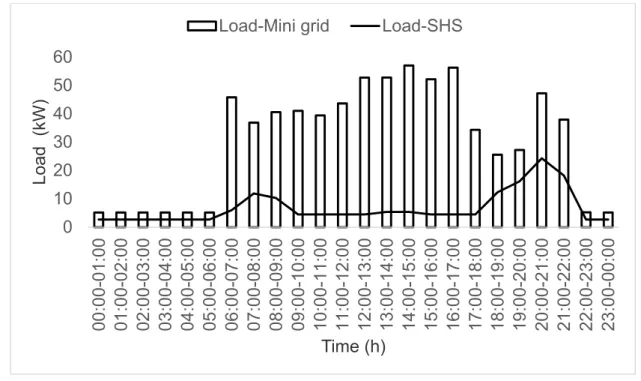
Analysis of the designed mini-grid system show that the amount of electricity demand of
271
the households is 732 kWh/day representing about 2.4 KWh/day/household. The peak
272
load in the morning corresponds to an increase in domestic activities such as water
273
heating, ironing and cooking of breakfast. There is high electricity usage between 08:00
274
and 18:00 which is necessary to support productive activities during the day (Fig. 2). The
275
base load occurs mostly at night, during which the supply only has to power street lights
276
and household security lights. The total load for each household using SHS in
277
Thlatlaganya is 0.543 kWh/day, while the total load for the 300 households is 163
278
kWh/day. Peak loads occur in the morning and in the evening corresponding to lighting,
279
radio and TV use at these times. The base load between 08:00 to 18:00 is an indication
280
of minimal activities during the day, when the only demand is from charging phones and
281
radio use.
283
Fig. 2 Load profile for mini-grid and the solar home system.
284
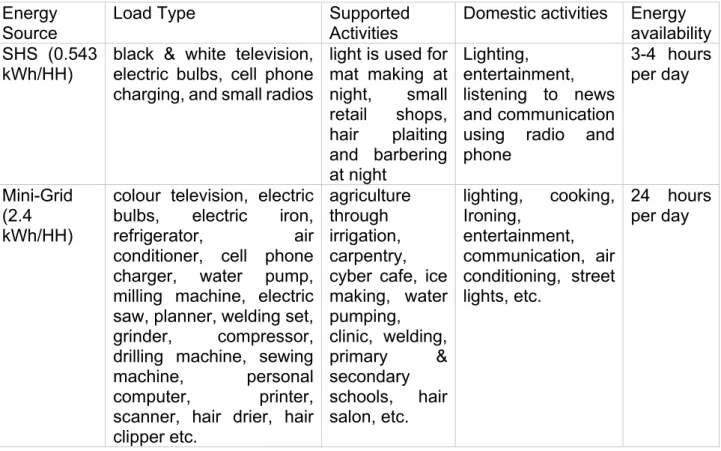
3.1.2 Comparison of activities supported by mini-grid and SHS
285
The assessment of the operation of the mini-grid system shows that it is able to extend
286
electricity availability to the households for 24 hours, supporting activities such as lighting,
287
refrigeration, agriculture (irrigation, milling), carpentry, education, health, security services
288
and other small scale enterprises. This is in contrast to the SHS which supplies intermittent
289
electricity for around 3 to 5 hours per day and is used mostly at night for lighting and
290
entertainment purposes (Table 3).
291 292 293 294 295 296 297 0 10 20 30 40 50 60 00 :0 0-01:00 01 :0 0-02:00 02 :0 0-03:00 03 :0 0-04:00 04 :0 0-05:00 05 :0 0-06:00 06 :0 0-07:00 07 :0 0-08:00 08 :0 0-09:00 09 :0 0-10:00 10 :0 0-11:00 11 :0 0-12:00 12 :0 0-13:00 13 :0 0-14:00 14 :0 0-15:00 15 :0 0-16:00 16 :0 0-17:00 17 :0 0-18:00 18 :0 0-19:00 19 :0 0-20:00 20 :0 0-21:00 21 :0 0-22:00 22 :0 0-23:00 23 :0 0-00:00 Loa d (kW) Time (h)
Table 3:Activities supported by SHS and the mini-grid system
298
Energy
Source Load Type Supported Activities Domestic activities Energy availability SHS (0.543
kWh/HH) black & white television, electric bulbs, cell phone charging, and small radios
light is used for mat making at night, small retail shops, hair plaiting and barbering at night Lighting, entertainment, listening to news and communication using radio and phone 3-4 hours per day Mini-Grid (2.4 kWh/HH)
colour television, electric bulbs, electric iron,
refrigerator, air conditioner, cell phone
charger, water pump, milling machine, electric saw, planner, welding set, grinder, compressor, drilling machine, sewing
machine, personal computer, printer, scanner, hair drier, hair
clipper etc.
agriculture through irrigation, carpentry, cyber cafe, ice making, water pumping, clinic, welding, primary & secondary schools, hair salon, etc. lighting, cooking, Ironing, entertainment, communication, air conditioning, street lights, etc. 24 hours per day 299
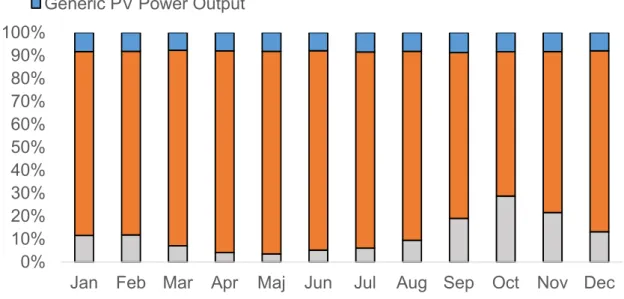
3.1.3 Energy mix and technology choice
300
The optimization of the energy resources available at Thlatlaganya show that the optimal
301
energy mix for the hybrid mini-grid system is a combination of a 50 kW diesel generator
302
(50 kW Genset), 14 kW PV, 140 kW wind generator (Generic10kW), 150 kW converter
303
and 400 kWh battery system which combine to meet the 732 kWh/day energy demand.
304
The PV and wind generator provide 20% of the energy mix, with the remainder being
305
provided by the diesel generator (Fig. 3). Optimization of the energy resources at
306
Lucingweni results in an optimal mix with least cost of 92 kW hydro power, 60 kW wind
307
energy generator, 50 kW diesel generator, 150 kW converter and 200 kWh battery system.
308
The renewable energy fraction is 99% with 81% of the electricity production coming from
the hydro power, while 18% is from the 10 kW wind generator and about 1% is provided
310
by the diesel generator (Fig. 4). The renewable energy fraction for the SHS is 100%.
311
312
Figure 3: Energy mix for Thlatlaganya mini-grid project
313 314 315 0% 10% 20% 30% 40% 50% 60% 70% 80% 90% 100%
Jan Feb Mar Apr Maj Jun Jul Aug Sep Oct Nov Dec
Generic 10 kW Wind Power Output 50kW Genset Power Output Generic PV Power Output
0% 10% 20% 30% 40% 50% 60% 70% 80% 90% 100%
Jan Feb Mar Apr Maj Jun Jul Aug Sep Oct Nov Dec
Generic 10 kW Power Output Hydro Power Output 50kW Genset Power Output
Fig. 4. Energy mix for Lucingweni mini-grid project
316 317
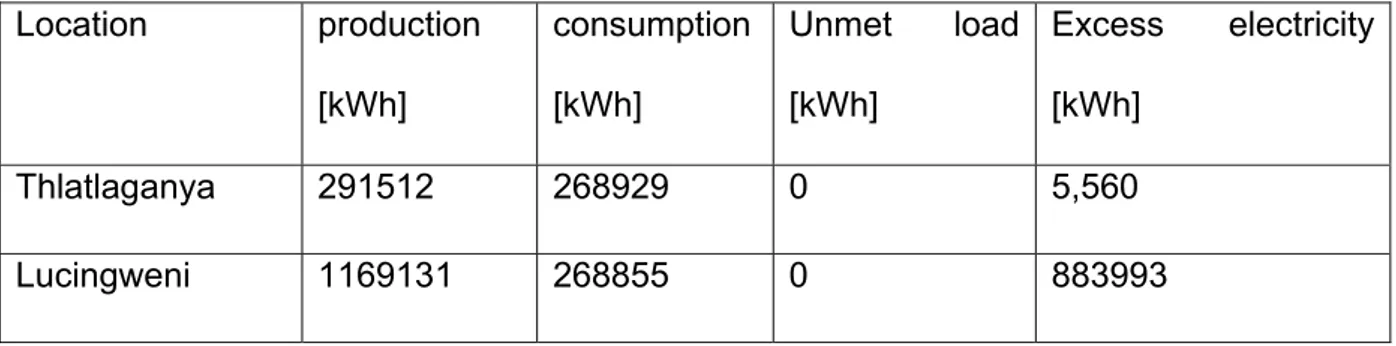
3.1.4 Electricity production capacity of the two mini-grids
318
The electricity produced by the two optimized mini-grid systems is able to meet the loads
319
with excess production. Some of the excess electricity produced is used by the pumping
320
machine as dump loads. This shows that the mini-grid systems are able to meet loads
321
capable of supporting domestic, social and economic activities as designed, which is a
322
precondition for the establishment of small and medium scale businesses. The simulation
323
shows that there is around 75.6% excess electricity in the Lucingweni mini-grid, while
324
there is around 2% excess in the Thlatlaganya mini-grid (Table 4).
325
Table 4: Electricity production profile of the two mini-grids
326 Location production [kWh] consumption [kWh] Unmet load [kWh] Excess electricity [kWh] Thlatlaganya 291512 268929 0 5,560 Lucingweni 1169131 268855 0 883993 327
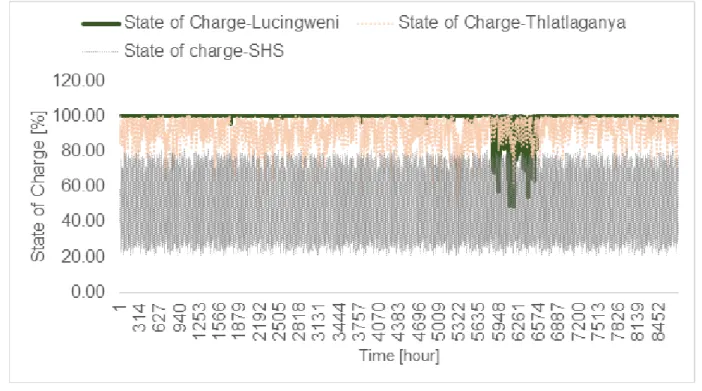
3.1.5 Assessment of power quality of mini-grid and solar home system using the state of
328
charge of the battery
329
The results from the simulations show that there is less reliance on batteries in the
mini-330
grid than in the SHS (Fig. 5). The SOC in the mini-grids show that Lucingweni and
331
Thlatlaganya are able to achieve around 99% and 93% SOC respectively during
operations. The occasional dips in the amplitude of the oscillations indicates occasions
333
when the system is more reliant on batteries to meet the electricity demand. The
334
noticeable dip indicated by the green line for the Lucingweni mini-grid is a result of the
335
reduced flow of the Mbashe river during the month of September, when the average flow
336
rate of 30.75 m3/s drops to 2.02 m3/s (see Fig. 1). At this period, the system relies more 337
on the battery and the 50 kW generator to meet the shortfall in electricity generation
338
resulting in excess electricity being drawn from the battery. The frequent rise and fall in
339
the amplitude of oscillation in the SOC for the SHS indicated by the grey dotted lines
340
shows that the battery is constantly under load (Fig. 5). The system constantly relies on
341
the battery in order to meet the energy needs during operation. The SOC of the SHS
342
achieved under these conditions is about 50%.
343
344
Fig. 5. State of charge of the battery in the mini-grids and Solar Home System
345 346
3.2 Economic evaluation of the mini-grids
347
The economic evaluation of the two mini-grids provides information on the cost of
348
implementation and operation during the life cycle of the systems.
349
3.2.1 Economic analysis of the two mini-grids
350
The evaluation of the economics of the two mini-grids reveals that the LCOE is $0.08/kWh
351
for the Lucingweni mini-grid, and $0.41/KWh for the Thlatlaganya mini-grid (Table 5). The
352
LCOE for both sites is higher than the current cost of electricity from the national utility
353
company Eskom, which is $0.06/kWh [26]. Despite this the LCOE for the optimized system
354
is lower than the actual LCOE obtained for the Lucingweni pilot mini-grid project. A
355
previous study showed that the LCOE for the Lucingweni project had to be about
356
$0.14/KWh for the electricity production cost to be recovered. This situation contributed to
357
the failure of the project [5].
358
Table 5: The economic analysis of the two mini-grid systems
359
Location IC [$] LCOE [$] NPC [$] OC [$]
Thlatlaganya 357,000 0.41 2,884,578 95,509
Lucingweni 240,000 0.08 558,018 12,017
360
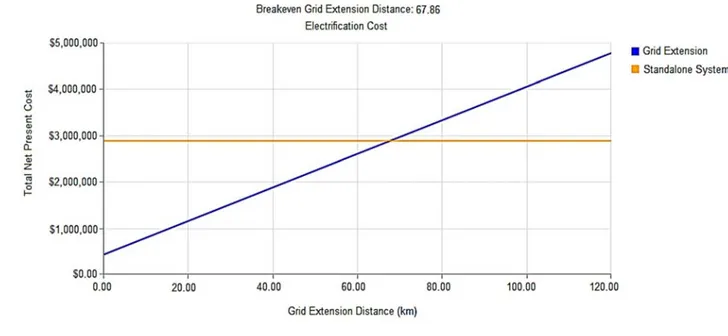
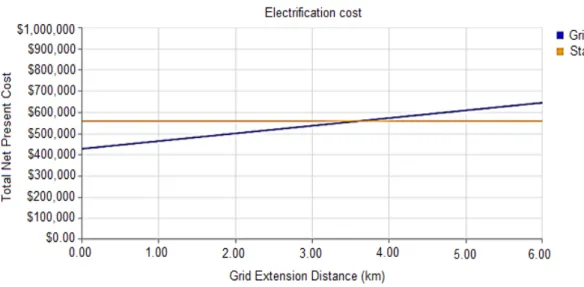
3.2.2 Grid extension breakeven distance
361
According to HOMER™ the breakeven grid extension distance (BED) is defined as the
362
distance at which the total NPC of the grid extension is equal to the total NPC of the
stand-363
alone system. The results from HOMER™ simulations show that the BED is about 68 km
for Thlatlaganya village. This means that extending the grid to Thlatlaganya makes
365
economic sense if the distance from the grid is ≤ 68 km, beyond this distance the cost
366
exceeds that of a standalone mini-grid (Fig. 6). The BED for the Lucingweni mini-grid
367
obtained in this study is about 4 km (Fig. 7). However, during the implementation of the
368
pilot mini-grid project the grid was about 17 km away from Lucingweni village, and it is
369
currently about 11 km away. Nevertheless, the pilot mini-grid project was installed at a
370
BED of about 21 km when it was implemented [5].
371
372
Fig. 6. Grid extension breakeven point for mini-grid in Thlatlaganya
374
Fig. 7. Grid extension breakeven point for the mini-grid in Lucingweni
375
3.2.3 Fuel consumption profile for Thlatlaganya mini-grid
376
The total fuel consumption per year for the Thlatlaganya mini-grid is 72,640 L, and the
377
average consumption per day is about 199.04 L. The box and whisker plot shows that the
378
daily average fuel consumption is about 8.30 L and maximum consumption per day is
379
about 16 L (Fig. 8). The average consumption rate is higher in the winter months from
380
March to August.
381
382
Fig. 8. The fuel consumption profile for the mini-grid in Thlatlaganya
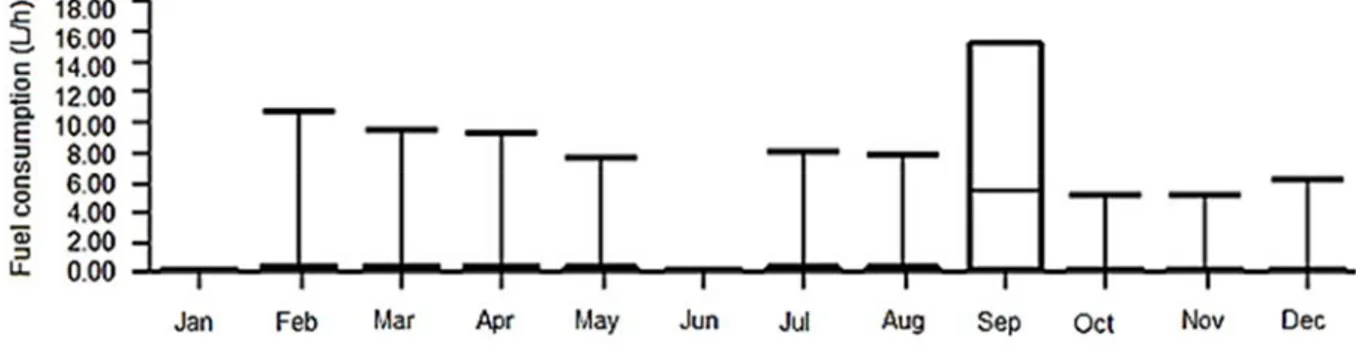
3.2.4 Fuel consumption for Lucingweni Mini-grid.
384
The mini-grid in Lucingweni Mini-grid has an average fuel consumption per year of about
385
3,883.60 L, and the average daily consumption is about 10.64 L. The box and whisker
386
plot indicates an average hourly monthly consumption rate of about 0.44 L. The maximum
387
fuel consumption of 16 L occurs in September (Fig. 9). The average fuel consumption is
388
low throughout the year, except in September when the flow rate of the Mbashe River falls
389
from the average of 30.75 m3/s to 2.02 m3/s (Table 1), with a designed flow rate of 0.5 390
m3/s, residual flow rate of 2 m3/s and minimum flow ratio of 50%. The available flow 391
(0.02m3/s) in September is below the minimum allowable flow of the turbine (0.25m3/s), 392
and therefore the power output is zero at this time.
393
394
Fig. 9 The fuel consumption profile for Lucingweni Mini-grid
395
3.2.5 Impact of Wind speed variation on the technology and economics of mini-grids
396
Sensitivity analysis shows that the variation in wind speed has impacts on the mini-grid
397
systems. The cost of fuel, OC and hours of operation decrease as the wind speed
398
increases (Fig. 10). This is an indication that more energy is produced from the wind
399
turbine, reducing the need to generate energy with the diesel generator. The increase in
400
wind speed reduces the OC. BED and the LCOE. The simulation shows that when the
wind speed is below 3 m/s, PV energy is needed in the Thlatlaganya mini-grid to meet the
402
energy needs. When the wind speed increases to 4 m/s the system can operate without
403
the need for PV in the energy mix. An increase in the wind speed to 4 m/s reduces the
404
BED by about 17%, with a corresponding decrease of 11% in the diesel generator
405
operating hours.
406
The same applies for the mini-grid in Lucingweni. When the average wind speed is below
407
4 m/s, it is not economically feasible to include the wind energy generator. When the
408
average wind speed is above 4 m/s the BED is reduced by 39%. With the inclusion of the
409
wind power source the operating hours of the 50 kW diesel generator (GEN50) are
410
reduced by about 30%.
411 412
413
Fig. 10. Impact of wind speed variation on the generator operation and the breakeven grid
414 extension distance 415 416 0 10 20 30 40 50 60 70 80 0 1000 2000 3000 4000 5000 6000 7000 1 2 3 4 5 6 7 8 9 10 BE D (k m) OH (h) Wind Speed (m/s) Gen50-(OH)-Thlatlaganya (h) Gen50-(OH)-Lucingweni (h) BED-Thlatlaganya (km) BED-Lucingweni (km)
3.2.6 The impact of Variation of feedstock price on the economics of mini-grids
417
Increases in the diesel price increase the OH and BED for the Thlatlaganya mini-grid as
418
indicated in the price sensitivity analysis (Fig. 11). The Lucingweni project is less affected 419
by increasing diesel price as most of the load is met by hydro power, reducing reliance on
420
the diesel generator. This results in fewer operating hours and reduced operation costs of
421
the Lucingweni mini-grid, which has a significant effect on the BED. An increase in diesel
422
price increases BED for both Thlatlaganya and Lucingweni mini-grids.
423
424
Fig 11: Sensitivity of diesel price variation on the breakeven distance and operation hours
425 426
4 Discussion
427
Solar radiation, wind speed and hydro resources are the most significant natural resources
428
that influence the technology choices for the optimized mini-grid systems in both
429
Thlatlaganya and Lucingweni. The reduction in solar radiation from April to September
430 0 20 40 60 80 100 120 0 1000 2000 3000 4000 5000 6000 0,3 0,6 0,9 1,2 1,5 Diesel Price ($) BE D (km) OH (h ) GEN-50-OH-Thlatlaganya GEN-50-OH-Thlatlaganya BED-Thlatlaganya BED-Lucingweni
(i.e. in winter) results in an increased need for diesel and wind energy to meet the energy
431
needs in Thlatlaganya. Similarly in Lucingweni, the reduced flow rate of the Mbashe River
432
during the same period culminating in September results in the highest use of the diesel
433
generator to meet the energy demand. This is in agreement with a previous study that
434
concluded that a hydroelectricity system would require an additional source of electricity
435
to meet the energy demand due to the reduced flow in the Mbashe River during the winter
436
period [36]. Another study proposed that a combination of a hydrokinetic system and pump
437
storage could complement the shortfall in electricity supply during seasonal variations of
438
this nature [37].
439
The difference between the capacity of SHS and mini-grid systems is exemplified by their
440
load profiles as illustrated in Fig. 2. The load profile of the SHS shows that the power
441
capacity of the system is limited which explains the lack of productive activities during day.
442
The actual situation may be more critical as the simulation stretches the capacity of the
443
SHS to its limit to accommodate the load due to the behavioural pattern of the households,
444
and this can only be met by overloading the system to provide 0.543 kWh/day/household
445
[14]. This is evident from the noticeable stress on the SHS battery (Fig. 6). The SOC
446
resulting from this usage pattern is 50%, reflecting the low power quality of the system.
447
The optimization of the 75 WP SHS used for the South African program shows that the 448
system can only work optimally at 0.302 kWh/day/household [14]. Operating the system
449
under optimized conditions increases the SOC to about 84%. However, this reduces the
450
usage time as the system can only maintain an uninterrupted electricity supply under the
451
optimal condition for about 3 hours [14].
On the other hand, the two mini-grids show that sufficient electricity can be produced to
453
meet the load at a reduced price, indicating that the objective of supporting domestic and
454
productive economic activities such as agriculture, commercial, and public utilities like
455
schools and clinics, carpentry and metal works could be met with the electricity from the
456
optimized mini-grids at the two sites. The 732 kWh required to meet the designed load
457
excludes the technical losses resulting from battery storage, DC to AC conversion at the
458
converter and electricity transmission and non-technical losses due to electricity pilferage
459
as previously reported [17]. 24 hour availability of electricity will enable rural households
460
to improve their income generation and payment for services. Improved income is likely
461
to result in an increased demand for electricity, which is beneficial both for the energy
462
providers and the households. This finding is in agreement with the argument that states
463
that mini-grids have sufficient capacity to power small businesses which can spur the
464
development of local economic activities and enable communities to improve their living
465
conditions [38].
466
The investigation reveals that the inclusion of hydro power in the energy mix of the
467
Lucingweni mini-grid gives it an advantage over the Thlatlaganya mini-grid in terms of
468
high electricity production at reduced cost, even though Thlatlaganya has relatively high
469
solar irradiation, low wind speed and no availability of nearby inland waterways suitable
470
for hydro power generation. Hydro power is the most cost competitive electricity
471
generation option currently available [39]. The mini-grid in Lucingweni does not favour the
472
inclusion of PV as was done in the actual pilot mini-grid project. Although the average
473
solar irradiation is high enough to favour the use of solar energy, the ambient temperature
474
is also relatively high, and this has a negative effect on the energy production [40]. The
addition of hydro power to the energy mix of the Lucingweni mini-grid results in excess
476
electricity production due to the high flow rate in the upper Mbashe River (Table 1).
477
Information from the HOMER™ simulation indicates that the system, records excess 478
electricity in any time step in which electrical production exceeds the load and the excess
479
cannot be fully absorbed by the deferrable load or stored by the battery bank. Excess
480
electricity can be used by boilers (the designed mini-grid did not include boilers) or stored
481
by batteries. HOMER™ ranks systems based on NPC, and it has no qualms about excess
482
electricity. HOMER™ recognizes that there is no value to excess electricity, but it also
483
recognizes the cost of avoiding it. HOMER™ was created to analyze this kind of tradeoff.
484
Thus, even with a well-designed search space, HOMER™ sometimes chooses systems
485
that produce excess electricity, and considers this an acceptable result.
486
The optimization of the two mini-grids shows a significant renewable energy contribution
487
in the energy mix at Lucingweni, while in the case of Thlatlaganya the mini-grid relies to a
488
large extent on diesel generators to meet the load, increasing the costs of electricity
489
production.
490
The economic analysis shows that the mini-grid at Lucingweni will cost about three times
491
as much as the implementation of the SHS, assuming that all the 300 households are
492
provided with SHS at the rate of around ZAR 4,000 per installation [34]. The ICC will
493
amount to $ 120,000.00 for all households using SHS in the village and the energy
494
production from the mini-grid is more than five times higher than the total energy produced
495
by the 300 SHS. This additional energy is required to drive economic and productive
496
activities in the rural settlements.
The economic analysis also shows that despite the similarity in the initial capital
498
expenditures (CAPEX) between the two mini-grids, there is a significant difference in their
499
operational expenditures (OPEX) due to the fact that maintenance and operating costs
500
are higher for the Thlatlaganya mini-grid compared to the Lucingweni mini-grid.
501
Sensitivity analysis of the mini-grids shows that a high diesel price contributes to high cost
502
of OC, LCOE and NPC. It also shows that wind speed influences the choice of technology
503
and variation in the price of diesel affects the economics and operational hours of the
504
diesel generator. The investigation reveals that hydro power has high potential in
505
implementation of mini-grids for rural electrification in remote areas, since it has the lowest
506
cost, the lowest grid extension breakeven distance and provides excess electricity in
507
relation to the energy needs. This result agrees with an earlier study that concluded that
508
hydro powered village grids is the solution with the lowest generation costs and negative
509
abatement costs [41].
510
The techno-economic analysis of the SHS and the mini-grid systems at the two sites
511
shows that mini-grid electricity is able to meet energy needs and allow for an energy based
512
economic development of the rural settlements. However, the economic viability of the
513
mini-grid may be affected by its distance from the national grid. An earlier study concluded
514
that long distance to the grid and environmental considerations make mini-grids a more
515
acceptable option for remote rural settlements [42]. Given the multi-faceted challenges of
516
rural settlements in developing countries, such as mountainous topographies, low energy
517
demand, dispersed homesteads, the relatively low income of households, not all rural
518
settlements are likely to be suitable for the establishment of mini-grid systems.
519
Nevertheless, increasing concern regarding climate change and the rising cost of grid
expansion encourages the need for the establishment of alternative energy systems like
521
hybrid mini-grids based on renewable energy sources. According to [43], grid extension
522
should be the final phase of a sequential rural electrification process.
523
5 Conclusion
524
The evaluation of technical and economic viability of the optimized hybrid mini-grids at
525
two sites in South Africa show that a mini-grid is a better option than SHS for meeting the
526
energy needs of rural communities in line with the development objective of the South
527
African FBE policy. Key findings of the study are:
528
The optimized mini-grid systems are able to produce enough electricity to allow for
529
development activities like agriculture, businesses and public services in rural
530
communities if the power is used appropriately.
531
The study shows that with proper planning and the right energy mix, the levelized
532
cost of electricity for the Lucingweni pilot mini-grid project could have been
533
reduced.
534
Locations in close proximity to inland waterways suitable for hydro power provide
535
the most competitive and optimal conditions for mini-grids to meet the energy
536
needs of rural settlements.
537
There is no generic technology choice for mini-grid systems, locally available
538
resources, and prices of feedstock and components determine the optimal
539
technology and energy mix for each location.
540
5.1 Recommendations
From a techno-economic perspective the mini-grid is a viable alternative to the SHS in
542
locations with access to suitable energy resources. However, sustainability of these
543
initiatives requires cost recovery and sufficient financial and human resources to ensure
544
continuous operation and maintenance of the systems, a research gap that is not
545
addressed in this study.
546
To achieve its development objective the South African government needs to be
547
pragmatic in the implementation of renewable energy policies. There is a need for the
548
government to revise the current policy on the rural electrification program based on SHS
549
to also include mini-grid solutions in areas with access to adequate resources.
550
Research is required on how to manage the OPEX phase of projects after commissioning,
551
since this was the key failure point in the Lucingweni pilot mini-grid and a weak link in the
552
sustainability of the Thlatlaganya SHS project.
553 554
Acknowledgements
555
Our profound appreciation goes to University of Free State in Bloemfontein, South Africa
556
for providing a conducive environment for the conduct of this study. We acknowledge the
557
support given by the Swedish Research Council Formas for funding our trip to South
558
Africa. Many thanks to the department of Science and Technology (DST) and the National
559
Research Foundation (NRF) of South Africa for funding the International Institute of
560
Applied Systems Analysis (IIASA), and the South African-Young Scientist Summer
561
Program (IIASA, SA-YSSP 2014/15). Most of all we thank IIASA for organizing the
562
program.
References
564
[1] IEA: Energy poverty How to make modern energy access universal: Special early
565
excerpt of the world Energy Outlook 2010 for UN General Assembly on the
566
Millennium Development Goals, September 2010.
567
[2] IEA. Energy for All: Financing access for the poor (Special early excerpt of the World
568
Energy Outlook 2011). World Energy Outlook 2011 report.
569
[3] Abeeku Brew-Hammond. Energy access in Africa. Challenges ahead. Energy
570
Policy 2010;38:2291-2301.
571
[4] Simon R, Guido G. Hybrid Mini-grids for rural electrifications : Lessons learned.
572
Alliance for rural electrification. March 2011 report.
573
[5] DOE: New and Renewable Energy. Mini-Grig viability and replication potential: The
574
Hluleka and Lucingweni pilot projects. Final report 2008.
575
[6] IEA: World Energy Outlook: Energy for all: Financing access for the poor, special
576
early excerpt of the world energy outlook 2011.
577
(7) Wamukonya N. Solar home system electrification as a viable technology option for
578
Africa’s development. Energy Policy 2007;35:6–14.
579
[8] Rahman SM, Ahmad MM. Solar Home System (SHS) in rural Bangladesh:
580
Ornamentation or fact of development? Energy Policy 2013;63:348–54.
581
[9] Schillebeeckx SJD, Parikh P, Bansal R, George G. An integrated framework for
582
rural electrification: Adopting a user-centric approach to business model
583
development. Energy Policy 2012;48:687–97.
584
[10] Banks D, Clark A, Steel K, Purcell C. Integrated Rural Energy Utilities A review of
585
literature and opportunities for the Establishment of an IREU 2008.
586
[11] Lemaire X. Off-grid electrification with solar home systems: The experience of a
fee-587
for-service concession in South Africa. Energy Sustain Dev 2011;15:277–83.
588
[12] Department of Mineral and Energy: Electricity Basic Services Support Tariff (Free
589
Basic Electricity) Policy for the Republic of South Africa. Government Gazette,
590
General Notice, Notice 1693 of 4 July, 2003.
591
[13] Department of energy: Presentation on the integrated national electrification
592
program (INEP), 18 June 2013.
[14] Azimoh CL, Wallin F, Klintenberg P, Karlsson B. An assessment of unforeseen
594
losses resulting from inappropriate use of solar home systems in South Africa. Appl
595
Energy 2014;136:336–46.
596
[15] Gaona E.E, Trujillo CL, Guacaneme JA. Rural micro grids and its potential
597
application in Colombia. Renew Sust Energy Rev 2015;51:125–137.
598
[16] Luijten CCM, Kerkhof E. Jatropha oil and biogas in a dual fuel CI engine for rural
599
electrification. Energy Convers Manage 2011; 52:1426–1438.
600
[17] Brent AC, Rogers DE. Renewable rural electrification: Sustainability assessment of
601
mini-hybrid off-grid technological systems in the African Context. Renew Energy
602
2010; 35:257-265.
603
[18] ScottishPower. Community Electricity in Rural South Africa : Renewable Mini-grid
604
assessment. Report 2003.
605
[19] Nfan EM, Ngundam JM, Vandanbergh M and Schmid J. Simulation of off-grid
606
generation options for remote villages in Cameroon. Renewable Energy 33 (2008)
607
1064-1072.
608
[20] Rehman S and Al-Hadhrami LM. Study of a solar PV-Diesel-Battery hybrid power
609
system for a remotely located population near Rafha, Saudi Arabia. Energy 35
610
(2010) 4986-4995.
611
[21] Zhou W, Lou C, Zhoungshi Li Lin Lu, Yang H. Current status of research on optimum
612
sizing of standalone hybrid solar-wind power generation systems. Applied Energy
613
87 (2010) 380-389.
614
[22] Chaurey A, Kandpal TC. A Techno-economic comparison of rural electrification
615
based on SHS and PV micro grids. Energy Policy 38 (2010) 3118-3129.
616
[23] Hansen CJ and Bower J. An economic evaluation of small-scale distributed
617
electricity generation technologies. Oxford institute for energy studies. ISBN: 1901
618
795 306 john.bower@oxfordenergy.org.
619
[24] Ashok S. Optimised model for community-based hybrid energy system. Renew
620
Energy 2007;32:1155–64.
621
[25] Department of water and sanitation. Water is life, sanitation is dignity:
622
https://www.dwa.gov.za/hydrology/HyData.aspx?Station=T1H013100.00&DataTyp
623
e=Monthly&StartDT=2005-07-27&EndDT=2015-03-624
16&SiteType=RIV&Format=New, upper river Mbashe flow rate 2014.
625
[26] Motiang M and Nembahe R. South African energy price report: Directorate: Energy
626
Data collection, management and analysis. Department of energy 2013.
[27] Diechmann U, Meisner C, Murray S, Wheeler D. The economics of renewable
628
energy expansion in rural sub-Saharan Africa. Energy Policy 2011;39:215-27.
629
[28] Inversin AR, Arlington VA. Reducing cost of grid extension for rural electrification.
630
Joint World Bank Energy Sector Management Assisstnace Program (ESMAP)
631
2000.
632
[29] Michael T. Renewable Energy Technologies: Cost Analysis Series. Hydro Power.
633
Volume 1: Power Sector, issue 3/5. Internation Renewable Energy Agecy (IRENA),
634
June 2012.
635
[30] Michael T. Renewable Energy Technologies: Cost Analysis Series. Wind Power.
636
Volume 1: Power Sector, issue 5/5. Internation Renewable Energy Agecy (IRENA),
637
June 2012.
638
(31] Michael T. Renewable Energy Technologies: Cost Analysis Series. Solar
639
Photovoltaics. Volume 1: Power Sector, issue 4/5. Internation Renewable Energy
640
Agecy (IRENA), June 2012.
641
[32] Kempton W, Kubo T. Electric-drive vehicles for peak power in Japan. Energy Policy
642
2000;28:9-18.
643
[33] Lau KY, Yousof MFM, Arshad SNM. Performance analysis of hybrid
644
photovoltaic/diesel energy system under Malysian conditions. Energy
645
2010;35:3245-55,.
646
[34] 27Four Investment Managers (pty) ltd. Monthly Market Review.
647
http://www.27four.com/wp-content/uploads/2015/01/27four-Investment-Managers-648
4word-December-2014.pdf. December 2014.
649
[35] Abel Sindano. Southern Africa Customs Union Inflation Report, October 2014.
650
[36] Stephenson D, Taylor RW. Operation of a multi-basin hydro system. Proceedings
651
of Vienna symposium on hydrology for water management of large river basin,
652
1991; 201:371-8.
653
[37] Kanzumba Kusakana. Feasibility analysis of river off-grid hydrokinetic systems with
654
pumped hydro storage in rural applications. Energy Convers Manage 2015; 96:352–
655
362.
656
[38] Alliance for rural electrification: Green light for renewable energy in developing
657 countries 658 http://www.ruralelec.org/fileadmin/DATA/Documents/06_Publications/Position_pap 659 ers/ARE_Publication_-660 _Green_light_for_renewables_in_Developing_countries.pdf. 661
[39] IRENA: Summary for policy makers: Renewable power generation costs, November
662
2012.
663
[40] Duffie JA, Beckman WA. Solar Engineering of Thermal Processes: 4th ed. Willey; 664
2013.
665
[41] Nicola U. Blum, Ratri Sryantoro Wakeling, Tobias S. Schmidt. Rural electrification
666
through village grids assessing the cost competitiveness of isolated renewable
667
energy technologies in Indonesia. Renew and Sustainable Energy Reviews 22
668
(2013) 482–96.
669
[42] Ismail MS, Moghavvemi M, Mahlia TMI. Design of an optimized photovoltaic and
670
microturbine hybrid power system for a remote small community: Case study of
671
Palestine. Energy Convers Manage 2013;75: 271–81.
672
[43] Niez A. Comparative study on rural electrification policies in emerging economies:
673
Keys to successful policies: IEA information paper, March 2010.
674 675