Master of Science Thesis
KTH School of Industrial Engineering and Management Energy Technology EGI-2016-021MSC EKV1133
Division of Heat & Power SE-100 44 STOCKHOLM
Solar - Biomass hybrid system
for process heat supply in
medium scale hotels in Sri Lanka
i
Master of Science Thesis EGI-2016-021MSC EKV1133
Solar-Biomass hybrid system for process heat supply in medium scale hotels in Sri Lanka
Asela Janaka Abeywardana
Approved 2016-06-23 Examiner Miroslav Petrov - KTH/ITM/EGI Supervisors KTH – Miroslav Petrov OUSL – Dr. N.S. Senanayake Eng. Ruchira Abeyweera Eng. Asela Buddika Pathirathne
Commissioner Contact person
Abstract
This study aimed at evaluating and demonstrating the feasibility of using Concentrated Solar Thermal technology combined with biomass energy technology as a hybrid renewable energy system to supply the process heat requirements in small scale industries in Sri Lanka. Particularly, the focus was to apply the concept to the expanding hotel industry, for covering the thermal energy demand of a medium scale hotel. Solar modules utilize the rooftop area of the building to a valuable application. Linear Fresnel type of solar concentrator is selected considering the requirement of the application and the simplicity of fabrication and installation compared to other technologies. Subsequently, a wood-fired boiler is deployed as the steam generator as well as the balancing power source to recover the effects due to the seasonal variations in solar energy. Bioenergy, so far being the largest primary energy supply in the country, has a good potential for further growth in industrial applications like small hotels.
When a hotel with about 200-guests capacity and annual average occupancy of 65% is considered, the total annual CO2 saving is accounted as 207 tons compared with an entirely fossil fuel (diesel) fired boiler system. The annual operational cost saving is around $ 40,000 and the simple payback period is within 3-4 years. The proposed hybrid system can generate additional 26 employment opportunities in the proximity of the site location area.
This solar-biomass hybrid concept mitigates the weaknesses associated with these renewable technologies when employed separately. The system has been designed in such a way that the total heat demand of hot water and process steam supply is managed by renewable energy alone. It is thus a self-sustainable, non-conventional, renewable energy system. This concept can be stretched to other critical medium temperature applications like for example absorption refrigeration. The system is applicable to many other industries in the country where space requirement is available, solar irradiance is rich and a solid biomass supply is assured.
ii
Contents
1 INTRODUCTION ... 1
1.1 Background ... 1
1.1.1 Tourist Industry in Sri Lanka ... 1
1.1.2 Power consumption of the hotel industry ... 2
1.2 Objective ... 5
1.3 Methodology ... 5
2 LITERATURE SURVEY ... 6
2.1 SOLAR ENERGY ... 6
2.1.1 Solar Radiation ... 6
2.1.2 Solar Energy Technology... 8
2.1.3 Solar Energy Potential in Sri Lanka ...15
2.2 BIOENERGY ...19
2.2.1 Biomass Technology ...19
2.2.2 Bioenergy and biomass potential in Sri Lanka ...22
3 SYSTEM PROPOSAL ...24
3.1 Overview of the hotel unit ...24
3.2 Site survey and selections for CSP application ...25
3.3 Site survey and selections for biomass application ...26
3.4 Requirements and conditions of proposed hotel unit ...28
3.4.1 Hot water requirement ...28
3.4.2 Steam requirement ...29
3.5 Model Design of proposed system...29
3.5.1 Schematic diagram ...30
3.5.2 Operating technique and design considerations ...31
4 CALCULATION AND ANALYSIS ...32
4.1 DETAILED CALCULATION ...32
4.1.1 Maximum daily energy requirement ...32
4.1.2 Designing the solar system ...33
4.1.3 Case analysis ...34
4.1.4 Annual energy analysis ...38
4.1.5 Designing the biomass boiler ...39
4.2 MODELING AND OPTIMIZING THE SYSTEM ...41
4.2.1 Initial cost ...41
4.2.2 Operational cost ...42
4.2.3 Optimizing the system ...43
iii 4.3.1 Technical evaluation ...46 4.3.2 Financial evaluation ...47 4.3.3 Environmental evaluation ...51 4.3.4 Social evaluation ...51 5 DISCUSSION ...53 6 CONCLUSION ...54 REFERENCES ...55 APPENDIX 1 ...57
iv
List of Figures
Figure 1: Sri Lanka Tourists Targets (2010 – 2016) ... 2
Figure 2: Variation of CEB electricity sales to the hotel industry ... 3
Figure 3: Typical Electrical Energy Balance of a hotel in Sri Lanka ... 3
Figure 4: Atmospheric effects on the solar radiation ... 6
Figure 5: Fresnel Collector Solar Field ... 9
Figure 6: Geometrical view of Linear Fresnel Collector ...10
Figure 7: Geometry of a simple secondary receiver ...11
Figure 8: Mirror tilt angle and its determinants ...11
Figure 9: (a) LFC optical losses due to primary mirror field geometry (cosine, shading, blocking, optical errors), receiver shading and acceptance of secondary geometry, and material properties (transmission, reflectance and absorptance); (b) Example for reduction of optical efficiency by angle dependent losses (mainly blocking as well as shading and optical errors) for a solar position with large influence, for =30° and θz =0°/30°/60°. ...13
Figure 10: Incidence angle modifier in transversal and longitudinal direction in 10 steps. ...13
Figure 11: (a) Order of magnitude of end loss (orange) for different collector lengths lc in m; (b) Increase of end loss factor in dependence of lc for γs=30°, θz=30°/45°/60°. ...14
Figure 12: Annual surface effectiveness for different tracking systems ...14
Figure 13: Annual Global Horizontal Irradiation (GHI) in Sri Lanka...16
Figure 14: Annual Direct Normal Irradiation (DNI) in Sri Lanka ...17
Figure 15: Share of Primary Energy Supply by source in Sri Lanka ...23
Figure 16: Site location ...25
Figure 17: Land distribution on main plantations ...26
Figure 18: Gliricidia as a fuel ...27
Figure 19: Natural Moisture reduction of different samples of Gliricidia ...28
Figure 20: Schematic diagram of the system model ...30
Figure 21: Total cost (initial + operational) variation with time for different solar fraction (SF) values ...45
Figure 22: Variation of annual biomass (fuel) demand with solar fraction ...45
Figure 23: Variation of overall efficiency of the hybrid system with solar fraction ...47
v
List of Tables
Table 1: Energy consumption data for a set of leading 5-star hotels in Sri Lanka ... 4
Table 2: Comparison of electrical energy and the thermal energy consumption ... 4
Table 3: Characteristics of Fresnel solar field ...15
Table 4: Seasonal variations of GHI in the measuring stations located in coastal area ...18
Table 5: Types of Biomass according to the source of supply ...19
Table 6: Characteristics of biomass fuels found in Sri Lanka ...20
Table 7: Primary Energy Supply by source in Sri Lanka ...23
Table 8: Basic features of selected hotel unit for design considerations ...24
Table 9: Data related to the solar installation ...25
Table 10: Selections for the biomass application ...27
Table 11: Design guidelines to the hot water system ...28
Table 12: Hot water system design data ...28
Table 13: Characteristics of steam requirement data (data survey) ...29
Table 14: Steam system design data ...29
Table 15: Summary of features of boiler operation ...40
Table 16: Estimated initial cost of solar-biomass hybrid system with solar fraction of 10% ...42
Table 17: Estimated annual operational cost of solar-biomass hybrid system with solar fraction of 10% ...43
Table 18: Main features of the system for various solar fractions ...44
Table 19: Estimated initial cost for the system with Diesel boiler ...47
Table 20: Estimated annual operational cost for a system with diesel boiler ...48
Table 21: Total cost variation with time for hybrid system and for diesel boiler system ...49
vi
Nomenclature
AM Collector area of solar modules (m2)
CIND Initial cost of diesel boiler system ($)
CISB Initial cost of solar-biomass hybrid system ($)
COMD Total operational cost of diesel boiler system ($)
COMSB Total operational cost of solar-biomass hybrid system ($)
DNID Daily Direct Normal Irradiation (kWh/m2/day)
EB Energy supply by biomass boiler (J)
ECL Energy recovered in condensate after laundry (J)
ECW Energy content of cold water supply (J)
EHW Energy requirement to hot water supply (J)
ELS Energy required to laundry steam supply (J)
ES Energy supply by solar system (J)
ET Total energy requirement (J)
ISC Solar Constant (W/m2)
MECL Maximum energy recovered in condensate in laundry (J)
MEHW Maximum energy requirement to hot water supply (J)
MELS Maximum energy required to laundry steam supply (J) MES Maximum total energy requirement (J)
mCL Mass of condensate water after laundry (kg)
mCW Mass of cold water supply to feed water tank (kg) mHW Mass of hot water supply (kg)
mLS Mass of laundry steam supply (kg)
mS Mass of steam supply by solar steam generator (kg) RG Occupancy ratio of the hotel (%)
SF Solar Fraction (%)
THW Temperature of hot water supply (0C)
TCS Temperature of cold water supply (0C)
vii
Declination Angle (Degree) Latitude (Degree)
Hour angle (Degree) Zenith angle (Degree) Azimuth angle (Degree) Altitude angle (Degree)
Efficiency of boiler (%)
Overall efficiency of the Fresnel solar system (%)
viii
Abbreviations
CEB Ceylon Electricity Board CSP Concentrated Solar Power CST Concentrated Solar Thermal CWS Cold Water (makeup water) Supply DNI Direct Normal Irradiation
FV Flash Vessel
GHI Global Horizontal Irradiation HHV Higher Heating Value
LFC Linear Fresnel Concentrator/collector LFR Linear Fresnel Reflector
LHV Lower Heating Value
NRE New/Non-Conventional Renewable Energy NRV Non Return Valve
O & M Operation and Maintenance ROI Return On Investment
SEA Sustainable Energy Authority, Sri Lanka SLTDA Sri Lanka Tourist Development Authority SPP Simple Payback Period
ix
ACKNOWLEDGMENT
First and foremost, I convey my sincere gratitude to the government of Sweden including the policy making officials in the country for offering “Master Science program in Sustainable Energy Engineering” to share the knowledge in “Sustainable Energy Technology” in the direction of developing countries.
Further, I would extend my thanks to the “Royal Institute of Technology (KTH)” and to the “University of Gävle” for steering this master’s degree program to a success. I gratefully acknowledge Prof. Torsten Fransson - the initiator of this program, Ms. Chamindie Senaratne - the program coordinator, Dr. Jeevan Jayasuriya and all lecturers and the supporting staff for their tremendous academic support and guidance throughout this program.
I express my deepest appreciation to the local coordinating organization, The Open University of Sri Lanka, the program coordinator Mr. Ruchira Abeyweera, the program facilitator Dr. N.S. Senanayake and all the supporting staff for their useful comments, remarks and engagement throughout the learning process of this program.
Special mention goes to my enthusiastic supervisor of this thesis project Assist. Prof. Miroslav Petrov for his motivation, patience and sharing his experience to a successful completion. Special thanks to Mr. Suganda Somasundara and Mr. Asela Pathirathne for helping in gathering information and in reviewing the report.
Particularly, my heartfelt gratitude goes to Ms. Tilini Rajapakse for giving fabulous cooperation and encouragement all the way through the study.
Lastly, my sincere thanks go to my family and all my colleagues who supported me throughout the process to make this study successful.
1
1 INTRODUCTION
Promoting renewable energy in a country describes not only the development as a technology but also an expansion of ecological sustainability, competitiveness and security of energy supply. Due to these characteristics the industrialized countries have included renewable energy into their national agenda as a major strategy. This has become an indication for the development status in a nation.
The energy sector in Sri Lanka is experiencing severe strain due to the fluctuations of international oil prices as the country is very highly dependent on oil product based power generation in order to meet the rising energy demand. The rapid industrialization, value addition to raw products, broadening of service sectors such as tourism industry and also the rural electrification programs are key factors to this increase in demand. The Ceylon Electricity Board (CEB) is rapidly being drawn into more and more dependency on fossil fuel power generation, at very high cost.
Despite the above issues, Sri Lanka is blessed with renewable energy resources according to its geo-climatic settings. Some of them like hydro are widely used but still there are other areas like solar, wind and biomass to be explored and developed. “The Ministry of Power and Energy” encourages private sector to develop small non-conventional renewable energy projects as the best solution to overcome the looming energy crisis.
Concentrated Solar Power (CSP) technology is a good renewable energy concept to implement in Sri Lanka, as the country is situated near the equator and receives a sound solar irradiance. But the CSP technology has remained unpopular due to the various reasons. Flat-plate domestic type solar water heaters are popular but the total energy generated by this method is wasted during the low demand situations. Furthermore, the investments in this type of solar heaters are not fully utilized and it would not be feasible to apply these in real industrial applications.
1.1 Background
1.1.1 Tourist Industry in Sri Lanka
Sri Lanka is an island to be found with a unique geographical location in the Indian Ocean. It was known as the “Pearl of the Indian Ocean”, and as referred to by most travel journalists it is called the “Jewel of Asia” or “Paradise on Earth”. There is a great opportunity for promoting tourism within the region mainly due to Authenticity, Diversity and Compactness. The country has over 2,500 years of old traditional culture (authenticity) and offers a variety of climatic regions and different tourist attraction (diversity) within only 65,000 km2 of land area (compactness). The
tourism is currently blessed with peace and stable political situation in the country.
As notified by the Government Development Policy Framework, Sri Lanka is to be emerged as “Wonder of Asia” as it has the potential to be the next Asian economic miracle. The Ministry of Economic Development expects to attract visitors and to gradually increase the tourist arrivals to 2.5 Million by the year 2016 as described in the “Tourism Development Strategy”.
2
The Sri Lanka Tourists Development Authority (SLTDA) was established to accomplish this target by facilitating and implementing the legal and administrative process to provide and to develop unique and quality tourism services and products, and to formulate and implement Tourism Development Guidelines by identifying and developing tourist-specific areas and services. The industry has experienced a moderate growth in 2011-2013 due to the limitations in facilities but expecting faster growth to achieve their target in 2016.
Figure 1: Sri Lanka Tourists Targets (2010 – 2016)
(Ministry of Economic Development, 2011)
1.1.2 Power consumption of the hotel industry
As described in the “Tourism Development Strategy”, the SLTDA wish to transform Sri Lanka to be Asia’s foremost destination. It has been revealed that there is a considerable growth in the tourism industry. The number of hotels registered that facilitate the tourism industry has been rapidly increasing during the last few years. Hence there is a significant growth of power consumption by this industry. Currently, the hotel industry has become such an important sector that it consumes more than 4% of the national electricity supply (Ceylon Chamber of Commerce, 2011).
0 500,000 1,000,000 1,500,000 2,000,000 2,500,000 3,000,000 2010 2011 2012 2013 2014 2015 2016 N o of A rr ivals Year
3
Figure 2: Variation of CEB electricity sales to the hotel industry
(Ceylon Elecricity Board, 2011), (Ceylon Electricity Board, 2012) (Ceylon Elecricity Board, 2013) The main electrical energy consuming sectors in the hotel industry are Air conditioning, Lighting, Kitchen and Laundry. Figure 3 shows a typical electrical energy balance of a hotel in Sri Lanka.
Figure 3: Typical Electrical Energy Balance of a hotel in Sri Lanka
(Ceylon Chamber of Commerce, 2011)
Most of the energy analyses have been done by summarizing the electrical energy consumption as described above. Also, there are certain thermal energy applications like “kitchen ovens” that are operated by electrical supply. The major energy consuming sectors in a hotel appear to be different with the electrical energy consuming areas as discussed in Figure 3. There is a huge thermal energy requirement when the hotel is running an in-house laundry. The hot water requirement is also a high energy consuming area. So the thermal energy requirement is a vital factor to deal with when considering the energy saving potential. Table 1 shows the energy consumption data for a set of leading 5-star hotels in Sri Lanka having an in-house laundry.
135 140 145 150 155 160 165 170 2010 2011 2012 2013 El ectr ici ty Sal es to Ho tel indus tr y / G W h Year 55% 10% 22% 8% 5% Air Conditioning Lighting Kitchen Laundry Others
4
Table 1: Energy consumption data for a set of leading 5-star hotels in Sri Lanka
(Ceylon Chamber of Commerce, 2011)
Hotel #
Average Daily electricity
consumption/ (kWh/day) Average Daily Steam Usage / (kg/day) Pressure/ bar Steam
1 20,553 13,141 7 2 25,504 29,315 6.2 3 8,079 5,154 10 4 9,604 6,648 10.4 5 24,700 23,730 7.5 6 16,560 11,672 7.5 7 16,834 10,713 7 8 10,240 5,747 7.5 9 37,397 23,871 7.3
The electricity consumption is given in “kWh” in the available data listed in Table 1. The thermal energy in the steam demand can also be converted to “kWh” (assume latent heat and the 30% of the condensate energy used) and the relevant comparison can be obtained as shown in Table 2
below. Then it is revealed that the thermal energy requirement satisfied by steam generation in a five-star class hotel in Sri Lanka is around 30% of the total energy requirement. Thus the hot water and steam requirements are vital areas to deal with in case of energy sustainability goals.
Table 2: Comparison of electrical energy and thermal energy consumption, reworked data from Table 1 Hotel
#
Average Daily Electricity consumption/ (kWh/day)
Average Daily thermal energy (Steam) Usage / (kWh/day)
1 20,553 8,263 2 25,504 18,508 3 8,079 3,199 4 9,604 4,119 5 24,700 14,888 6 16,560 7,323 7 16,834 6,736 8 10,240 3,606 9 37,397 14,988 Total 169,471 81,630
Other than the concerns about the global warming, climatic change and the growing global energy crisis, the sustainability applications in the hotel industry has become a considerable issue as well as getting additional benefits with extra tourists attraction through “Greening” standards. Thus the “Greening of Sri Lankan hotels” is continually being implemented with the appropriate energy, water and waste management programs through better environmental practices. The renewable energy can play a major role in achieving sustainability with the help of improved energy management and conservation strategies.
5
1.2 Objective
The objective of the study was to demonstrate the feasibility of utilizing renewable energy sources by minimizing the weaknesses associated with such technologies to meet some of the energy requirement in hotel industry.
Particularly, the study was focused on the following major aspects:
To evaluate the feasibility of using concentrated solar thermal technology in the hotel industry for meeting process heat requirements; and
To model a concentrated solar thermal and biomass-fired boiler hybrid system to meet the steam and hot water requirement of a typical medium scale hotel.
1.3 Methodology
The project starts with a literature survey which is continued throughout the project to get a thorough knowledge and to get updated the available technology on the subject. The technological findings over this literature survey are discussed in initial chapters which is useful in the analysis process in the following chapters;
The energy survey related to the hotel industry was carried out to assess the system requirement correctly and to identify the practical issues. Information gathered through surveys was analyzed in order to provide foundation for model design and for design proceedings in comparison with the available standards and design practices;
Data surveys on the solar potential and on the biomass potential in Sri Lanka were carried out through the information available with the sources and publications of government regulatory bodies, research publications from relevant organizations and with information available from on-going projects;
Designing of a proper hybrid system that meets the requirement of the application unit (hotel) was done based on the information gathered during this study and further possibilities of optimizing the system was considered by varying the solar-biomass combination (i.e., varying the weight of the energy contribution to the application by solar energy and by bioenergy).
A computer program specific to this system was developed in the process of this optimization and the improvements of the system parameters. Repeated calculations by varying the input parameters of this solar-biomass hybrid combination can be done by using this specific program to evaluate the results and limitations for finding better alternatives.
Results of the optimization process were evaluated against the technical and economic considerations to find out the best options. Financial feasibility was investigated with basic indicators in comparison with a fossil fuel system.
Environmental and social benefits of this hybrid renewable application were assessed over the weaknesses associated with the fossil fuel system.
6
2 LITERATURE SURVEY
2.1 SOLAR ENERGY
2.1.1 Solar Radiation
Solar energy that arrives on the Earth as a form of radiation is an energy emitted by greatly exited atoms of the Sun originating in the continuous reaction known as nuclear fusion. The prevailing reaction directly converts the mass into energy by combining two Hydrogen atoms into one Helium atom. The sun fuses 620 metric tons of Hydrogen in each second and releases massive amount of energy at a rate of around 3.85 x 1026 W.
The sun holds these hot gases by its gravitational pull having a diameter of 1.39 x 10⁹ m. The
Earth while spinning on its own axis having a diameter of 1.27 x 10⁷ m is travelling around the
Sun in an elliptic orbit. The mean distance between Sun and Earth is 1.5 x 10¹¹ m. It subtends at
an angle of only 32’ (thirty two minutes) on the Earth’s surface due to this distance (Spelling, 2011). Therefore the Earth receives almost parallel beam radiation from the Sun.
The rate at which this energy is received on a unit area perpendicular to the direction of propagation of the radiation at the mean distance of the Earth from the Sun is called the “Solar Constant” (ISC). The standard value for this constant is agreed as 1,367 W/m2 but it shows ±3%
variation over the complete traverse of the Earth around the Sun.
2.1.1.1 Atmospheric Condition
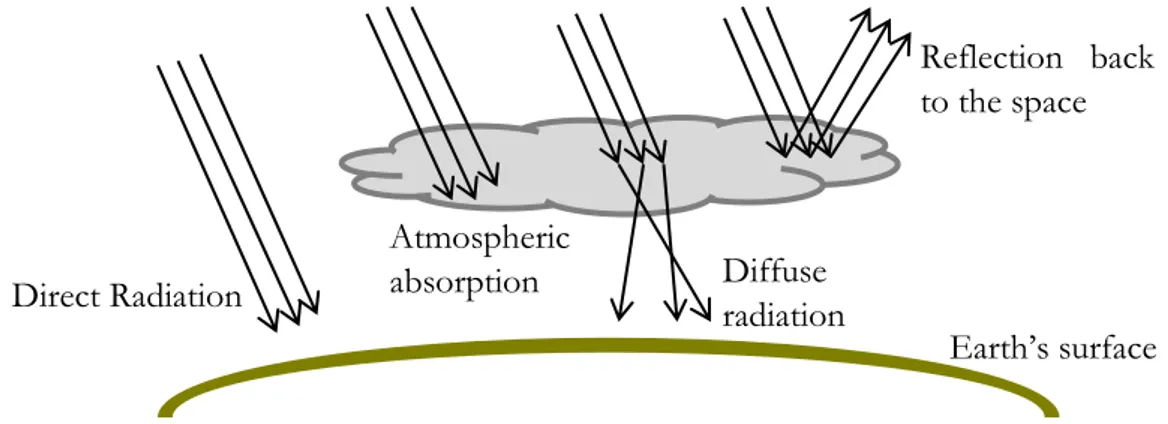
Despite the fact that the solar energy should be reached as per the solar constant ISC, there will be a huge variation to the actual energy received on the earth’s surface as it has to pass through the earth’s atmosphere. This is mainly due to the reflection, absorption and scattering of solar radiation by the particulate and the gaseous elements in the atmosphere. Then there will be a huge loss as a result of this atmospheric absorption and reflection. Even on a clear day around 30% of the energy is absorbed, resulting in a peak flux at the surface of around 1,000 W/m2.
Figure 4: Atmospheric effects on the solar radiation
Direct/Beam Radiation – Solar radiation received at the Earth’s surface without change in the
direction is called beam or direct radiation.
Diffuse radiation – Solar radiation received at the Earth’s surface from all the directions after
being scattered in the atmosphere is called diffuse radiation.
Global/Total radiation – The sum of the beam and diffuse radiation is called total or global
radiation. Earth’s surface Reflection back to the space Atmospheric absorption Diffuse radiation Direct Radiation
7 2.1.1.2 Solar Radiation Geometry
The most prominent variation of solar radiation on a particular location is a result of the inclination of the Earth’s axis of rotation to the Earth’s orbital plane. This natural phenomena measured as an angular distance called “Declination angle ” is varied from -23.50 to +23.50
over a complete orbit around the sun (throughout the year). For example, = +23.50 on 21st
June, = 00 on 21st March and 21st September, = -23.50 on 21st December. The declination
angle can be given by,
(In degrees) = 23.45 sin [ ] (Mukherjee D., 2005)
Where, is the calendar day of the year, (e.g. for June 20 in 2011, = 31+28+30+31+20 = 171).
This inclination is the cause for all the seasonal variations in both hemispheres while the level of this variation is depending on the “latitude ( )” of the location on Earth. Every other factor in effect to the intensity of the solar radiation is determined by the Declination angle and the latitude of the location ( ) together with the atmospheric condition as described in section 2.1.1.1. The length of a the day time in a given location on a given day can be obtained by,
N = ⁄ * (
) + (Spelling, 2011)
Where, N is the day length given in hours
Certain parameters have been introduced to estimate the intensity of incident solar radiation on a given time in a day for a given day of the year for a given location.
Hour angle ( ) is the angle through which the earth has rotated since noon. It is equivalent to
150 per hour and will be varied from -1800 to +1800. TheHour angle is given by, = (Spelling, 2011)
Hour angle is measured from the noon based on the local solar time where, is defined 12.00 as the moment when the Sun is exactly due south at the local position.
Zenith Angle ( is the angle between the Sun’s rays and a line perpendicular to the horizontal plane through the observation point. The Zenith Angle is given by,
= (Spelling, 2011)
Azimuth angle ( is the angle from north to the horizontal projection of Sun’s rays at the observation point.
= | *
+| (Spelling, 2011)
Altitude angle is the vertical angle between the projection of Sun’s rays on the horizontal
plane and the direction of Sun’s rays passing through the observation point.
8 2.1.2 Solar Energy Technology
Solar power has been a primary source of energy to the mankind and there are some examples that the solar technology has been used by humans thousand years ago. This technology could be found in simple applications like “drying crops” and in advance applications like passive solar architecture used in ancient Greece buildings. Today the technology has developed to such an advanced level that it can directly produce electrical energy by using solar energy in devices called “Photovoltaic Cells”.
Passive solar technology refers to the technology that merely collects and uses the thermal
effect of solar energy in buildings. “Passive Solar Building” architecture that optimizes the energy consumption by the design is a great example of this type of technology.
Active Solar technology refers to harnessing solar energy by maximizing the effectiveness,
storing or converting to any other forms of energy and using it with effective methods. Photovoltaic cells and solar thermal technologies are the two main groups of this application.
2.1.2.1 Solar Thermal Power
A solar thermal system is an arrangement that harnesses the solar energy and converts it to a useful form of heat energy. Generally, this process by concentrating the solar radiation produces hot water, steam or hot air which can then be used directly the heat requirements or it can be used to generate electricity by using conventional power cycles. Solar energy is a relatively low density energy that needs to be concentrated to make use of it. Solar thermal collector is the device that collects this energy and transfers it to the device called absorber where the working fluid is in contact to absorb as heat energy.
Depending on the geometry, there are two basic types of solar collectors that can be found as “concentrating” and “non-concentrating”. In the non-concentrating types, there is no optical concentration involved where the collector area is same as the absorber area. Flat plate collector is the best example for this type used commonly in domestic solar water heating and space heating systems. These collectors can heat water or air only up to 800C.
Concentration method where the optical concentration is involved by the geometry of the reflector allows a high density of energy to be absorbed for a given absorber area. Thus higher temperatures can be achieved with this denser concentrated energy. Due to the reduced absorber area, the radiation loss is minimized and relatively higher thermal efficiency can also be attained. Most of the applications like industrial process heat, refrigeration or air conditioning by absorption refrigeration cycle and power generation by steam or gas cycle are in the range of 800C to 2500C whereas the concentrated solar technology can be used.
As the radiation travels through straight lines, it can be explained with a simple graphical clarification that only the parallel radiation can be focused to a point. The diffused part of the radiation is not useful for this purpose and only the beam radiation or the direct radiation is considered.
9
The solar concentrator can be of line focusing type or of point focusing type. Line focusing is a two dimensional concentration method where the maximum theoretical concentration ratio up to 212 can be achieved. Point focusing is a three dimensional concentration method where the maximum theoretical concentration ratio is as high as 45,000. The real practically achievable optical ratios are different from these theoretical values. Line focusing systems can only produce up to 100 concentration ratios and operate at maximum of 4500C. Point focusing can produce
the concentration ratios above 1000 and the temperatures as high as 20000C (Spelling, 2011).
“Parabolic Trough” and “Linear Fresnel” concentrators are common examples for the line focusing systems whereas “Parabolic Dish” and “Heliostat Field” concentrators are popular in point focusing systems. The point focusing, as it is being a three dimensional behavior requires a two-axis tracking device on the collector to maintain the beam focus. Relatively high capital investment is required for point focusing systems which are commonly used in medium to high temperature applications like power generation and material testing. Line focusing requires single-axis tracking on the collector where the capital investment is relatively low. Line focusing systems are used for the medium temperature applications like process heat requirements and also in the power generation.
2.1.2.2 Linear Fresnel Collector (LFC)
Linear Fresnel Collector/Reflector by geometry is a line focusing system which is most appropriate for the medium range temperature applications like process heat. The other line focusing concentrators like Parabolic Line focusing system or “Trough” system can satisfy these requirements better. However, this particular project promotes the Fresnel type of solar thermal technology considering the lower capital investment and the simplicity of fabrication and installation if compared to other CSP technologies. The Fresnel technology uses series of long flat mirrors reflecting the beam radiation to the line of fixed receiver. Every single mirror line is equipped with individual tracking drivers and rotates along its own axis. For a given instance they should be at different angles to point the receiver. All these rotating axes are parallel with each other while the line of focus where the receiver is placed is also parallel with these rotating axes.
Figure 5: Fresnel Collector Solar Field (CSP16)
10
For the medium temperature range applications, the “trough” type collectors are also suitable especially in view of their greater optical efficiency. But there are some advantages with the Linear Fresnel Collector over the trough type collector, as follows:
Linear Fresnel Collector uses flat mirrors which are commonly available.
Supporting structure is lighter than trough type making it more suitable for some rooftop installations.
Individual tracking drivers for each mirror reflector line make the driving system lighter and simpler.
Higher land use efficiency than any other CSP technology.
Higher collector area per absorber can be achieved. Cost is reduced as the absorber is a costly component if compared to the others.
Suitable for direct steam generation due to the fixed receiver. Cheaper and simpler technology, easier fabrication and installation.
This moderate technology should be more suitable for implementation in countries where more advanced technologies are not available or require higher investments or more demanding operation and maintenance procedures.
Figure 6: Geometrical view of Linear Fresnel Collector (htt16)
11 2.1.2.2.1 Secondary receiver
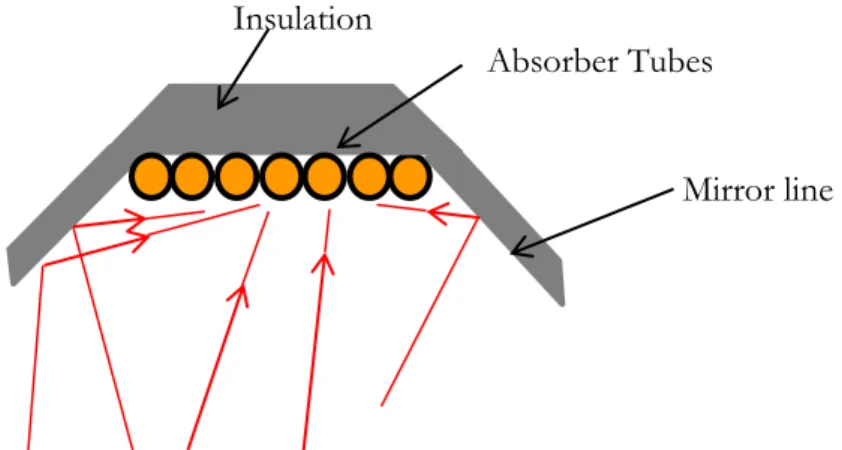
The receiver in the LFC is different than in the trough type collectors. Due to the parabolic geometry, a sharp focal point or line can be achieved in the trough type CSP technology but in the LFC the shape of the collector is basically a flat profile that results from narrowed parallel radiation directed towards the receiver. In order to minimize this optical inaccuracy and to catch this parallel radiation, a secondary concentrator is introduced. Then the concentration ratio can be increased and larger absorber tubes can be avoided resulting in minimum radiation losses in the absorber. Secondary concentrator can again be a parabolic shape but the simple type concentrator as shown in Figure 7 is also available with the advantages of cheap and easy fabrication. This secondary concentrator further acts as a thermal insulator to the absorber. Then the much simple and cheaper absorber tubes without vacuum insulation can be used in LFC systems. Being this simple gives an additional advantage of this technology to be feasible for the small and medium scale applications.
Figure 7: Geometry of a simple secondary receiver 2.1.2.2.2 Tracking System
Linear Fresnel technology is a line focusing system and it uses a single axis tracking device.
Figure 8: Mirror tilt angle and its determinants (Gunther, 2012)
Mirror line Insulation
12
For a given incidence angle each mirror line has different angles to track the sun radiation as illustrated by Figure 8. This modified tilt angle can be given as ,
Where, is the transversal solar altitude angle, is determined by
Where, the height of the absorber over the mirrors plane (h) and the distance to the respective mirror row from the projected axis of the absorber to the mirror plane ( ).
Then, the tracking tilt angle can be obtained,
The deviation of this angle with respect to time or the variation with respect to can be obtained as, (Gunther, 2012)
An important characteristic for this tracking angle is obtained where this angle variation is only dependent on the Sun’s movement ( ) and it is independent of mirror position (h and ). For a given instance, even though the tracking angles are different, they follow the same angular variation with the Sun’s apparent movement. This reveals that the individual tracking drivers can be controlled by a central tracking system. There is a certain inaccuracy involved with this central drive system but it is economically feasible as less equipment drive gears are deployed.
2.1.2.2.3 Efficiency
The power output ̇ for a specific area “A” of the thermal collector of LFC is given as,
̇
= ( ̇ ̇ ) (Heimsath A, 2013)
Where, ̇ is total absorbed power and ̇ is thermal power loss. The total absorbed power ̇ can be expressed as,
(Heimsath A, 2013)
Where is the optical efficiency, is the incidence angle modifier, is the end loss factor, Anet is net collector aperture area and Gb is beam radiation.
13
As described in (Heimsath A, 2013), certain results have been obtained for an experiment done for LFC field with North-South orientation:
“Material properties and geometrical optical errors (blocking and shading at the primary mirror field or acceptance
of the secondary reflector) are varied to show a possible range for optical collector efficiency. On the upper boundary values representative for high temperature selective absorber with absorption 95.5%, transmittance 95.5% and highly reflective solar glass mirrors with reflectance 95% are assumed. The lower boundary values are represented by a medium temperature absorber with 92%, glass without anti-reflective coating, 92%, and low reflective mirrors, 85%” (Heimsath A, 2013).
Figure 9: (a) LFC optical losses due to primary mirror field geometry (cosine, shading, blocking, optical errors),
receiver shading and acceptance of secondary geometry, and material properties (transmission, reflectance and absorptance); (b) Example for reduction of optical efficiency by angle dependent losses (mainly blocking as well as shading and optical errors) for a solar position with large influence, for =30° and θz =0°/30°/60°.
(Heimsath A, 2013)
Figure 10: Incidence angle modifier in transversal and longitudinal direction in 10 steps.
14
“For real collector installations the length of the collector rows is limited due to site requirements. The influence of end loss is increasing with shorter collector lengths and larger zenith angles”. (Heimsath A, 2013)
Figure 11:(a) Order of magnitude of end loss (orange) for different collector lengths lc in m; (b) Increase of end loss factor in dependence of lc for γs=30°, θz=30°/45°/60°.
(Heimsath A, 2013)
As presented in the result of Figure 9, Figure 10 and Figure 11, the overall efficiency can be estimated between 45% to 50% by assuming the other parameters like maintenance practices (e.g.; cleaning of solar panels) are maintained at optimum level.
With the North-South orientation, a higher annual surface effectiveness of around 95% can be obtained for a country like Sri Lanka (Latitude between 50 – 100) as shown in Figure 12.
Figure 12: Annual surface effectiveness for different tracking systems
15 2.1.2.2.4 Field Optimization
When designing a LFC system, there are some certain primary parameters to be considered like the width and the length of the complete collector, width of individual mirror strips, gap between mirrors and height of the absorber above the mirror plane. The following table describes the behavior and the optimization of these parameters. However, this project scope does not include the optimization designs of the solar field.
Table 3: Characteristics of Fresnel solar field
Component Characteristics/Optimization
Width of the collector field When considering a narrow field, the aperture area per one absorber is less. Then less energy is absorbed by the absorber. Much broader fields make more magnified losses due to the tracking inaccuracy and geometrical errors as the corner mirrors are some distance away from the absorber.
Length of the collector field Longer fields need heavy support structure and heavy tracking drive mechanism. Shorter fields provide less energy per absorber area.
Width of mirror strips Large number of mirror lines required when the mirror strips are too narrow. Broader mirror strips require broader absorber area and the astigmatism is stronger and the overall effectiveness is reduced.
Gap between mirror strips Large gaps increase the field area and cannot utilize the available space. Small gaps increase the shading and blocking effects reducing the efficiency.
Distance to the absorber from the mirror plane
When the absorber is too close to the mirror plane the effects due to shading, blocking and low incidence angle will be large. When the absorber is too higher over the mirror plane, the
concentration effectiveness will be lower due to the errors in tracking system and the errors in mirror geometry.
2.1.3 Solar Energy Potential in Sri Lanka
Solar energy is by far the dominant primary source of energy that represents more than 99% of the renewable energy on planet Earth. Sri Lanka is an island located closer to the equator, lies within latitudes 50 55’N - 90 55’N and longitudes 790 42’E - 810 52’E. The country receives
abundant resource of solar energy and it does not show a notable seasonal variation throughout the year. The main variation throughout the regions of the country is due to cloud cover and humidity. In the mountainous areas the radiation intensity is low whereas the dry zone having high solar intensity can be preferred for harnessing with appropriate technology.
16
Figure 13: Annual Global Horizontal Irradiation (GHI) in Sri Lanka
17
Figure 14: Annual Direct Normal Irradiation (DNI) in Sri Lanka
18
As described in section “2.1.2.1” only the direct or the beam radiation is possible to focus to get concentrated energy and then the potential of DNI should be considered for any solar thermal applications. The Figures 13 and 14 above [Figure 14] show the annual GHI and DNI distribution in Sri Lanka, respectively.
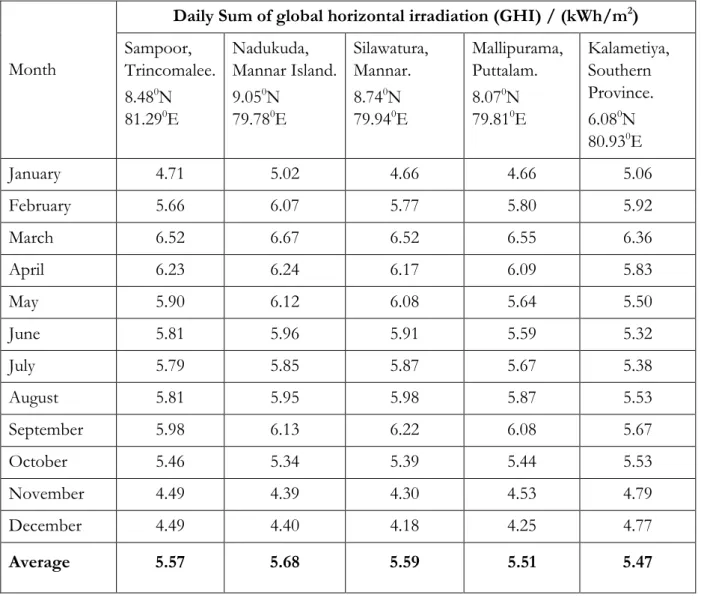
According to the data available in the basic solar resource measuring stations established by SEA, the seasonal variations of the solar energy, which is an important factor for the design considerations, is given in the following table.
Table 4: Seasonal variations of GHI in the measuring stations located in coastal area (Sri Lanka Sustainable Energy Authority, 2014)
Month
Daily Sum of global horizontal irradiation (GHI) / (kWh/m2) Sampoor, Trincomalee. 8.480N 81.290E Nadukuda, Mannar Island. 9.050N 79.780E Silawatura, Mannar. 8.740N 79.940E Mallipurama, Puttalam. 8.070N 79.810E Kalametiya, Southern Province. 6.080N 80.930E January 4.71 5.02 4.66 4.66 5.06 February 5.66 6.07 5.77 5.80 5.92 March 6.52 6.67 6.52 6.55 6.36 April 6.23 6.24 6.17 6.09 5.83 May 5.90 6.12 6.08 5.64 5.50 June 5.81 5.96 5.91 5.59 5.32 July 5.79 5.85 5.87 5.67 5.38 August 5.81 5.95 5.98 5.87 5.53 September 5.98 6.13 6.22 6.08 5.67 October 5.46 5.34 5.39 5.44 5.53 November 4.49 4.39 4.30 4.53 4.79 December 4.49 4.40 4.18 4.25 4.77 Average 5.57 5.68 5.59 5.51 5.47
19
2.2 BIOENERGY
2.2.1 Biomass Technology
Bioenergy can be considered as another useful form of solar energy which is utilized indirectly in growing plants by a process called “photosynthesis”. This mechanism of plant growth takes carbon dioxide (CO2), moisture (H2O) from their surroundings and energy from the sunlight to
convert and store as a form of useful energy or as a fuel. The substances carry this energy in the form of “biomass” and it exists in a thin layer of Earth. This is an enormous resource in terms of human energy need.
Biomass is a mixture of organic molecules that contains mainly carbon, hydrogen and oxygen. It also contains small quantities of nitrogen and heavy metals. Biomass can be taken as a fuel that interacts with the oxygen and releases energy, converting into different chemical compounds. CXHY + (x + y/4) O2 ---> x CO2 + (y/2) H2O + Energy
Biomass takes carbon dioxide from the atmosphere in the process of photosynthesis when it is at the growing stage. So that it can compensate the release of CO2 while it burns. This can result to
that there is no net change to the atmospheric CO2 level when considering the entire lifespan of
the biomass from growing stage to burning stage. Also it brings clear solution by reducing other greenhouse gases like SO2, NO2, etc. Compared with coal, biomass contains less ash and sulphur fractions. Hence, biomass can be undoubtedly taken as a renewable energy that can represent about 2/3 of the total potential of renewable organic fuels in the world.
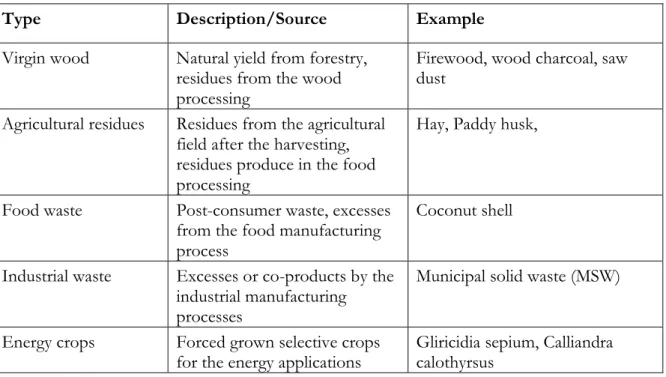
Biomass can be categorized into five basic types depending on their source of supply, as listed in Table 5.
Table 5: Types of Biomass according to the source of supply
Type Description/Source Example
Virgin wood Natural yield from forestry, residues from the wood processing
Firewood, wood charcoal, saw dust
Agricultural residues Residues from the agricultural field after the harvesting, residues produce in the food processing
Hay, Paddy husk,
Food waste Post-consumer waste, excesses from the food manufacturing process
Coconut shell
Industrial waste Excesses or co-products by the industrial manufacturing processes
Municipal solid waste (MSW)
Energy crops Forced grown selective crops
20
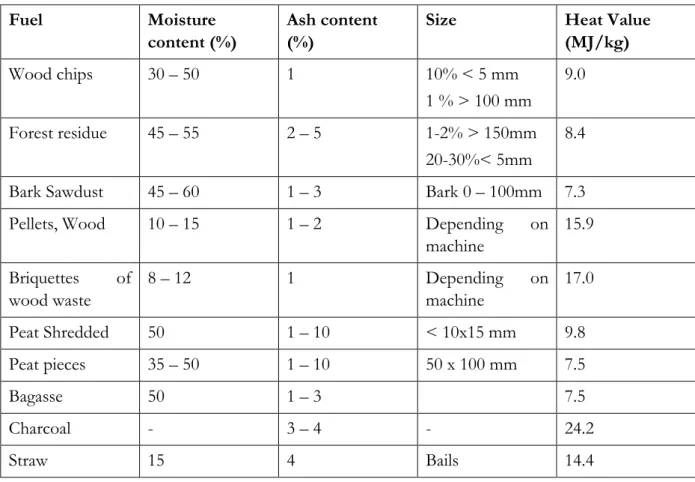
However, as a downside, biomass has relatively low energy density. Consequently higher volume is needed to produce one unit of energy. This is one major constraint as it involves higher transportation costs and larger storage volume demand. Biomass contains considerable amount of moisture depending upon the type of biomass, weather conditions and the time of drawing out (since harvesting). Removing moisture is an energy consuming process that can be covered from the stored energy in the fuel itself or by an external source of energy. This issue reduces the useful energy that can be extracted from the fuel and ultimately reduces the efficiency.
Table 6: Characteristics of biomass fuels found in Sri Lanka
(Sri Lanka Energy Managers Association, 2000)
Fuel Moisture
content (%)
Ash content (%)
Size Heat Value
(MJ/kg) Wood chips 30 – 50 1 10% < 5 mm 1 % > 100 mm 9.0 Forest residue 45 – 55 2 – 5 1-2% > 150mm 20-30%< 5mm 8.4 Bark Sawdust 45 – 60 1 – 3 Bark 0 – 100mm 7.3 Pellets, Wood 10 – 15 1 – 2 Depending on
machine 15.9 Briquettes of wood waste 8 – 12 1 Depending on machine 17.0 Peat Shredded 50 1 – 10 < 10x15 mm 9.8 Peat pieces 35 – 50 1 – 10 50 x 100 mm 7.5 Bagasse 50 1 – 3 7.5 Charcoal - 3 – 4 - 24.2 Straw 15 4 Bails 14.4
Depending on the physical properties of the biomass and due to issues like low energy density and high moisture content, there are some pre-processes involved with the biomass to make it a more convenient fuel. Suitable methods are selected as a required pre-process depending on their available properties and on the requirements and purpose of fuel application. These processes are described below.
The biomass at the harvesting point represents a variety of ranges of lengths and sizes. There are several physical processes to make it more convenient or a more improved version for the application.
Cutting to uniform length – This may be around 25-50 cm for domestic cooking purposes and may be around 2-3 m as to make easy for handling, transport and storage for the other commercial applications.
21
Chipping – This process greatly improves the density of the biomass making the handling, transporting and storing easier. This is very popular biomass improving pre-process especially for the commercial energy applications.
Grinding or shredding – In this process the equipment like Shredders, hammer mills, and tub grinders are used to reduce the biomass volume.
Raw biomass has high moisture content and depending on the properties of the application and the conversion equipment it might be applicable to use this raw biomass at wide range of moisture levels. But typically the moisture level 25-30% is maintained to make it as a more efficient fuel. Two major drying processes called “Active” and “Passive” methods are used to lower the moisture level after harvesting.
Passive drying – Relatively slow process which requires less energy. Required moisture level up to 25-30 % can be achieved but for any further improvements it is required to go for the active drying process.
Active drying – Relatively fast process which requires energy. High quality fuels can be achieved but it would not be feasible sometimes as it associates with relatively high costs. By means of the physical densification and moisture removing processes as described above, the energy density is improved and the raw biomass is converted to more convenient as a biofuel.
2.2.1.1 Biomass Conversion Technology
Type of biomass, characteristics of the application and the physical properties like energy density and moisture content are the most important parameters to consider when selecting the most appropriate conversion technology. This can be a thermochemical or biochemical process. Chemical properties, volatility, heat content and the chemical reaction characteristics are the other areas to consider.
Thermochemical conversion comes mainly in three types called “Direct combustion”, “Gasification” and “Pyrolysis” while the biochemical conversions can be “Anaerobic digestion” or “Fermentation”. Only the thermochemical conversion is the focus of this project.
Direct Combustion – Relatively dry biomass like wood and straw can directly be combusted to obtain energy for suitable applications. This has been very popular in domestic cooking and space heating. This is very well applicable method in Sri Lanka for the heating, drying and steam requirements in the small scale industries like tea factory, rubber factory and hotels. This is a simple method and would be feasible for the commercial applications if the efficiency of the overall system is well maintained through the proper technologies. This project explores this method in the view of technology advancement, fuel supply chain and feasibility analysis.
Gasification – Biomass is heated with the limited oxygen supply to produce a gaseous fuel (mixture of combustible components) which is more convenient for other applications like gas engines connected to power generators.
22 2.2.1.2 Biomass boiler
Different types of biomass boilers that convert bio-energy into heat energy by means of combustion are available. These types are depending basically on the source of the biomass. As described above there are various types of biomass and their upgraded versions like liquid and gaseous biofuels can be utilized in various types of boiler equipment.
The present project focuses on firewood boilers, which can be further divided as log boilers, wood chip boilers and pellet boilers. In the log boiler, the fuel wood is normally loaded manually and they are suitable for smaller applications like domestic water heating. Commercial systems are available with some little modification to the type of fuel and to the fuel feeding system. When the required labour is available, these type of boilers can be feasible due to low cost and simple technology. Wood chip boilers are more comfortable than the log boilers but they are relatively high in capital cost and the space requirement is also high compared to wood pellet systems. Pellet boilers are high density, more compact systems, which can be fully automated. They have a control system with comparatively low capital cost but the fuel cost is high since it needs to undergo more advanced drying and densification process. The space requirements for pellet storage and pellet burner are less compared to wood chip systems.
2.2.2 Bioenergy and biomass potential in Sri Lanka
Biomass can be obtained from different sources like residues left as plant materials during the post harvesting period, organic wastes such as Municipal Solid Waste (MSW) and sewage sludge and the residues left in the forest. These materials such as Rice husks and firewood can simply be burnt to produce energy and this has been a common traditional source of energy for most of the developing countries. But in the recent decades new biomass such as purposely cultivated energy efficient crops are becoming popular in large commercial stage that produces electricity, heat or any other form of upgraded fuel like liquid or gaseous biofuels.
Biomass is still the largest source of primary energy supply in Sri Lanka. According to the annual report 2013, the share of biomass is at 43.3% of the total primary energy supply in the country. But the exact figures cannot be accurately accounted as it is being the most common energy supply in the domestic sector for cooking purposes. Biomass has come to the electrical power generation sector as well. It is categorized into “New Renewable Energy” (NRE), which shows rapid growth for the last decade and this has been a success story through the government-supported renewable energy policy implementations such as the feed-in-tariff.
There is a huge potential for biomass energy plantation in Sri Lanka having approximately 0.72 million hectare of estimated land which accounts more than 10% of the total land in the country. Biomass comes in different forms. The most common forms of biomass available in Sri Lanka are Fuel Wood, Municipal Waste, Industrial Waste and Agricultural Waste (Sustainable Energy Authority).
23 Table 7: Primary Energy Supply by source in Sri Lanka
(Sri Lanka Sustainable Energy Authority, 2013)
Source Energy/PJ
Traditional Biomass 201.6 Petroleum 171.8
Coal 20.1
Major Hydro 60.4 New Renewable Energy 12.0
Total 465.9
Figure 15: Share of Primary Energy Supply by source in Sri Lanka
(Sri Lanka Sustainable Energy Authority, 2013)
Gliricidia sepium is very popular fuel wood as they are fast growing and it can yield 20-25 tons of
fuel from a hectare. There are many ways that these plantations can be established without a significant interference to the food crops achieved as a multi-crop in home gardens, as an intercrop in coconut plantations, as shade for tea plantations or as a multi crop for reforestation (Jayasinghe, 2014).
Dendro power which is known as generating electricity from sustainably grown biomass is a well
suitable power source for the tropical countries like Sri Lanka as it has potential to generate electricity throughout the year. Villages in Sri Lanka have enough bare lands to launch fuel wood plantations which can be used as a replacement of the fossil fuel. So that this is a vital source for meeting the non-conventional renewable energy targets while it delivers vital environmental and socioeconomic benefits. 43% 37% 4% 13% 3% Biomass Petroleum Coal Major Hydro
24
3 SYSTEM PROPOSAL
3.1 Overview of the hotel unit
Process heat requirement in a 5-star hotel equipped with in-house laundry, having room capacity for accommodating a maximum of 200 guests, is selected as an application ground for implementing the hybrid technology. The site location is selected as the “East Coastal” area by considering features like high tourist attraction, high solar potential and solid biomass supply. Considering the abovementioned studies on tourist industry and the availability potentials for solar and bioenergy resources in the locality, the following basic selections can be obtained and summarized as the main features of the particular hotel unit for the design considerations.
Table 8: Basic features of selected hotel unit for design considerations
Feature Value/ Description Cross-reference
Guests capacity of the hotel
200 (max) Estimated average annual
occupancy ratio
65% Maximum daily occupancy 100 % Minimum daily occupancy 45 % Location of the hotel
situated
South-East coastal Figure 16: Site location
Average Ambient Temperature
28 0C Table 9
Annual Rainfall 1000 – 1500 mm Table 9
Annual solar irradiance 1620 kWh/m2 Section 2.1.3, Solar Energy Potential in Sri Lanka (Figure 14: Annual Direct Normal
Irradiation (DNI) in Sri Lanka)
Average daily Solar irradiance
4.44 kWh/m2 (15.98
MJ/m2)
Maximum daily Solar irradiance
5.33 kWh/m2 As per Table 4, the variation in
maximum GHI for the locations “Kalametiya” and “Sampoor” show 16% and 17% variation from the average value. It is assumed that the intensity of variation in DNI is same as to GHI. Then the maximum daily DNI
25
for the site location is assumed as 20% above average DNI.
3.2 Site survey and selections for CSP application
Site location is considered as the south-east coastal area of the country, as shown in Figure 16.
Figure 16: Site location
Data specific to the site location can be given as below, see Table 9.
Table 9: Data related to the solar installation
Data/Parameter Value Reference
Annual Direct Normal Irradiation (DNI)
1620 kWh/m2 Section 2.1.3 (Figure 14: Annual Direct Normal Irradiation (DNI) in Sri Lanka
Average Ambient Temperature
28 0C (Department of Meteorology) Site
26
Annual Rainfall 1000 – 1500 mm (Department of Meteorology)
3.3 Site survey and selections for biomass application
Other than the different types of biomass and various pre-process methods for the different applications, it is required to assess the entire supply chain considering the field of origin, supply centers, transportation methods and to the pre-processing and storage options. These all options together with the energy conversion methods will determine the most appropriate type of biomass to be used.
Figure 17: Land distribution on main plantations
27
As described in the sections above, the following features can be selected for the biomass system as given in Table 10.
Table 10: Selections for the biomass application
Feature Selection/value Criteria/ Description
Type of biomass (fuel)
Gliricidia Huge potential to grow in the eastern side in Sri Lanka (land availability, suitable weather, labour availability), and solid supply can be assured. As given in Figure 17, huge land extent is engaged in paddy cultivation in “Ampara” area near to site location. So the climate is suitable for this energy crop plantation. It can be used as dedicated to this industry (mono crop) or as an intercrop plantation. Pre-process Cutting into pieces
and natural drying
(Figure 18 and Figure 19) Energy content (HHV) 17.64 MJ/kg (4900 kcal/kg) (UNDP, 2013) Moisture content of
fuel at burning stage
20% Needs 20 days of natural drying (Figure 18 andFigure
19)
LHV 13.7 MJ/kg (Jayasinghe, 2014)
a) Gliricidia Sticks with Bark b) Split Gliricidia Pieces
Figure 18: Gliricidia as a fuel
28
Figure 19: Natural Moisture reduction of different samples of Gliricidia
(Jayasinghe, 2014)
3.4 Requirements and conditions of proposed hotel unit
3.4.1 Hot water requirement
Features of the hot water requirement and the relevant standard code/source are given below in Table 11.
Table 11: Design guidelines to the hot water system
Parameter Value Source
Daily consumption per room (in Hotels/motels)
57 l/day (US Army Corps of Engineers, 2011)
Consumption per meal (restaurants)
9 l/per meal (US Army Corps of Engineers, 2011)
Minimum and Maximum Storage temperature
45oC and 65oC CIBSE Guide G (Public Health
Engineering, Section 2.4.7.2) – March,2004
According to the above conditions given in Table 11; and with the practical parameters and common practice (for tropical climate) found during the site visits, the following statements and the certain assumptions as given in Table 12; can be made for the design proceedings.
Table 12: Hot water system design data
Parameter Value
Hot water consumption for bath and shower per guest 25 l/guest Daily hot water consumption for kitchen/restaurant, and
other common uses (per guest) 20 l/guest Storage temperature 60.0 oC
For the hotel with a capacity of 200 guests
Maximum total daily hot water (@ 60oC) demand = (25 + 20) l/guest 200 guests
= 9,000 l/day
Assuming, density of water equal to 1 kg/l
Total maximum daily hot water requirement (@ 60oC) M
29 3.4.2 Steam requirement
Required data for the steam consumption for laundry purposes was obtained from the practical recorded data and available design data. Following details similar to this project criterion are given in Table 13.
Table 13: Characteristics of steam requirement data (data survey) Hotel # Guests Capacity Maximum Laundry steam consumption rate/ (kg/h) Service steam pressure /bar Maximum Daily steam consumption/ (kg/day) Condensate mass recovery Laundry operating hours (max) 10 270 595 8.0 5,200 56 % 10 hrs 11 320 685 8.0 6,200 55 % 12 hrs
According to the above conditions given in the Table 13 and with the practical situation found during the site visits, the following statements can be made to a hotel with 200 guests for the design proceedings.
Table 14: Steam system design data Guests Capacity Maximum Laundry steam consumption rate/ (kg/h) Service steam pressure /bar Maximum Daily steam consumption/ (kg/day) Condensate mass recovery Laundry operating hours (max) 200 520 8.0 4,000 57 % 10 hrs
3.5 Model Design of proposed system
Section 3.5.1 and Figure 20 below present the overall schematic diagram of the proposed system model layout. The thermal energy requirement is shared among the solar panels and the biomass-fired boiler, each of them feeding into the common steam header at 8 bar pressure, from which the laundry facilities are supplied. The solar panels also deliver heat to the hot water tank for supplying the kitchen needs and room showers, while the biomass boiler could also feed thermal energy to the hot water tank through a steam flash system.
30 3.5.1 Schematic diagram FV NRV CWS (Treated) CWS Steam Supply Hot Water Supply Rooms Kitchen Laundry Biomass Boiler Boiler feed water tank Solar Steam Generator Solar Panels CWS – Cold/makeup water NRV – Non Return Valve FV – Flash Vessel
Pump Pump
CWS (Treated)
Figure 20: Schematic diagram of the system model
m
HWm
LSm
Sm
CLm
CW 9 bar(a) 1.5 bar(a)m
CSSm
CBF NRV31
3.5.2 Operating technique and design considerations
a) Solar energy is harvested by Linear Fresnel type of concentrated solar modules installed on the roof of the building. The heat is transferred by pressurized water through insulated pipes. In the steam generator it produces steam to the required pressure through a direct heating method. But heat is also supplied to the hot water tank indirectly to avoid mixing with hot water supply and steam supply to prevent entering the treated water to the hot water supply.
b) It is assumed that the maximum available solar irradiance is harvested throughout the day by means of proper tracking system attached to the solar modules. North-South axis orientation is proposed as it has relatively higher surface effectiveness throughout the year as described in section 2.1.2.2.2. The tracking system theories and designs are beyond the scope of this project.
c) Hot water tank and the boiler feed water tank are controlled by Fixed Temperature Control (FTC) method. For example, when considering the hot water tank; if the temperature goes beyond the set value (65oC) due to the heat supply the cold (makeup) water is supplied to
the system and mixed to keep the water temperature at proper operating level (60oC). When
the water level of the tank reaches its maximum, all the cold water and heat supplies are shut down. Inversely, when hot water is drawn out due to high consumption, the water level in the tank is decreasing. Then the discharge valve closes when it reaches to the predefined minimum level.
d) Solar steam generator has been introduced to this system in order to collect the extra energy when the solar radiation is more than the design (daily average) value due to the seasonal effects. On the other hand, there are some situations when the total daily demand for the hot water is at reduced level than the design values due to the low occupancy level of the guests in the hotel. In these situations, the boiler is operated at low capacity since the solar steam generator provides enough steam to the system. Thus the total system design is proposed in such a way that the maximum possible solar radiation throughout the year is harvested.
e) Biomass-fired boiler is basically performing as the back-up steam supplier, but is dimensioned to cover the entire heat demand on its own. It receives feed water heated by the condensate recovery after the applications. During a low-solar day or in zero-solar situations the biomass boiler has to run at its full capacity and serves steam to all applications and to the hot water tank to sustain an uninterrupted hot water supply and to make the system fully self-reliable.