T1051
ACTIVITIES of GOLD-TELLUEIUM ALLOYS
By
ProQuest Number: 10781560
All rights reserved INFORMATION TO ALL USERS
The qu ality of this repro d u ctio n is d e p e n d e n t upon the q u ality of the copy subm itted. In the unlikely e v e n t that the a u th o r did not send a c o m p le te m anuscript and there are missing pages, these will be note d . Also, if m aterial had to be rem oved,
a n o te will in d ica te the deletion.
uest
ProQuest 10781560
Published by ProQuest LLC(2018). C op yrig ht of the Dissertation is held by the Author. All rights reserved.
This work is protected against unauthorized copying under Title 17, United States C o d e M icroform Edition © ProQuest LLC.
ProQuest LLC.
789 East Eisenhower Parkway P.O. Box 1346
Tib 51
A thesis submitted to the Faculty and the Board of Trustees of the Colorado School of Mines in partial fulfillment of the requirements for the degree of Master of Science in Metallurgy
ical Engineering,, William S„ Bennett Golden, Colorado Date: / 9 __ , 1965 Approved: Golden, Colorado Richard J .^Barton (Thesis Advisor) A. W* Schlechten, Head Dept, of Metallurgical Engineering Date: Z3 . 1965 ii
ABSTRACT
The binary alloy system, gold-tellurium, was investi gated in the temperature range 6l5°C to 750°C by equilibra tion of alloy samples with tellurium vapor using a multi- sample equilibration apparatus* The experimentally deter mined parameters were alloy temperature, tellurium temper- = ature, and alloy composition* The activities and activity coefficients of tellurium were determined from the experi mental data, and the activities and activity coefficients of gold were determined by use of the Gibbs-Duhem relation*
T1051 TABLE of CONTENTS Page Abstract o o o o o o o o o o o o o o o o o o o o o o o o o o o o o o o o o o o e o o e o o o o o 113. C O H . t ent S o o o o o o o o o o o o o o o o o o o o o p o o o o o o o o o o o o o o o o o o o o o o 1V LlSt O f Figures o o o o o o o o o o o o o o o o o o o o o o o o o o o o o o o o o o o o o * V* L I S t O f T aLL e S o o o o o o o o o o o o o o o o o o o o o o o o o o o o o o o o o o o o o o 3 7 * 1 Acknowledgments»».».o .0» « 8 o 0..».„•....o •. . . .. 0. . vii INTRODUCTIONo o o o o o o o o p o o o o p o o 0 o o o o o o o o o o o o o o e 0© o o o o o 1 THEORETICAL DISCUSSION o o o o o . o o o o o o o o o o o o o o e o o o o o o o o o 2 HISTORICAL DISCUSSION9 9 0 0 0 0 0 0 0 0 9 0 0 0 0 0 0 0 9 0 0 0 9 0 0 0 0 0 0 0 0 6 EXPERIMENTAL APPARATUS, 0 0 0 0 0 0 0 0 . 0 0 0 0 0 0 0 0 0 0 0 0 0 0 0 0 0 0 0 0 12 EXPERIMENTAL PROCEDURE«,.. . . ,. , . , , , , , , o , , , , . o . . , . . , , 21 EXPERIMENTAL RESULTS. . . . . . . . . . . . . . . . . . . . . . . . . . . . ..o . 27 CALCULATIONS and DISCUSSION...9... 28 CONCLUSIONS .. .. .0009000.0000000. O.O’ .000.000000. ooooo 33 APPENDICES 0 0 0 00 0 0 00 0 00 0 00 0 0 00 0 0 00 0 0 0 00 0 0 00 0 9 0 00 0 0 00 0 3^"
LITERATURE CITED. o o o o o o o o o o o d o o o o o o o o o o o o o o s o o o o o o o o 3^
'T1051
TABLE of ILLUSTRATIONS
Page
Dew Point Cell...
Nichrome Heater* ... 14
Equilibration Cell... . ... .... . .. •... . 16
Stainless Steel Block. ... 16
Furnace Arrangement... ... 18
Phase Diagram..«....o.o.eooo.ooo....o.o.oo.oo..00.0 29 Activity Curves ... 38-^2 Activity in Solid Solution Region... ^6
Pm vs. 1/T... ^8
Te ' Partial Molar Heat of Vaporisation... 50
Comparison with Other Work... 51
^ri05i
LIST of TABLES
Experimental and Calculated Results for Tellurium.o» Activities and Activity Coefficients for Gold.oo.oo. Partial Molar Heat of Vaporization of Tellurium0»o<,o
vi
Page .. 32-35 .. 36*37
ACKNOWLEDGMENTS
The author wishes to express his thanks to Dr» R. JV Barton, Assistant Professor of Metallurgical Engineering, Colorado
School of Mines for his advice and assistance during this study.
The author also wishes to thank Dr. A. H„ Larson, Asso ciate Professor of Metallurgical Engineering, Colorado School of Mines, for his help in interpreting some of the experimental results of the study, and to Dr. N. C. Schieltz, Professor of Metallurgical Engineering, Colorado School of Mines, for his assistance concerning the spectroscopic analyses involved in this investigation.
The author would like to thank the Colorado School of Mines Foundation for providing the financial support for this
INTRODUCTION
Thermodynamic activities in an alloy are influenced by the forces of repulsion and attraction that are present within the alloy. These forces are, at least to some extent, control led by the atomic arrangement in the alloy, so that activity data may give indications of this atomic arrangement. Further activity data aid in predicting how a material will react in both chemical and physical reactions.
Electrical measurements are currently in progress on this campus pn single crystals of the intermetallic compound AuTe^. The activity data of this investigation were obtained in hopes
that it would aid in the preparation of these single crystals. Also, in combination with these electrical measurement, the data may give indications of the atomic structure present in both the solid and liquid alloys of the system.
THEORETICAL DISCUSSION
The activity of a component in an alloy is related to its partial molar free energy, AG, as follows:
AG^ = R T l n a.
The integral free energy of a particular system can be calcu lated if all the partial free energies are known?
AG = ZN. AG:,
1 1
Where is the atom fraction of component i°
All the rest of the thermodynamic variables can be calculated if the partial free energies are known as a function of
temper-i AG. ± T AS. — 1 _ ± AH. - AG. , 1 1 ; t 3( A G^/RT ) 8 (1/T) ww W M J . V 9 AH. l AS. l AH. l
ujiiit&iL
and again the integral quantities are calculated as before.
AS = E N 1 ~AS^ A H = AlL
The activity, aj., of component i in an alloy system is defined as the ratio of the fugacity of i in the alloy, f^, to the fugacity in the standard state, f?»
a. = f./f*1 1 1
If the vapor over the: alloy acts as an ideal gas, the fugacity can be replaced by the vapor pressure. At the high temperatures and low pressures encountered in most alloy studies the vapors are very close to ideal. Hence, activity is defined as:
a i = V h
where P^ is the vapor pressure over the alloy and P? is the vapor pressure in the standard state.
Thus, the activity can be thought of as the escaping tendency of a component from the alloy.
The standard state for a condensed phase is the pure material at one atmosphere pressure and at the temperature
in question. Experimentally, however, the pure material at its equilibrium vapor pressure is a state which is relatively easy to obtain, convenient to use as a reference, and hence generally employed. The difference between the two is neg ligible as a pressure of one atmosphere does not affect the
flOSl
vapor pressure. If it is more convenient to use another stand ard state, it is simple to convert from one standard state to another•
An alloy may he regarded as a solution so that its behavior may be compared with an ideal solution. An ideal solution is defined as one in which t h e .components have no effect on each other. In this case, the vapor-pressure of each component over the solution is proportional to the amount of the compon ent present. Put into the form of RaoultVs law, the partial , pressure over the solution is equal to the atom fraction times
the vapor pressure of the pure material.
P. = Pf N. i 1 1
Thus the activity is equal to the atom fraction.
Since very few alloy systems exhibit ideal behavior, it is convenient to introduce a new quantity, the activity coef ficient, . The activity coefficient is defined as the ratio of activity to mole fraction, so that the activity coefficient for an ideal solution is one.
Y. = a „/n .
'i 1 1
Then the partial molar free energy will be given by:
AG. = RT In N. + RT In y.
i l l
Tidsi
is determined experimentally, then the activity of the other component can be calculated by using ,the Gibbs-Duhem equation. For a two-component system the equation is (Darken.and Gurry, 1953, P.- 258) :
N-^ d In + ^2 ^ ln a2 = 0
where the 1 refers to component 1 and the 2 refers to component 2*
If a^ is known as a function of mole fraction, then:
r ® i = Ni
I 2
In a, = - if d In a?
■ 1 J n = i wi *
Since it is difficult to express the experimental data for a^ in analytic form, this integral is usually evaluated graph ically. As approaches 1, approaches 0 and their ratio approaches infinity, which makes the graphical integration impossible. To overcome this problem, Darken and Gurry pro posed the following substitution:
In Y? In y
a2 = ” 2 ®lL = 2
Substituting a into the Gibbs-Duhem equation, it becomes:
r N i = %
in Y-j_ = “ 2 N1 / a2 d N1
= i
By constructing a curve of vs. composition, the above inte gration can be performed graphically as a remains finite at all values of N.
T1031
HISTORICAL DISCUSSION
There are a number of ways to measure activities experi mentally; the two most common for alloy systems are the meas urement of vapor pressures or the measurement of electromotive forces of electrochemical cells. The electrochemical cell method has two severe conditions that must be met. The cell reactions must be completely reversible and the cell reactions must be known with certainty,, The method gives good results when done properly, but the entire procedure requires great care •
The vapor pressure method of activity measurement is a very direct way of obtaining activities. There are two gen eral techniques used, the equilibrium or static methods and the kinetic methods. In general, the kinetic methods pass a known amount of inert gas over the alloy, condense out the volatile component from the inert gas and analyze the conden sate. By varying the gas flow rate, the metal content as a function of flow rate can be determined and extrapolated to
T1051
zero flow rate which should be the equilibrium value. This c method has several complicating features. The gas must be very pure, or it may affect the surface of the samples. The surface of the samples may become depleted in one alloy com ponent, resulting in concentration gradients.within the sample. Diffusion of the metal vapors through the system may cause the gas sample to become depleted or enriched with the metal vapor relative to the amount of material vaporized when the gas was passed over the sample.
The equilibrium methods are generally more reliable than the kinetic methods as they involve fewer variables. The pressure of the vapor over the alloy can be measured directly with one of the many types of pressure gauges available. Care must be taken to avoid any cold spots in the system, and any
interferences between the gauge mechanism and the vapor must be avoided or corrected for. For example, many low pressure gauges are affected by the molecular weight of the vapor. If more than one component is present in the vapor, some method must be found to obtain the partial pressures.
When only one component in the alloy is volatile, some specific methods are available. One of these methods is the dew point method of Hargraves (1939* p. 115)° Here the alloy is. sealed in the end of an evacuated transparent tube. The alloy end of the tube is set at some appropriate temperature, while the temperature of the other end of the tube is lowered
T1051 8
until a fine deposit or "dew” of the volatile component is condensed, at the cold endo The vapor pressure over the alloy at the higher temperature must equal the vapor pressure of the pure component at the lower temperature» The dew point method is convenient to use experimentally, but it has limitations which may prevent its use. The amount of the deposit must be kept small, or the composition of the alloy will be changed0 If the condensation coefficient for the vapor species on the alloy is quite low, the evaporation rate will be small, thus the dew will cause the vapor pressure in the.tube to be low ered below the equilibrium value, as fresh material cannot leave the alloy at sufficient rate to maintain the pressure0 A situation like this will give a dew point temperature
below the true value„ Supercooling of the vapor may be neces sary to cause nucleation of the fine droplets0 If this occurs, again the dew point temperature will be below the true value. Also the vapor pressure of the volatile component as a func tion of temperature must be known.
Another method first used by Seith and Kraus (1938, p. 98) is applicable when only one component is volatile0 Here an alloy at an appropriate temperature is equilibrated with the volatile vapor from a sample of pure material at a lower
temperature. The alloy will either gain or lose the volatile component until the partial pressure over the alloy equals the vapor pressure over the pure material at the lower
T1051
temperature. The time necessary to obtain equilibrium must be known, as the alloy composition will be incorrect if equil
ibrium is not obtained. There must be no areas in the system which have a lower temperature than the temperature of the pure component, as the component will condense in these cold areas and give a lower vapor pressure than desired throughout the system. It is necessary that the alloy samples remain in their equilibrium composition when the equilibration is com plete , .thus some method of rapid cooling should be devised. Again, the vapor pressure of the volatile component as a
function of temperature must be known. A modification of this method was used in this study.
It is necessary to know the vapor pressure of tellurium as a function of temperature in order to calculate the de sired activity values. There are a number of published stud ies in the literature concerning the vapor pressure of tellur ium: Brooks (1952, p. 227), Gattow and Schneider (1959,
p. I89, Kudryantsev and TFstyugov (I96I, p. 2421), Machol and Westrum (1958, p. 2950), Kelley (1935, p. 102). After care ful consideration of the data given in each, it was decided that the data of Machol and Westrum would be used. The work, as reported in the publication, appears to have been done with great care, and it is thought to be the best data available. The vapor pressure as a function of temperature is given by the following equation.
T1051 10
log Pmm Hg = + . 6^0 731^0 - I806l6$7 log T + 0 0.003^1783 T
The equation is valid over the temperature range 449 ®C to 855°C. The equation cqvers completely the temperature range of this investigation,.
By analogy with sulfur and selenium (Kelley, 1935> p»102), it was thought that tellurium might have more than one vapor species. It should be noted that the above expression for the vapor pressure is for total pressure and therefore the ques tion of vapor species does not affect the activity calcula tions, but it is an interesting point that seems worth discus sing. Yost and Russell (19^4, P° 285) state "electron-dif- fraction experiments on tellurium vapor at approximately 600®C show that mainly Te^ molecules are presento" Georgi
(1957) has measured the vapor density of tellurium from 512°C to 880 °C and has concluded that there is only a single vapor species of tellurium present in this temperature range„ Thus, it is thought that tellurium vapor is made up of essentially Te^ molecules„
There has been very little information published about the goid-tellurium systemQ The phase diagram has been
investi-/
gated by several workers and is reproduced in Hansen (1958, p0 23^)* This work was done quite some time ago and may not be entirely correct„
T1051
Tunnel and Pauling (1952, P° 375) have studied the struc ture of cal^verite (AuTe^) aind Krennerite (AgTe^) and have reported the space groups for the two compounds» In AuTe^, they conclude that the gold atoms are surrounded by six tel lurium atoms and tfaat the tellurium atoms are surrounded by three gold atoms and three tellurium atoms0
Markham (i960, p„ 1460) has studied the phases present in the ternary system Au-Ag-Te in the temperature range 150®C to 450 °C.
Kuznetsov and co-workers (i960, p0 1077) have studied electrocapillary phenomena in gold-tellurium alloys from
Au at ^85° Co From this work they have been able to calculate activitieso The activity data were presented only in the form of a graph0 Values from their curve are shown in Figure 15.
TfOSX
EXPERIMENTAL APPARATUS
When this study was begun, it was thought that the dew point method would be the most desirable method to use«
Results as discussed later proved this method was not suitable and a vapor equilibration method was used.
The cells for the dew point method were made from 9mm pyrex tubing 8 inches long. A sidearm was sealed on the centor of the tube to allow for sample insertion and evacua tion. Circular pieces of pyrex plate were sealed on each end of ^he cells. A schematic diagram of the cells is shown in Figure 1.
The lower temperature end of the tube needed to be var ied over a wide range of temperature. To accomplish this, a small nichrome heater was made up as is shewn in Figure 2. The inner cope of the heater was constructed of aluminum. The core was wound with 20 gauge nichrome wire. To prevent shorting, the wire was insulated with fish spine insulator. The insulated wire was wound on the core and coated with
TlO^l
Sauereisen zirconium base cement. A small hole was placed in
the end of the heater to allow access for a thermocouple and a larger hole to allow the end of the tube to be viewed.
The furnace used to obtain the desired temperatures was
a Heavy Duty resistance furnace, Model No. M-502^-S. The
furnace had an inside diameter of 5 inches and was 28 inches
long. It was equipped with three elements each with a separ
ate tap for individual regulation.
An Inconel block k inches in diameter and 3 inches long
was placed in the furnace. Four holes were drilled in the
block at equally spaced intervals, to accommodate the higher temperature end of the cells. A light was placed at the back of the furnace to illuminate the cells.
Since the dew point method was not satisfactory as dis cussed later, it was decided to use a vapor equilibration
method. For this method it was necessary to know the time
required to reach equilibrium. To determine the time, cells were made up similar to the dew point cells. Here the cells were made from 9mm vycor tubing, and were evacuated by get-
terfng as described later. The same furnace arrangement was
used as above.
The equilibrium time studies indicated that at least
three weeks would be required to obtain equilibrium. It
would have taken an extremely long time to collect the neces
T1051
(
, ru
Alloy Sample Dew Point Cell
Figure 1.
Nichrpme Winding Thermocouple Access
m rx S n o o o Q O O Q O Q Q
/
o o o o o o o o o o o o o o
Nichrome Heater Figure 2.
T1051
overcome this problem, a furnace was set up to run as many as 25 samples at one time0
Cells such as are shown in Figure 3 were made to run
several samples per cello Here the cells were 2k inches long, again made from 9nim Vyeor tubing» Small indentations were placed in the tube to hold the alloy samples in place»
The same furnace described earlier was used in the equil ibration but with some modification,, Since each winding could be controlled individually, a temperature gradient could be maintained along the length of the furnace0 Stainless steel blocks 1 inch thick and 5 inches in diameter were placed along
the length of the furnace0 A diagram of the blocks is shown in Figure k 0 The equilibration cells passed through the larger holes and the thermocouples thru the smaller holes o The blocks were located along the length of the furnace so that the alloy samples were located in the center of each block* Thermocouples were located in the center of each block to measure its temperature„ Thus the blocks served three purposes: 1) smoothed out the temperature gradient at the sample location; 2) provided a convenient method to measure sample temperatures; 3) held the sample tubes in the proper location,,
Since both the tellurium in the reservoir and the alloy samples were liquid at the temperatures involved, some method of keeping the materials in place was required„
T1051
<&r'\_____ ,___ m>r\________ 4&r\_______ mf\
\ Alloy'*'*’ Indentation^ Tellurium^
Samples Reservoir'
Figure 3° Equilibration Cell
Holes for Equilibration•Cells
Side View Front View
Thermocouple Holes
T1051
The furnace was inclined at a slight angle from the horizon tal with the tellurium reservoirs being located at the lower end, so that the tellurium was kept in that end of the cello The alloy samples were small, and the small indentations were sufficient to keep the alloys in place.
The temperature of the tellurium reservoirs was main tained by using small heaters such as were described earlier, except that here the inner core was made of stainless steel» The lower melting point of the aluminum prevented its use,
A diagram of the completed furnace arrangement is shown in Figure 5° The convection block was a piece of l/^ inch thick transite0 It prevented air from circulating around the cells between the heaters and the last stainless steel block° The temperatures in the furnace were controlled by using a General Electric controller, Model N o a 8H P0. The controller operated on the high-low principle,_ i.e., if the■temperature dropped below the set point, the controller operated in the high voltage position. If the temperature rose above the set point, the controller switched to the low voltage position. The controller thermocouple was placed in the highest temper ature in the furnace.. The controller output was fed into three variable transformers, one for each windingo By stepping down the controller voltage to the windings, a temperature gradient could be set up and controlled in the furnace. Control was
o *4“ ®
T105I 1? -p 2 & 0.0 O P O * H • H M - P O 0 (—I > pq U co -p £ 0 S 0 hO £ aS u u < 1 0 o ctf £ (V <P o o ®r4 p 03 0 o CO vr\ 0 P 2 hO • H
T1051
lowest temperature block.
Temperature control for the heaters was maintained by use
of a Fpxboro Potentiometric Controller. This controller also
operated on the high-low principle. A galvanometer was built
into the controller which was used to read the control thermo
couple voltage. The position of the galvanometer needle deter
mined whether the Controller was in the high or low position. The control thermocouple was inserted into the highest temper ature heater, so that again the highest temperature was used as
a control point. The controller output was fed into variable
transformers, one for each heater. Again by cutting the con
troller voltage down, the desired temperature could be main
tained. On the highest temperature heater, the temperature
was held toiJll/2°C, while on the others the temperature var
iation was -2°C.
All temperature measurements were made with platinum-
platinum rhodium thermocouples. The wire used in the thermo
couples was from Engiihard Industries and was calibrated at
their factories (Appendix No. I). The wires were C.P. plat
inum and C.P. platinum (8 7%) - C.P. rhodium (Vyfo). The
calibration was reliable to within 0.25$ up to 1 3 0 0 °C for
extended periods of time. The thermocouple wires were encased
in ceramic insulators 1/8 inch in diameter and passed through
the blocks as shown in Figure 5® The thermocouple voltages
T1Q51
Potentiometer Model 8662. This instrument wap calibrated
against a Leeds and Nprthrup K-3 Potentiometer and was accur
T1051
EXPERIMENTAL PROCEDURE
In the dew point method, the cells were prepared as ex plained, the alloy sample inserted, and the cell evacuated
-6
with a diffusion pump to 1 x 10~9 mm Hg pressure. The cells
were thep placed in t}he Inconel block and brought to temper ature. The window of the cell was observed through the hole
in the heater. The temperature of the heater was slowly
lowered until a deposit was formed on the window, raised until the deposit disappearedy lowered again, and so forth until the
actual dew point was determined* Due to difficulties explained
later, the method was abandoned.
The cells used in the equilibrium time determinations
were evacuated ip a different manner. The tube was sealed off
at one end, the alloy sample was placed in the tube, and a
neck was placed 8 inches from the sealed end. Several pieces
of titanium sponge were placed behind the neck, and another neck was placed in the tube about three inches from the first. Thus the titanium was restricted to a three inch section of
T1051
the tube* The tube was then connected t*o a mechanical vacuum
pump and evacuated for 30 minutes. During this time, the walls
of the tube were flamed several times in an attempt to remove
some of the absorbed water vapor from the tube walls. At the
end of the evacuation period, the cell was sealed off at the second neck, leaving the section containing the titanium sponge
attached to the cell. The section containing the sponge was
then placed in a resistance furnace for 2k hours at approxi:^
mately ?00oC, At this temperature, the titanium acted as a getter, reacting with the oxygen, nitrogen, carbon dioxide, and water vapor present in the cell, but not with hydrogen which is not expected to cause trouble. After gettering the
cell was sealed off at the first neck and was ready for equil ibration.
The cells were placed in the Inconel block used in the dew point studies to provide a constant temperature for the
alloy samples. The temperatures of the other end of the cells
were maintained by using the heaters as before. The starting material was all of the same composition, approximately AuTe2> Cells were t^ken out of the block at periodic intervals and analyzed. Equilibrium was considered to have been reached when the alloy composition became constant. Studies were
carried out at alloy temperatures of 600° C and heater temper
atures of 500°C. Equilibrium was attained within three weeks,
T1051
earlier was employed.
The alloys used in this study were all initially of the nominal composition AuTe^. The alloy was prepared by melt ing under vacuum. The materials used in making the alloy were supplied by the American Smelting and Refining Company and were 99*999$ pure. The company analyses are given in Appendix II. The prepared, alloy was analyzed spectroscop ically and was found to contain essentially the same impur ities as given in the compapy analyses. In the first few runs, all samples were approximately 200 mg., but later runs smaller
samples were used. At high tellurium pressures, the large ? samples took up so much tellurium that they ran around the indentations in the ce^ls. The smaller samples stopped this
problem.
After the alloy samples were placed in the cells, tel lurium was added at the reservoir end of the cells. A neck was placed 5 inches frqm the first indentation. The cells were then evacuated in exactly the same manner as the equil ibration time cells. The cells were then ready for equilibra tion.
The equilibration was a relatively simple matter. The cells were loaded into the furnace and the temperatures were set at the desired levels. The samples were allowed to equil ibrate for a period of four weeks. This longer period was chosen to eliminate any complications that might be caused
T1051
by the longer cells. Further, the sample temperatures were
higher than the temperatures in the equilibration time runs so it is felt tha,t equilibration was reached in all runs.
During the equilibration period, temperature measurements were
taken at least once a day. After the period was up, the fur
nace was shut off and the furnace was opened to the air. The
cells could not be remqved immediately. The alloys were
liquid and removing them before they solidified would have
caused them to run out from behind the indentations. Cool air
was blo^m across the cells and blocks to hasten cooling. Even
with the cooling air, there was still some tellurium loss from
the samples. The tellurium lost from the samples condensed in
the cells just outside the blocks. By scraping the condensed
material out pf the cells and weighing it, the loss was estim
ated to be no more than 2 to 3 mg* from a 200 mg. sample. The
cells were broken open by scratching the outside of the tube
with a file and then breaking the tube. The samples were
removed and were then ready for analysis.
As can be seen from the phase diagram for the system in Figure 6, there is a two-phase liquid-solid region on the gold side of the diagram. With an equilibration method as was used here, samples whose composition is in this region will not be obtained unless the tellurium vapor pressure in the cells
corresponds exactly the the equilibrium pressure in that region The chanpp of setting the temperature of the reservoir to
T1051
exactly the proper value to give the equilibrium pressure are very slight. Thus, the samples fell into two definite compo sition regions, those in the single phase liquid region and those i*i the solid solution region near the gold axis.
The samples from the liquid phase region were analyzed by a method described by Seath and Beamish (1937, P* 373)•
The samples were put into solution by dissolving them in hot aqua regia. The aqua regia solution was then evapor ated to near dryness; 5Q ml of 5 N HC1 were added to the
solution and agairi evaporated to near dryness. This procedure was repeated one mere time. The evaporations were necessary
to remove all the nitrate from the solution. The resulting solution was diluted with 5° ml of 1 N HC1 and the solution heated. 10 ml pf a 1 weight percent solution of hydroquinone were added to the solution containing the sample. The gold
t
was precipitated quantitatively by the hydroquinone. The
precipitate was filtered out using fritted glass filter, dried at 85°C? and weighed. The amount^ of tellurium present was found by difference. The method was checked by using known
f
amount of gold and was found to be accurate to 0.25 mg. out of 50 mg. sample.
The samples containing very low percentages of tellurium were analyzed spectroscopically. Standards were made up by distributing small amounts of TeO^ in a carbon matrix. The standard^ were vaporized in a carbon arc and their spectra
T1051
were recorded photographically usipg a Baird three meter spectrograph. The alloy samples were analyzed with the same
equipment. The samples were approximately 10 mg. in size,
and were in the form of a small piece of alloy. The piece
was tamped into a carbon electrode containing loose carbon. Both the standards and samples were arced for 20 seconds. The tellurium present was determined by measuring the trans- mittency of the tellurium lines in the standards and compar
ing them to the transmitfency fop the samples. The standards
and the samples were run on the sanje photographic plate so
that no problems would arise from developing. This is a
quantitative method without a matrix correction and is estim ated to be accurate to within a third of an order of magni^ tudet
T1051 2?
EXPERIMENTAL RESULTS
With the experimental apparatus used in this investiga tion, there were two independent variables, the sample temper
ature and the reservoir temperature. When these two variables
were set, the value of the third variable, the alloy composi
tion was fixed. The valpe of these variables are summarized
in Table 1» along with the calculated activity values for tellurium.
T1051
CALCULATIONS and DISCUSSIONS
In this investigation the activities of both tellurium
and gold were calculated. The tellurium values were calcu
lated from the experimental data and the gold values were obtained from the Gibbs-Duhem relation.
A consideration of the phase diagram for the system,
Figure 6, shows two regions of interest; A single^phase,
liquid region, and a two-phase, liquid solid region. A
single-phase, solid solution region is present near the gold
axis. The solid solution region has a very narrow range of
composition and does not show on the diagram. Applying Gibbs' Phase Rule,
F == C - P + 2
to the single condensed phase region, F = 2. Then, if the
temperature and pressure are fixed, the equilibrium composi
tion is fixed. Thus varying pressures along an isotherm will
cause the composition to vary. In the twa-^condensed phase
T e mp e r a t u r e T1051 1200 1100 .1063 1000 900 - Liquid o o 800 ‘ Au + Liquid 6 0 0 -300 -200 Atom Fraction Au
T10 51
equilibrium pressure in that region,, This single equilibrium pressure requires that the activity remain constants
When the dew point method was applied to this system, it was found that several of the necessary conditions were not met® It was not possible to condense a fine dew on the window® The only observable deposit that was condensed consisted of discrete droplets that had to grow to a fairly large size before they could be seen® These droplets were large enough that the composition of the sample may have been changed to a significant degree® Further, the cell may have been dis placed from equilibrium by this large deposit®
In order to determine whether the method was consistent, measurements were jnade on pure tellurium® Here the dew should form at the same temperature as the tellurium in the other end of the tube® It was found that approximately 1 0 °C of super cooling were necessary to form an observable deposit® A sensitive photocell was attached to the cell window in hopes that it would detect the deposit before it could be seen vis ually® The photocell indicated approximately the same amount of supercooling to detect the deposit® The long equilibrium times necessary in this system cast further doubt on the applicability of the dew point method® The tellurium loss from the alloy is so very slow that an equilibrium would be very difficult to obtain® Thus, the dew point method was abandoned In favor of the vapor equilibration method®
T1051
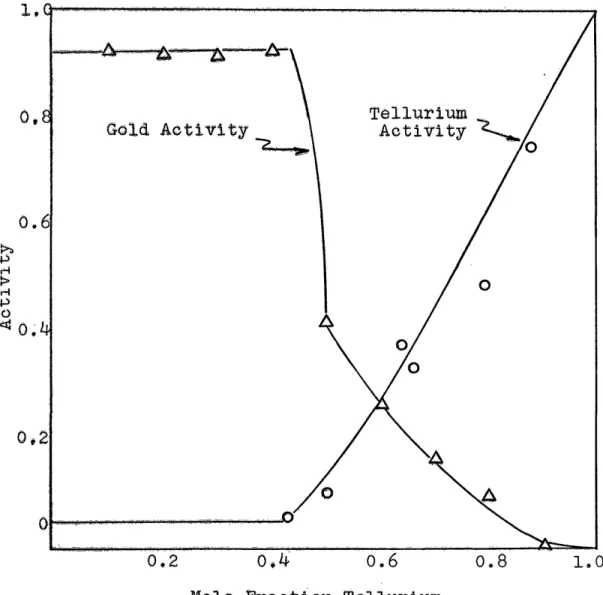
The activities and the activity coefficients of tellur ium are given in Table 1® The corresponding values for gold are given In Table 2. Figures 7 through 11 are plots of activity vs® composition for the indicated temperatures® Before these figures could be drawn, several facts had to be used® The activity of pure tellurium has to be 1, thus one point on the curve is defined. The experimental activities define the curve throughout the liquid region. The activity continues to decrease in the liquid region until the composi tion of the two-phase region is reached. At this point the activity must become constant. There was not sufficient
experimental data to define the two-phase region boundary. The composition of the phase boundary was obtained from the phase diagram. The constant activity portion of the curve was drawn until it intersected the phase boundary, then the rest of the curve was drawn as indicated by the experimental points. The composition of the solid solution region was so narrow that it shows up as essentially a vertical line on the gold axis.
As discussed above, the activity in the two-phase region is constant. It was not possible to obtain points in this region; however, it was possible t o ‘bracket the activity in this region to a narrow range. Alloys whose compositions were in the solid solution region did not have activities
T A B L E la E x p e r i m e n t a l an d C a l c u l a t e d R e s ul ts fo r T e l l u r i u m T1 0 5 1 32 sr o <u bo ox H P-k •rt O O o > ki <0 CD g o £■* © O r -4 e • 8*'S* g 6 cr © <z> f-t bC *0 e r - 4 w O « o w 3 t. ■ r —f Ck bO g g <9 </> v O s T c O 0 0 s r m C O r- m 1 O x r^» © s-4 C M O m 0 0 O CO O N v O 9-4 C M r*N C M C M sr 0 0 © t> 0 0 0 0 0 0 •<r C M 0 0 r-4 r-4 O s T sr 9=4 © v O C O r- 4 9 - 4 C M r - 4 <r C O H C O r - 4 m C M m C O O © © !>» i n r— f © C M C M O © O r - v O 4 © © C M O O O © © O x 0 © © O C O 0 O O 0 O s r © © © O v O c O O 0 0 0 0 0 0 0 0 O O © © © © © © O © co m C M r - 4 v O © v O C M O N O v O 0 m C O r - 4 © C M r-» v O » n C O O x H 0 O © © m C M r - 4 © © CM O 0 O © © © © O 0 © C O 0 © e 0 O 0 0 0 0 0 0 O 0 © © © © © O 0 © © x O v O V O v O v O s r s T s r S T sr O ' O O O © © C O C O co <0 C O r - 4 c O © 0 © 0 0 0 vt 0 0 0 O © © © 0 © O © 0 C M o CM m Ox o GO<r> c o © m OxCO in MT o o ov co m «M n ox o co tH r -4 o O Ov r- 4 ON r - 4 ON r - 4 CM CM CM O O O CM CM CM Sf Mf o CM Mf o CM <r in i n r-» min. m sr in r>--o CM CM CM CM i n i n » n m i n m m m oo o vO sr <r sO r^> n-so 00 S T O O 00 00 o so NT vO C". is. vO 00 sr f-n o o 00 00 o vO r^.. 00 o r- sr o vO i-* 00 00 sr C M r-4 C O C M 00 o CM <1* in Sf Sf r - 4 fN > r - 4 eo m r - 4 r - 4 O CM m vO m c o ST co CO io*. CO vO CM o o O s T st © © o VO CM ON in CM O co n- vo cm N O' IN fO N r - 4 © O O O Ov CM r - 4 ON CM OxCM ONCM O ' ^Ji r - f oc u 00 00 co 00 CM CM CM CM m m m in m r-4 so O r-4 m so V O v O Sf m r4 © Ox Ox 8~n ON VO © CM vO VO 9=4 r^vO '4'CM ON Mf m fN, r-4 CM m vO «n Sf m CM 00 CM © m fN» ox s—i m © 0 « 0 0 0 0 0 0 0 0 O 0 0 0 ST r-4 Ox 00 sr ^r Mt m CM CM CM JN. 00 ON ON CO 00 Ox Ox O' r«^ 00 ON ON ON OX 00 00 r-4 0 m r^> CM 00 r>» r>- m fN* © vO 0 r-» r>» rs vO sr m m VO 00 CM © r-» m vO CM vO 0 0 0 © 0 r> . 0 0 c 0 « 0 0 0 0 sr H ON 00 m "O -cf IN. co r-4 CO r=4 IN O ox Ox 00 00 ON i n ox |N* 00 OX CM m C O 00 m r » 4 C M r-4 r-4 H VO r - 4 ox ON r-4 o f"*. CO r -4 CO O ON r - 4 vO r-4 M s T C M r-* r-4 Ox sf ox r-4 Ox CM r-4 « o in sr CM ON r-4 ?N* ON O o 00 OX CM 52 § os
T1051 33 <y « r Q) to « S3 P* o o > » U p i a) g w a) a) H 03 « o rH O g* g* e 6 (0 <u CO H tp -O 6 r-4 w O ■r—V O 4-> « 43 S 4-> ■ e o o v-^ © o CO r-4 r4 {5 CX M> © S ® r-4 ttt 44 E-* CO JS m sr CM in |M- sr |M 00 vO t-4 m to sr to CM r-4 © © © « co in -S' © in N n vf co m *«r m \o N N co r-4 cm in o vo m m sr o CM r-4 oo CO CO sr CO Cm OV m |M CM CM Ov CO tM -S' o sr' 00 CM r-4 vO vO CM r-4 r-4 CO o 00 IM. m CO to CO CO c © © o o m e vO VO © © ■© a o .. <9 o o o co CO tM cm rM CM H m vo im ov sr sf cm 00 Ov 'r4 O O o •-» CO O O in sr sr o o sr o sr sr r-4 m tM m 00 V0 vC tM in CO Ov CM Ov |M CM |M o. vO to vO CO r-4 I'M in CM r-4 CM r-4 H o O r-4 o o O O « « © « © o O o • © m r-4 Ov V O CO i m CM r-4 O ST S vO CM NO cm im in to in ©o o © m vo no m sr co im in Ov Ov r-4 H m sr S T r-4 ST O vo in r-4 -S' -S' sr sr sr o o O O O in in m m m CM CM CM CM CM o O O o o m m m m m • « e « © « © © « « © © © © o CM <M CM CM CM r-4 r-4 r4 r4 r-4 VO vO vO vO vo Ov 00 im oo CM r-4 4*- <r »n c m vo to r-4 m ov r-r H O O to sr CO to MS- ST m tn m m m CO CO CO to to CM |M IM IM |M rv IM in m in uo m r-4 r4 r-4 r-4 r-4 O O m m tn in m m in in in in vo vO |M o vO im im im O O ov vo vo in r-cv m N f N ( s OV Ov OS in in m m o r-4 r-4 VO sr vO W sr sr sr r-4 m VO r-4 -S' CM -S' vO CM -s- n -S' vO VO vo VO |M fM vO vO vO IM |M VC vO vO vo m CM -S i m im rs vo cm. o n* oo ov r-4 Mf VO VO I'M fM fM to CO Ov fM r—1 I'M CO -S' Ov 00 VO sr o |M CM o OV rM rH fM CO vO r-4 00 © © © « « « © « © © « © vO vO -S' o tM r H CM vo OV CO CO CO Ov 00 00 OV Ov O OO OV O' o IM oo rH rH vO sr rs CO |M sr -S' Ov CM O m vo 00 'S' ov to o o vD CM sr IM in o • « © • © © © © © O © • co vO -S' Ov CO o O -S' Ov CO vo CM o sr CO Ov IM CM sr Ov © 00 rH CM r-4 r-4 rH rH r H »H rH m CM in fM to I'M sr tM. to to vo rM r-M r-4 co ov vo ov OV r-4 C O O O CO 00 CM OO CM OV vO vO tO tn m vo co o CM MS' to -s m to O OO f M Ov ov co vO in cm co ov r-4 rH r-l CO r-4 O 00 O VO ‘• o CM CM CM CM rH r4 to PS st P i
T1051 3^ © © 5S
<r
© o o > o Vi g, © 6 © © 3 ^ © o r-I ® © © CO H © r-4 •§ H O • O 4J S* © 0 * to S m i—j \o o ST CO vo r-4 00 tn in CO CM CM CO in oo vo o O N Ov VO I S 00 CO ST ov vo m sr © o o o rs is co i s ^a vO sf O CO sf 00 C M o 00 r -4 0 0 0 0 >-» tn sr oo vo «n ON i s CM O CM CM rs O ON OV rs tn r-i 00 CO CM tn <r Ov 00 CO o oo 00 vO CM m sr t n t n rs cm oo CM co co ov oo tn ov oo is | S o is 0 0 O r -4 CM CM C'* vo fs. tn vo sr cm cm is CO © CM CO vO r>. i s \ 0 s r co r—4 o CO sr tn Ov -4- is o rM CO is tn tn r-4 00 I S ON CO r s vO CM Sf O > 4 tn ON IS m co m O tn CO sr CO CM r-i r4 is tn Sf CM r—l vo «n CO CM vO sr VO • 0 0 : • ; « « . io ; 0 • -« 0 • • « • o c o r -4 sr CO t n r-4 CO CO r-4 o sr sr sr ^a sr rs IS IS is is *a sr sr r-4 r-4 IS is IS IS rs tn m m tn tn tn m tn m m •a sr sr sT ON ON tn m m tn m m * o • . 9 • • . e • 0 0 0 e 0 0- 0 0 0 0 0 0 O v ON OV ON Ov sr r-4 sr i—4 sr r-4 sr H sr «— i Ov r-4 ON i—4 ON r-4 ONr-4 srCO. srCO sr sr sr sr sr 00 00 00 OO OO co co CO co co r-4 r-4 r-4 CM CM CM CM CM m m m m m I S I S rs is vO V 0 vO VO VO vO vO vo vo 'P vO vO vo vO o © 00 00 oo00 00 00
tn tn m oo oo oo oo m tn rs vO is ©V VO is. *a rs oo VO I Ts rs V P rs ON VO r s sr IS. OO vO is. rs. ov vo O »— 4 rs I S oo rs co vO sT vO is is is cm © oo oo tn r-4 co sr © sr vO ■ vO vO is is is vO sr |S sr O IS sr IS co r-4 vO © © Ov CO CO r-4 rs r—l r-4 CM CM r-4 CM OO © ov 0 - 0 0 - 0 0 0 0 0 'o 0 0 0 0 0 vO CO in o IS tn o co s a © CO tn m Ov CO in sr vO IS W m is in vO VO -a IS m srIS Ov OO oo C O rs o co co sr cm tn sr tn co co CM » A co sr os 4JI g
CHS o CO CO vO -a CM CM o CO CO sr is rs CM CM 00 m r—4 *—4 vO CO 00 in Ov -a -a vO vo cm CM m I S CM 00 Ov 0 0 0 0 0 0 0 0 0 0 0 0 0 0 o o 0 co oo OV ON is o Ov VO 00 i—4 co CM m I S sr co vO © i-4 I S 00 o r-4 r-4co ON tCM-4 rs I S f—4 CO vOrr4 Ovr4 CMH Ov t—4 vOr-4 oi-4 O O tn sr co I S ov vO co CM o o sr sr is CM vO is 0 0 I S co co t n PST1051 35 T3 U
8
■a H Cl Cl<r
CU o u > O w * O Cu w S Cl Cl OS H O U T-t O cu a. g 6 «3 ci C/3 H 60 •O & rH O O • e> 35 Cl /"» r-4 60 g* ^ g >>✓ (0 03 +J 3' r—4 i s rH oo O ' o cn cn sr o in rs O ' rH m CM O ' sO r-i sO r-i in cn m o VO m S T CM CM CM CM OO O ' so sO m CM • e c e a oo o a o o ° o o o m m CM o> CMrs so sO sr rs in rs rs o 00 VO SO m O vO O O' O •o CM CM cn NO vO m sr o SO vO sO 00 so sr m ■• • • » o e o 9 e « 9 o o sr sr cn m o O' 00 O' rs rH m rs o rs. sr m o sO rs CM O' cn O' O' cn rH sr cn CM rH o rH rH m is CM cn CM rH • • 9 9 o e 9 e 6 e ft o 9 60 o © o o o rs rs CM oo 00 rH rH 00 » ra rO sr sr rs rs O' 00 00 sr ST rs ft 9 9 » « 9 o a 9 a o o o i cn cn cn c n cn rH rH m cn O' O' cnrH cnrH cn cn cn cn <n CM CM 00 o o 00 00 I S rs rs rs rs, rs ra sr o cn cn >3- sr O m m m in m in in is sO sO sO s o m CM O 00 m m o O in 00 00 CO m CM rH cn sr o sr cn m sr sr © O sr rH sO sO so IS rs sO sO rs sO is rs rs SO sr m sr is mrH O' O' sr sr* p m CM rH cm rs CM rH «n o CM sr O' rH sr cn cn • • • • • ft ft 9 o o o o o o m m O' O' cn so rs cn cn IS O' cn CM CM cn sr sr CM cn CM rs cn rs CM e> CM Is •a- O' 00 sO CM O's
-3* iH rH so oo O' «H rs in 00 sr m rH SO cn rH • • « c e c c c c o o o oo sO o O' oo CM rs O' m cn m IS m sr SO O' O' <*> CM m in m cn > rH rH rH in ■u Z a 5 ° erf o 84 c 05 7 4 .3 6 63 0 50 7 0 78 o 08 0 .1 6 7 c 4 7 6T1051 36
TABLE 2* Activity and Activity Coefficients of Gold Calculated from Gibbs-Duhem Relation
Temp Activity Activity Atom Fraction
Coefficient Gold 615°C *0032 ,032 ,1 •0174 .087 .2 .0666 .222 .3 .190 .475 .4 .460 .920 .5 .924 1.54 .6 .917 1.31 o7 .920 1,15 .8 .927 1.03 .9 650#C .00495 .055 .1 .0984 .123 .2 •163 .234 .3 .257 .429 .4 •415 .831 .5 .924 1.54 .6 .917 1.31 .7 •920 1.15 .8 .927 1.03 .9 670°C .0046Q *052 .1 .0968 .121 .2 •1645 .235 .3 .268 .447 .4 .419 .839 .5 •924 1.54 .6 .917 1.31 .7 .920 1.15 .8 .927 1.03 .9
1051 37 Table 2 Temp 705aC 750°C (Contd*) Activity Activity Coefficient Atom Fraction Gold *00909 *137 ®180 *230 *313 *924 *917 *920 *927 #0182 *218 *232 *241 *267 *400 *917 *920 *927 olOl * 171 *257 *383 *626 1*54 1*31 1*15 1*03 *202 *237 ®331 *401 *535 1*00 1*31 1*15 1*03 ol *2 * 3 *4 *5 *6 *7 a 8 *9 ol *2 *3 *4 *5 © 6
A c t i v i t y T1051 1.0 Tellurium Activit L Activity 0.2 -oT5 o'. 6
Mole Fraction Tellurium
0.2 1.0
A c t i v i t y T1051 39 l.G 0.8 -Gold Activity 0*6 -0.2
-Mole Fraction Tellurium
A c t i v i t y T1051 Tellurium Activity O eS Gold Activity 1.0
Mole Fraction Tellurium
A c t i v i t y m X g S l Tellurium Activity Gold Activity 0.6 0,2
Mole Fraction Tellurium
A c t i v i t y T1051 1.0 Tellurium Activity Gold Activity
Mole Fraction Tellurium
T1051 ^3
0o055 were obtained* Thus the activity in the two-phase region is bounded by 0*0^5 and 0 o055® The data indicate negligible change in activity with temperature, but it is expected that there would be some small change. If there is any change, it is less than the experimental uncertainties* The experimental points for the 6 50°C isotherm indicate a higher activity in the two-phase region than the range stated above* The curves for 6l5°C and for 6 70°C bracket the activity quite well* It is not expected that the activity would increase at 650°G and then decrease at 6 70°C, so it was assumed that the activity was the same at 650°C* When the temperature is such that the
tellurium pressure in the cell is very close to the equilibrium pressure over the two phase mixture, temperature fluctuations can shift the pressure so that the equilibrium composition may wander from one side of the two-phase region to the other*
In this case, equilibrium is never reached and compositions can fall anywhere in the two phase region* It is thought that this is the cause of the apparently high activities in the two phase region for the 6 5G°C isotherm*
Experimental difficulties were encountered in the 75° isotherm when 7 5 0°C was the highest temperature in the fur nace* The samples in the last block could not be cooled fast enough to prevent excessive tellurium loss from the samples. This loss shifted the compositions toward the pure gold axis, thus giving points of apparent high activity* On
T1051
later runs, cooling air was focused directly on the -last block. Points obtained with this type cooling lie close to the curve.
The 705°C isotherm is not entirely satisfactory. The experimental points show considerable scatter that cannot be explained. The maximum error in activity due to temperature control is approximately ^5% and the error in composition is estimated to be -3%• These errors are not sufficient to account for the scatter. The curve was to some extent drawn by utilizing the general shape of the other curves.
The sample temperatures from various runs for a particular isotherm differed from the average temperature by as much as 10°G. The necessity of correcting the activities to the aver age temperature was studied and the corrections were found to be so small that they were negligible.
It is thought that the equilibrium is affected by the presence of oxygen. Tellurium oxide is a definite white color and is easily detected if present in the equilibration cells. When the oxide could be seen in the cells, the results dif fered considerably from the results where oxygen contamination could not be detected. The results of contaminated cells were discarded. Occasionally a dark film was found on the samples, apparently a thin oxide film. These samples gave essentially the same activity as samples with no film.
In the single phase, liquid region the tellurium activi ties show substantial deviation from ideality. The negative
T1051
deviation from ideality indicates that there are substantial attractive forces present in the alloy tending to keep the tellurium in solution. Further, the deviation indicates a tendency toward compound formation in the solid state.
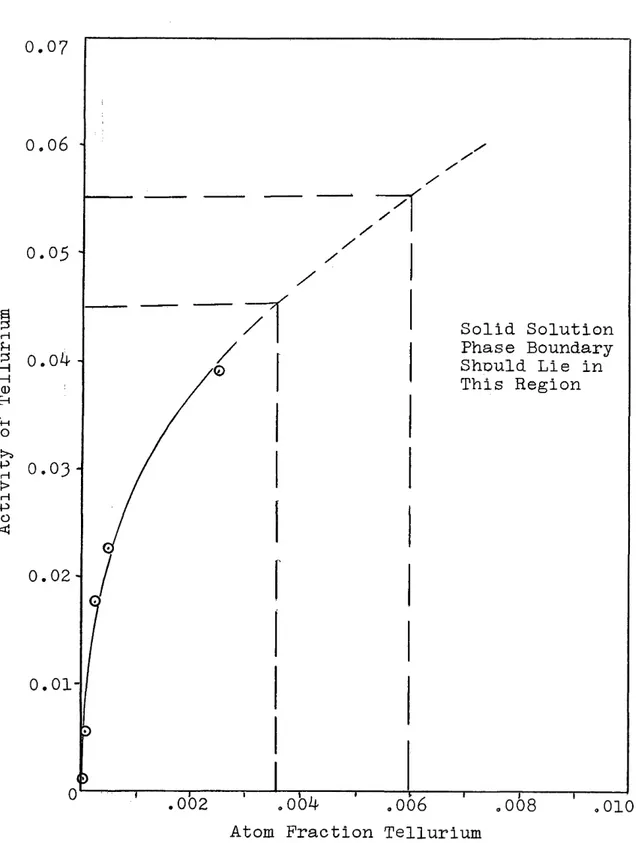
In the single phase, solid solution region near the gold axis, the tellurium activity shows severe deviations from ideality, only here the deviations are positive rather than negative. The tellurium activity increases very rapidly with a very small change in composition. This very strong devia tion indicates that tellurium is repelled by the solid gold, as wou^d be expected from the very narrow range of solid solu tion.
During the course of this investigation, several samples were obtained whose composition was in the solid solution region. Since the extent of solid solution has not been reported in the literature, the solid solution samples were analyzed spectroscopically to get some idea of the extent of
solution* Figure 12 is a plot of activity vs. atom fraction tellurium'in the solid solution region at 750°C. Assuming the activity in the two phase region is 0.0^5 to 0.055> then tb© boundary of the solution region lies between 0.0035 and 0.0060 atom fraction tellurium. The boundary was not deter mined at any other temperatures, as there were not sufficient points available to construct another isotherm.
A c t i v i t y of T e l l u r i u m T1051 0.07 0.06 Solid Solution Phase Boundary Should Lie in This Region 0 .02-i i : 1 r— 1— .004 .006
Atom Fraction Tellurium
002 008 010
Figure 12. .vs in Solid
T1051
in talking about deviations from ideality,. The extent of the deviation in such a region is a measure of the sum of the at tractive and repulsive forces present„ This sum. is dependent on the amount of each phase present,,
One method to check the consistency of the data is to plot In P,pe vso l/T for a particular composition* This is an application of the Claussius-Clapeyron equation*
= R t 2
AH.^ should change only slightly with temperature over a 100 degree change, so that the plot should be very close to a straight line* AH^ is the average partial heat of vaporiza tion over the temperature range in question of the volatile component (Kubaschewski and Evans, 1958? P° 11)»
A plot of this type is shown in Figure 13 o The values used in the figure were taken off the smoothed activity curves* The activity values were used to calculate the tellurium pressure over the alloy* As can be seen from the plot, the points for a single composition fall on a reason ably good straight line* The slopes of these lines are equal to AH /R* The A H J s were evaluated and are given in Table 3®
T e l l u r i u m P r e s s u r e O v e r A l l o y in T1Q51
Tellurium Pressure Over Alloy vs„ l/T for Various Compositions«
Pure Te 30-Te 20 -Te Te 10 -Te o00110 000995 00100 Figure 13»
T1051
TABLE. 3* Partial Molar Heat of Vaporization vs Atom Fraction.
Composition AH^
Atom Fraction Tellurium (cal/mole)
.9 28.1
.8 29.5
.7 32ol
.6 32 o 6
.5
38o
9The heat of vaporization of tellurium at 680°C 9 the average temperature of this study9 is 25 o 5 kcal/mole (Machol and Westrum, 1958, p. 2950)° As can be seen in Table 3s> the partial heat of vaporization is approaching the heat of vapor ization of pure tellurium as the atom fraction of tellurium increases. The data is plotted in Figure 14. No signifi cance is attached to the shape of the curve, but it does extrapolate close to the heat of vaporization of pure.tellur ium. The change in the partial heat of vaporization with
composition again indicates that the attractive forces present in the liquid phase increase with decreasing tellurium content, as was indicated by the increasing negative deviation from
ideality of the activity/with decreasing tellurium content. Figure 15 compares the activity data of Kuznetsov at 485°C with the 6l5° and 75®°isotherms of this study. As can
P a r t i a l M o l a r H e a t of V a p or i za t io n in K c a l / m o l T1Q51 50 (D 078
Atom Fraction Tellurium
Figure 1^. Partial Molar Heat of Vaporization of Tellurium vs Atom Fraction.
A c t i v i t y T105X Kuznetsov*s Data ^85 ®C 615°C 0.2
-Atom Fraction Tellurium
Figure 15. Comparison of Data of This Study with that of Kuznetsov at ^85 °C„
T1Q51
be seen from the figure, the three activity curves show the same general type of behavior. Further, as would be expected, the activity increases with increasing temperature.
T1051
CONCLUSIONS
The activities of tellurium and gold in their alloys were determined as a function of temperatiare and composition as given earlier.
The activity?of tellurium in the alloys shows strong negative deviations from ideality in the liquid region from 615 °C to 750 °C.;
The phase boundary of t he.gold-rich solid solution was found to lie between 0^0035 t'o 0.0060 atom fraction
tellur-T1051
APPENDIX I. Calibration data for platnium-platnium-rhodium Thermocouples
Millivolts Degrees C Millivolts Degrees C
3.404 400 10.477 1000 4.464 500 11.819 1100 5.570 600 13.196 1200 6.728 700 14.583 1300 7.93^ 800 15.967 1400 9.184 900
The calibration of thermocouple may change during use. The magnitude of the change depends upon the temperature, the length of time, and the conditions under which it is used. Thermocouples of the type covered by this certificate are reliable within about 1/4^ up to 1300°C if used in a clean oxidizing atmosphere and not used for extended periods above 1300°C.