UPTEC ES 18 024
Examensarbete 30 hp
Juni 2018
Power Quality Analysis
at Falu Hospital
Teknisk- naturvetenskaplig fakultet UTH-enheten Besöksadress: Ångströmlaboratoriet Lägerhyddsvägen 1 Hus 4, Plan 0 Postadress: Box 536 751 21 Uppsala Telefon: 018 – 471 30 03 Telefax: 018 – 471 30 00 Hemsida: http://www.teknat.uu.se/student
Abstract
Power Quality Analysis at Falu Hospital
Jennie Aldenlid
This is a master thesis performed on behalf of ABB Power Quality Center, aiming to investigate the power quality at Falu hospital. Hospitals can suffer from bad power quality both in the aspect of malfunctioning equipment, and as they can provide disturbances to the power grid. In hospitals it is essential that everything works properly, or the consequences can be fatal. The daily operations at a hospital contains a number of different electrical equipment, from ordinary computers to advanced machines for x-rays or chromatography. This type of equipment can cause disturbances in the power system and other equipment can be affected by this. Therefore, it is very important for hospitals to have good power quality.
In order to investigate the power quality, a measurement study was performed at the hospital in Falun. The parameters considered in this study were supply voltage variations, voltage dips, voltage swells, rapid voltage changes, voltage unbalance, voltage harmonics and consumption of active and reactive power. To determine the quality of the power the Swedish statute EIFS 2013:1 was used as a reference for the voltage variations and the grid operator’s guidelines for the power parameters.
The data from the measurements were analyzed with PQSecure and Matlab. The reults showed that the hospital had no problems regarding the studied parameters of the power quality. They were approved in every case investigated in this study however there could still be improvements regarding the power factor.
Tryckt av: Uppsala
ISSN: 1650-8300, UPTEC ES 18 024 Examinator: Petra Jönsson
Ämnesgranskare: Karin Thomas Handledare: Henrik Andersson
i
Populärvetenskaplig sammanfattning
Elkvalitet kan handla om utförandet på den elektricitet som vi använder, alltså om hur vågformen för strömmen och spänningen ser ut. Idealt är spänningen en sinuskurva med känd amplitud och en frekvens på 50 Hz och i ett trefassystem ska det vara 120 grader mellan faserna. Elkvalitet kan också handla om att elförsörjningen ska vara pålitlig och utan oförutsedda driftstopp.
Elektrisk apparatur är gjorda för att fungera för en viss typ av utformning på spänningen och för stora avvikelser från detta kan leda till bristande funktionsförmåga och i värsta fall till att de inte fungerar alls. Förutom att funktionaliteten för både elnätet och inkopplad apparatur kan försämras av dålig elkvalitet, kan det också leda till överdriven elkonsumtion. Att mer elektricitet än den som behövs dras från nätet leder till onödiga kostnader men kan också påverka klimatet, beroende på vilken energikälla som används.
För sjukhus kan elkvalitet vara extra viktigt eftersom det är av stor vikt att all apparatur fungerar som den ska. Samtidigt kan utrustningen på sjukhus bidra till dålig elkvalitet som kan sprida sig inom elsystemet för sjukhuset men också till överliggande elnät. En elkvalitetsanalys utfördes på Falu lasarett med syftet att utreda om det fanns avvikelser från rådande standarder som skulle kunna leda till problem för sjukhusets elsystem och överliggande elnät.
De elkvalitetsparametrar som utvärderades i den här studien var kortvarig spänningssänkning, kortvarig spänningshöjning, snabb spänningsändring, långsam spänningsändring, spänningsosymmetri, övertoner och reaktiv effekt.
Långsam spänningsändring innebär att rms-värdet på spänningen ska ligga inom en gräns på 90 % till 110 % av nominell spänning. Kortvariga spänningshöjningar och -sänkningar är tillfälliga variationer i spänningsnivån som går över eller under gränsen på 90 % till 110 % av den nominella spänningen. Snabb spänningsändring är inom ramen för tillåten storleksvariation men ändringen sker snabbare än 0,5 procent per sekund. Spänningsosymmetri är då faserna i ett trefassystem skiljer sig sinsemellan vad gäller storlek och förskjutning från varandra. Övertoner uppkommer då vågformen för antingen spänningen eller strömmen inte är en ren sinuskurva, ju mer övertoner desto mer förvrängd är kurvan. I den här studien fokuserades på spänningsövertoner, både enskilda och total övertonshalt.
Effekt kan delas upp i aktiv och reaktiv, där den aktiv effekten är den del som kan utnyttjas av elförbrukande apparatur. Då aktiv effekt är den nyttiga, blir utnyttjandegraden för elledningar högre om kraften består till största del av just aktiv effekt. Viss apparatur behöver dock reaktiv effekt och det bidrar till en ökad andel reaktiv effekt i elnätet. Elnätsägaren Falu energi och vatten tar ut en avgift om uttaget av reaktiv effekt från elnätet är för högt i förhållande till den aktiva effekten.
Elkvalitetsmätningen utfördes med verktyget Unilyzer 900 och analys utfördes i tillhörande datahanteringsprogram PQSecure och MATLAB. Spänning och ström mättes kontinuerligt och de olika elkvalitetsparametrarna beräknades och ett medelvärde sparades internt i mätverktyget var tionde minut. Även det maximala och minimala värdet för varje tiominutersperiod sparades. Alla spänningsparametrar jämfördes med energimarknadsinspektionens föreskrifter och allmänna råd om krav som ska vara uppfyllda för att överföringen av el ska vara av god kvalitet, EIFS 2013:1. Uttag av reaktiv effekt från elnätet jämfördes med restriktioner från elnätsägaren, Falu energi och vatten.
Alla undersökta parametrar låg inom gränsvärdena för EIFS 2013:1 och elnätsägarens restriktioner, utifrån det drogs slutsatsen att elkvaliteten för Falu lasarett är bra. Resultaten visade även att effektfaktorn skulle kunna höjas för att förbättra elkvaliteten ytterligare.
ii
Executive Summary
Power quality can refer to the form of the voltage, that should be a pure sinusoidal with fixed amplitude and a frequency of 50 Hz. Deviations from this can cause connected loads to malfunction, or even break. Power quality can also refer to that the power supply should be reliable without power cuts.
The Swedish Energy Market Inspectorate have provided guidelines for what can be considered good power quality in the statute EIFS 2013:1. These guidelines together with restrictions from the grid operator, Falu energi och vatten, have been used as reference for good power quality in this project. The power quality at Falu hospital was measured and analysed in order to map it and see if there were any discrepancies from the present standards that could cause them any trouble. The investigated parameters were supply voltage variations, voltage dips, voltage swells, rapid voltage changes, voltage unbalance, voltage harmonics and consumption of reactive power.
Measurements were done at three locations at the hospital, one at the substation receiving power from the grid, one at a substation feeding an X-ray unit and one at a transformer where a former power quality measurement had been done. The measurements were done by the instrument Unilyzer 900 that measured the current and the voltage and from that calculated the power quality parameters.
By supply voltage variations means that the voltage levels should be within a limit of plus- minus- 10 % of the nominal voltage. This criterion was held in all three measuring points. If the voltage level decreases under 90 % of the nominal voltage or increases over 110 % of the nominal voltage during a short period of time, it is called a dip or swell. No events of voltage dips or voltage swells were detected during the period for the measurement. A change in voltage level, within 90 to 110 % of the nominal voltage, but faster than 0.5 % per second is called a rapid voltage change. According to EIFS 2013:1, an event of a rapid voltage change is divided into ΔUstationary, which is the difference between the voltage
level before and after the event and ΔUmax, which is the maximum voltage difference during the event.
No ΔUstationary larger than 3 % of the nominal voltage and no ΔUmax larger than 5 % of the nominal
voltage, which were the threshold values from EIFS 2013:1, were detected during the measurements. Voltage unbalance is when there is a variation in the amplitude or in phase shift between the phases in a three-phase system. The limit according to EIFS 2013:1 is at 2 % and all values for the three measuring points were well within that limit.
Harmonics are waveforms with frequencies that differ from the fundamental frequency, 50 Hz. Harmonics can be divided into total harmonic distortion (THD), which is a measure of the total share of harmonics in the system and individual harmonics. Individual harmonics are categorized as multiples of the fundamental frequency. The limit for THD from EIFS 2013:1 is at 8 %, and no levels of THD reached that for any of the measuring points. Regarding the individual harmonics there were different limits for the different orders, but none exceeded its limit. The most present harmonic was the seventh and after that the fifth, which both originate from non-linear three-phase loads such as pumps or UPS-systems.
Power can be divided into active and reactive power. Active power is useful for loads, while reactive power cannot perform a work at the loads and is only necessary for certain applications. Transmitted reactive power lowers the share of active power in the lines. The grid operator Falu energi och vatten have a restriction saying that 50 % of the subscribed power can be taken from the grid as reactive power. Any excess reactive power consumption will be subject to a charge. At Falu hospital, both the active and reactive power stays within the limits of their power subscription but the subscription may be a bit overdimensioned. The maximum power levels are a bit under the subscribed power level and in order to save money the subscription level could be lowered.
iii
While looking at power consumption, the power factor can be taken into account. Power factor is a measure of the share of reactive power in the system, and the lower the reactive power the closer to one is the power factor. At the receiving station, the values for the power factor in one of the phases had an error due to a bug in the measurement instrument. The other two phases were considered valid, and those power factors are a bit under one and could be improved by adding a capacitive load, such as a capacitor bank, to the system.
The conclusion is that the power quality at Falu hospital is good. They are approved on every parameter investigated in this project, according to the statute EIFS 2013:1 and the grid operator’s restrictions. To improve the power quality at the hospital even more, the power factor could be increased to be closer to one by adding a capacitive load.
iv
Preface
This is a master thesis at the master programme in energy systems engineering at Uppsala University and Swedish University of Agricultural Sciences. The project investigates the power quality at a hospital and was performed on behalf of ABB Power Quality Center in Ludvika and in collaboration with Falu hospital.
Acknowledgment
First of all, I would like to say a big thank you to my supervisor at ABB, Henrik Andersson. He has been very patient and supporting and has always been around to answer my questions. To enable this project, Henrik has given me a great share of his energy and work time. I would also like to send at thank you to Nathalie Fransson at Power Quality Center and to all at the department Capacitors at ABB for being very nice and welcoming to me and fellow master thesis students. You all have contributed to a nice working atmosphere and you have been a great company at all the energizing coffee breaks, which really helped the work ethic.
I am also grateful to my supervisor at Uppsala University, Karin Thomas, for being supportive and for helping me with all kind of things regarding this master thesis project and this report.
A special thank you will be sent to Roland Markus, electricity manager at Falu hospital and Stefan Jansson, electricity manager at the county council’s property management. Thank you for letting me perform the power quality measurement at Falu hospital. Without them the measuring study in this project would not be possible.
Ludvika, May 2018
v
Content
1 Introduction ... 1 1.1 Purpose ... 1 1.2 Objectives ... 1 2 Background ... 2 2.1 Power Quality ... 22.2 Power Quality at Hospitals ... 2
2.3 Power supply at Hospitals ... 2
2.4 Falu Hospital ... 3
2.5 EIFS 2013:1 ... 3
3 Theory ... 4
3.1 Supply Voltage Variations ... 4
3.2 Voltage Dip ... 4
3.3 Voltage Swell ... 5
3.4 Rapid Voltage Change ... 5
3.5 Voltage Unbalance ... 6
3.6 Harmonics ... 6
3.6.1 Origin of Harmonics ... 7
3.6.2 Impact from Harmonics ... 8
3.6.3 Mitigation of Harmonics ... 8
3.6.4 Restrictions ... 8
3.7 Power ... 9
3.7.1 Power Factor ... 9
3.7.2 Reactive Power Regulation ... 11
3.7.3 Restrictions ... 11 4 Method... 12 4.1 Limitations... 12 4.2 Measurement ... 12 4.3 Analysis ... 13 5 Results ... 15 5.1 Voltage ... 15 5.1.1 Receiving Station M2 ... 16
5.1.2 X-ray Units, Substation T15A ... 17
5.1.3 Same Location as the Former Power Quality Analysis, Transformer T9 ... 17
5.2 Voltage Dips and Swells ... 18
5.3 Rapid Voltage Change ... 18
vi
5.3.2 X-ray Units, Substation T15A ... 19
5.3.3 Same Location as the Former Power Quality Analysis, Transformer T9 ... 19
5.4 Voltage Unbalance ... 20
5.4.1 Receiving Station M2 ... 20
5.4.2 X-ray Units, Substation T15A ... 21
5.4.3 Same Location as the Former Power Quality Analysis, Transformer T9 ... 21
5.5 THD ... 22
5.5.1 Receiving Station M2 ... 22
5.5.2 X-ray Units, Substation T15A ... 23
5.5.3 Same Location as the Former Power Quality Analysis, Transformer T9 ... 23
5.6 Individual Harmonics ... 24
5.6.1 Receiving Station M2 ... 24
5.6.2 X-ray Units, Substation T15A ... 25
5.6.3 Same Location as the Former Power Quality Analysis, Transformer T9 ... 26
5.7 Power ... 27
5.7.1 Receiving Station M2 ... 27
5.7.2 X-ray Units, Substation T15A ... 28
5.7.3 Same Location as the Former Power Quality Analysis, Transformer T9 ... 28
5.8 Power Factor ... 29
5.8.1 Receiving Station M2 ... 29
5.8.2 X-ray Units, Substation T15A ... 30
5.8.3 Same Location as the Former Power Quality Analysis, Transformer T9 ... 30
5.9 Phase Angle ... 31
5.9.1 Receiving Station M2 ... 31
5.9.2 X-ray Units, Substation T15A ... 32
5.9.3 Same Location as the Former Power Quality Analysis, Transformer T9 ... 32
6 Analysis ... 33
6.1 Voltage ... 33
6.2 Rapid Voltage Change ... 33
6.3 Voltage Unbalance ... 34
6.4 Harmonics ... 34
6.5 Power ... 34
6.6 Phase Angle and Power Factor ... 35
6.7 Further Studies ... 36
7 Conclusion ... 37
8 References ... 38
1
1 Introduction
In modern society we are used to having access to electricity and most of the ordinary things in life involves electricity in some way. In this sense a long duration power cut would affect us very hard. In Sweden we have a high reliability of the power supply, we expect to always have power in the outlets. We also assume that the electricity that we receive are in the right voltage level and frequency, and just for us to use. We are in other words used to good power quality. It may not be something that the ordinary citizen is aware of, but power quality is of great importance for electricity users.
The power quality is dependent on both the production of the power as well as the connected loads. The production and consumption must match in order to keep the frequency stable and prevent power cuts. Changes to a more sustainable energy system, such as more intermittent power production, can affect the quality of the electricity that we use in the sense that it is harder to maintain a stable frequency on the power grid when there is less inertia in the system. Furthermore, it is of importance for the connected loads that the delivered power has a certain shape, size and frequency. Ideally it is a pure sine wave, and variations from that can cause disturbances in the loads´ functionality. At the same time loads can distort the performance of the electricity and cause reduced power quality.
Some electricity users are more dependent on good power quality than others. One example of this is hospitals, it is of great importance that a hospital can proceed with their daily operations at all times. It can be a matter of life and death if apparatus at the hospital does not work or if the light and certain facilities goes out. Dalarnas county´s largest hospital is located in Falun. The hospital contains a large variety of medical care and is the emergency unit for some of the county´s regions. The power quality here may be an issue if it is unsatisfactory and this is what is investigated in this project.
The project is performed on behalf of ABB. They have a broad catalog with different solutions for a range of power quality problems. For example, they can provide capacitor banks and reactors for reactive power compensation and filters for reducing harmonics, which all are issues related to power quality.
1.1 Purpose
The purpose of this project is to investigate the power quality at a hospital, to find discrepancies from present standards that could cause problems for the daily operations and the facilities.
1.2 Objectives
The objective of this project is to map the power quality at the hospital in Falun. This can be done by answering the following questions:
• Are there disturbances in the quality of the power, according to the standard EIFS 2013:1 and the grid owner´s regulation?
• What can cause power quality issues?
2
2 Background
2.1 Power Quality
Power quality can refer to many things, but one meaning is that the electricity transmission should be reliable without unannounced interruptions of the power supply and without disturbances of the waveform. Ideally the transmitted voltage should be sinusoidal with fixed amplitude and frequency [1]. In reality there are variations of the shape and amplitude of the voltage due to connected loads and external disturbances. Loads can for example be unbalanced and draw non-sinusoidal currents and an external interference could come from a lightning strike [2].
Variations of the voltage, so that it differs from nominal values can affect both the grid and the connected loads. Disturbances due to lacking power quality can occur where they are produced but also travel within the power system. Making power quality an important issue if there are loads sensitive for disturbances in the supply voltage connected to the power system [2].
If there is too much reactive power in the power grid, less active power can be transmitted [1]. This can result in higher power consumption and be both expensive and harmful to the environment, depending on the source of the power production. Many companies have objectives for a sustainable and efficient energy use. To maintain these goals it is of interest to have a good power quality, so that an excess of power is not bought.
If the power quality is unsatisfactory it can cause equipment to function poorly or even system failure. Electrical apparatus is constructed to operate at certain rated conditions and if the power deviates from this, there can be consequences of the performance of the device. The concept of power quality ensures that connected units operate satisfyingly, without malfunctions or shut downs. To ensure the quality there are restrictions for how much the voltage can differ from the ideal case. Some restraints for the parameters that can affect the quality are presented in the statute EIFS 2013:1 and in addition to that regulation, the grid operator can have restraints. Both distributors as well as consumers of the electricity are responsible for maintaining a good power quality [2].
2.2 Power Quality at Hospitals
In hospitals there are a number of advanced electrical medical apparatus and voltages that differ from the rated conditions can cause them to fail. Since the machines are used in healthcare their performance can be crucial for patients’ wellbeing. A good power quality is therefore important for the safety and ability to provide respectable medical care. Besides failures of the devices there can be unnecessary costs for maintenance, new purchases and excessive power consumption if the quality of the power is poor [3].
Medical devises can be equipped with microprocessors and switched DC power supplies which makes them sensitive to poor power quality. Other medical devices, such as X-ray machines, computed tomography (CT) scanners and magnetic resonance imaging (MRI) scanners can cause harmonics or transients that have a negative impact on the power quality [4].
2.3 Power supply at Hospitals
Hospitals have reserve power systems in case of power grid failures. The reserve power is an external power source, usually a diesel generator, which should be able to cover the total power output for one week [5]. Loads at the hospital are categorized according to what kind of power supply they need.
3
Essential loads require reserve power in an event of power failure, these are loads that needs to be run for health or safety reasons. As an addition to that some loads, called critical loads, are provided with an uninterruptable power supply (UPS) system to ensure that they never are without power [6]. The UPS system are connected to loads such as computers and servers that can cause data losses in a power failure. These loads can also be continuously fed from the UPS to ensure that the power is of good quality. Loads connected to a UPS can also be of that character that they are essential for health care and does not tolerate a power cut, for example certain devises in surgery or emergency units [5]. Normally the UPS system consists of batteries and are dimensioned to be able to provide power for half an hour at full load [5]. Both essential and critical loads are fed by so called prioritized power. In addition to that, there are non-essential loads fed by normal power, which means that they do not have access to reserve power and in case of a power failure they have no power supply [6].
2.4 Falu Hospital
Falu hospital have had two power quality measurements done before. The first one was performed in 2002 when they suspected voltage unbalance and the measurement was done at the incoming power to prioritized power from transformer T9. Measurements were performed during 24 hours in May that year. The analysis of the power showed that the voltage unbalance was well within the limits for what was considered allowed. It was found that the voltage from the transformer was too low and it was recommended to be increased. Most of the values for the voltage were between 225 and 230 V, and the recommendation was that the voltage should be around 235 V. Another finding was that during the evening the fifth harmonic exceeded the specified limit. The reason for this disturbance in the power was said to be from loads such as television set, computers and CD players that were used during the evening. It was said that it was hard to see if the high values for the fifth harmonic caused any problems and that the levels should be supervised. It was also recommended to establish a plan for the power quality at the hospital [7]. The results from this power quality measurement are attached as an appendix. The second power quality measurement were performed in 2008 when they had problems with tripping switches. The problem started after a thunder storm and they suspected that there were over voltages in the system that had damaged equipment associated to the switches. The analysis did not show any over currents in the event of when the switches tripped. The switches were replaced after the analysis [8]. At the hospital in Falun they are aware of the concept of power quality but they do not have any extra equipment, such as capacitor banks or harmonic filters, to improve the performance of the power [9].
2.5 EIFS 2013:1
The Swedish electricity act declares that the transmission of power should be of good quality [10]. To ensure this the Swedish Energy Markets Inspectorate have provided guidelines for what is a good power quality and they are presented in the statute EIFS 2013:1.
In EIFS 2013:1 there are restrictions for what voltage variations that are acceptable to maintain good power quality. The restrictions are valid for data from at least one weeks measuring and in accordance with the standard for electromagnetic compatibility, SS-EN 61000- 4-301, measurement class A. Many of the limits are for a mean value over ten minutes and some of the guidelines in EIFS 2013:1 are set as deviations from a reference voltage and in these cases, it is the nominal voltage for the power supply that is used as reference [11].
4
3 Theory
3.1 Supply Voltage Variations
The levels for the supplying voltage should not deviate too much from the nominal value. According to EIFS 2013:1 the mean ten-minute rms value of the voltage should be within the range 90 % to 110 % of the reference voltage, all the time [11].
3.2 Voltage Dip
Dips are when the rms value of the voltage is decreased under 90 % of the reference voltage during a short period of time. This can occur when heavy loads are energized or when large induction motors are starting [2]. This is mainly a problem if the grid is weak, and thereby reacts to changes in the load situation [12]. It can also be because of line-to-ground faults, when loads are relocated between power sources or when a load varies in reactive power demand [2]. If a power line is struck by lightning, the insulation can temporarily be weakened, and this can be a source for voltage dip. Also damages on cables due to external circumstances can cause this voltage variation [12].
Voltage dips can cause interruption in the power supply and for equipment that operates at low voltages, dips are the main reason for malfunctions [2, 12]. Computer systems and control equipment are apparatus that can be sensitive for decreases in the voltage [13].
The load can be fed from a battery or an uninterruptible power supply (UPS) to lower the impact from voltage dips [2]. If the origin for voltage dips are due to varying reactive power demand, they can be fixed by controlled reactive power compensation by capacitors. Also, dynamic voltage regulation (DVR) can be used to prevent dips [12].
EIFS 2013:1 says that there should be no voltage level and durability as in section C in Table 1. If the voltage dips have the characteristics as shown in section B, the network operator is obliged to make arrangements to improve the performance of the voltage, as long as the measures are reasonable in comparison to the inconvenience for the electricity users [11].
Table 1. Duration and voltage levels for voltage dips. Valid for voltage references up to and including 45 kV [11].
U [%] Duration [ms] 10 ≤ t ≤ 200 200 < t ≤ 500 500 < t ≤ 1000 1000 < t ≤ 5000 5000 < t ≤ 60000 90 > u ≥ 80 A B 80 > u ≥ 70 70 > u ≥ 40 C 40 > u ≥ 5 5 > u
5
3.3 Voltage Swell
If the rms value of the voltage increases over 110 % of the reference during a short period of time, it is called a swell. This is rarer than a voltage dip and the main reason for a swell is that a large load is disconnected. It can also be due to connection of a capacitor bank, disconnection of a reactor or a single line-to-ground fault [2, 12]
In the same way power conditioners, UPS systems and batteries can be used to prevent dips, they can also be used to prevent swells [2]. Another way to avoid voltage swells is to equip the transformers with a tap changer [12].
EIFS 2013:1 says that there should be no voltage level and durability as in section C in Table 2. If the voltage swells have the characteristics as shown in section B, the network operator is obliged to make arrangements to improve the performance of the voltage, as long as the measures are reasonable in comparison to the inconvenience for the electricity users [11].
Table 2. Duration and voltage levels for voltage swells. Valid for voltage references up to and including 1 000 V [11].
U [%] Duration [ms] 10 ≤ t ≤200 200 ≤ t ≤ 5 000 5 000 ≤ t ≤ 60 000 u ≥ 135 C 135 > u ≥ 115 B 115 > u ≥ 111 A 111 > u ≥ 110
3.4 Rapid Voltage Change
Rapid voltage changes are both decreases and increases in the rms value of the voltage that are faster than 0.5 % per second. The difference from voltage swells and dips are that they are not exceeding a limit of 90 % to 110 % of the reference voltage. It is changes between two steady state conditions that are within the limit for what is considered allowed, the restriction is that the variations cannot be too many [11].
The main problem with rapid voltage changes, is that it can cause flickering lights [14]. Besides that, motors can react with breaking or accelerating moments or there can appear disturbances in control systems acting on the voltage angle. There can also be disturbances in electronic devices such as computers, printers, monitoring equipment and telecommunication equipment because of fluctuations in the supply voltage [15].
The variations of the voltage can occur when loads or capacitor banks are switched on or off, during start-up of motors or when a transformer uses a tap-changer. The rapid voltage changes can also occur due to varying output of the power production, which can happen for intermittent energy sources [14]. According to EIFS 2013:1 the number of rapid voltage changes added with the number of short-term voltage dips that correspond with section A in Table 1 should not exceed the values presented in Table 3. In the table, ∆Ustationary refer to the difference of the rms value before and after the change and ∆Umax
is the largest change in voltage during the event of the rapid voltage change [11]. See Figure 1 for a visualization of ∆Ustationary and ∆Umax.
6
Figure 1. Visualization of the characteristics for a rapid voltage change, where ∆Umax is the larger, dashed interval and
∆Ustationary is the upper, dashed interval.
Table 3. Tolerable values for rapid voltage changes, for maximal nominal voltage levels of 45 kV [11].
Short-duration voltage variation Maximum number per day ∆Ustationary ≥ 3 % 24
∆Umax ≥ 5 % 24
3.5 Voltage Unbalance
Voltage unbalance is when there are variations in amplitude or in phase shift between the phases in a three-phase system [2]. Reasons for voltage unbalance can be unbalanced loads or not correctly transposed power lines [12]. It can also be because a fuse in one of the phases of a capacitor bank is blown [2]. Unbalanced voltages can cause AC-machines to be overloaded or cause frequency converters to create harmonics at non-characteristic frequencies or even stop working [13].
The unbalance is measured by taking the ratio between the negative phase sequence component and the positive phase sequence component and according to EIFS 2013:1 the mean ten-minute rms values for voltage unbalance should not exceed 2 % [11, 17].
3.6 Harmonics
In Sweden the power system´s fundamental frequency is 50 Hz. In a non-ideal case, waveforms with frequencies that differ from the fundamental frequency exists and they are called Harmonics. Usually the harmonics are integer multiples of the fundamental frequency and harmonics can refer both to
ΔUstationary
ΔUmax
7
currents and voltages [2]. For instance, the third harmonic is a wave with a frequency of 150 Hz in a power system with a fundamental frequency of 50 Hz.
Periodic non-sinusoidal waveforms can be described by Fourier series. In Fourier analysis the waveform is separated into the different frequencies that it consists of [2]. A Fourier series defining voltage harmonics can be as follows, where the terms in the series are the harmonic components
𝑢(𝑡) = 𝑈𝐷𝐶+ ∑ (𝑈̂𝑛,cos 𝑛𝜔𝑡 + 𝛼𝑛) [𝑉] ∞
𝑛=1 (1)
where
𝑛 = Harmonic order
𝑈𝐷𝐶 = DC component of the voltage
𝑈̂ = Amplitude of the voltage
𝜔 = 2𝜋𝑓 = Angular frequency for the fundamental 𝛼 = phase angle
[2].
In addition to individual harmonics, the total harmonic distortion (THD) is the ratio of the sum of all harmonics and the fundamental frequency. This measures the total share of harmonics in the system. The THD for voltages can be calculated as
𝑇𝐻𝐷𝑈= √∑∞ 𝑈𝑛,𝑟𝑚𝑠2 𝑛=2 𝑈1,𝑟𝑚𝑠 ∙ 100 [%] (2) where 𝑛 = Harmonic order 𝑈𝑟𝑚𝑠 = Voltage rms value [13].
3.6.1 Origin of Harmonics
Harmonics can arise in the electric power system for different reasons but usually they are due to nonlinear loads, i.e. the current does not follow the supplying voltage’s wave form. These current distortions affect the voltage and causes voltage harmonics [13]. Further, the sources of harmonics can be divided into single- or three-phased loads, where single-phase loads generally create multiples of the third harmonic and three-phase loads creates harmonics of order five, seven, eleven and so on, or in other words odd non-multiples of three [18]. It is more common with presence of odd harmonics than ones of an even number. Equipment should normally not generate even harmonics, although they can be created by large converters [19].
Loads that can cause harmonics are power electronic equipment such as rectifiers, power inverters and converters, frequency converters and motor drives [2]. Devices that contain electronics like this, for example UPS systems and pumps, are usually three-phase loads and can therefore be sources of
8
harmonics of that characteristics. Harmonics can also originate from residential loads such as computers, fluorescent lamps and low energy lamps, which commonly are single-phased and can contain switch-mode power supplies or thyristors [2]. If there are capacitor banks in the power system, they can amplify the content of harmonics [1].
3.6.2 Impact from Harmonics
If there are too many harmonics in the power supply, they can cause a number of different disturbances for the connected loads. For instance, it can make control devices and medical equipment to malfunction, create disturbances in electronic devices and computers and create break downs in capacitor banks [13, 19]. They can also create additional losses in capacitors and transformers, create additional noise from apparatus and interfere telephones [2]. If there are harmonics of third order present in the power system, they can create large currents in neutral conductors and cause overheating [13].
3.6.3 Mitigation of Harmonics
Dependent on what kind of harmonics there are in the power system, different solutions for regulating and lowering the harmonics can be used. One way is to install passive, active or hybrid filters [2]. Filters can consist of capacitors, reactors and resistors and they can be adjusted to any orders of harmonics that needs to be lowered. The waveforms are improved by reducing currents of higher frequencies. Active filters are adjustable, while passive filters constantly operate at the same conditions. Filters can not only reduce the harmonics in the power grid, they can also decrease the consumption of reactive power [12]. Other solutions can be applications of high pulse rectification, customized power arrangements such as different types of conditioners or disconnection of capacitor banks [2, 12]. If the harmonics are creating large currents in the neutral conductor, the area of that conductor can be increased to avoid overload. Another way to deal with harmonics can be to separate devices that creates harmonics from devices that gets disturbed by harmonics [13].
3.6.4 Restrictions
For reference voltages up to and including 36 kV, the ten-minute mean rms value for every individual harmonic should not exceed the values in Table 4. The THD shall be at most 8 % [11].
Table 4. Allowed values for individual harmonics for reference voltages up to and including 36 kV [11].
Odd harmonics Even harmonics Non multiples of 3 Multiples of 3
Harmonic [n] Relative amplitude [%] Harmonic [n] Relative amplitude [%] Harmonic [n] Relative amplitude [%] 5 6,0 3 5,0 2 2,0 7 5,0 9 1,5 4 1,0 11 3,5 15 0,5 6 to 24 0,5 13 3,0 21 0,5 17 2,0 19, 23, 25 1,5
9
3.7 Power
The total amount of power in a transmission system can be divided into active and reactive power. It is the active power that can perform work and is useful for loads, and therefore wanted in the lines. Reactive power on the other hand does not perform a work at the load and it is only necessary in certain applications, such as when motors are magnetized [20]. Reactive power appears when the current and the voltage are shifted in phase, so that the current leads or lags the voltage. A positive phase angle, 𝜑, i.e. the current leads the voltage occur when the load is capacitive and vice versa a negative phase angle, 𝜑, is when the current lags the voltage and this is due to an inductive load [1, 20]. A capacitive load is such as it produces reactive power, but most loads are of inductive nature, i.e. consumes reactive power. [20]. See Figure 2 for a visualization of leading and lagging current.
Figure 2. Phasor diagram showing the current, I, voltage, U and phase angle, φ. (a) The current is leading the voltage. (b) The current is lagging the voltage.
3.7.1 Power Factor
The cosine of the angle between the voltage and the current, the phase angle 𝜑, is the power factor. The power factor is a measure of the displacement in phase for the voltage and current. The power factor can also be used while describing power, since the same angle are defining the relations between the complex, active and reactive power. In hospitals the power factor can be around 0.75 to 0.9 in general [21].
Equation 3 to 6 shows the powers expressed in terms of the phase angle and Figure 3 shows the relations between the powers and the phase angle
𝑃𝜙= |𝑈𝐿𝑁| ∙ |𝐼| ∙ cos 𝜑 [𝑊] (3) 𝑄𝜙 = |𝑈𝐿𝑁| ∙ |𝐼| ∙ sin 𝜑 [𝑣𝑎𝑟] (4) 𝑆𝜙 = 𝑈 ∙ 𝐼∗= 𝑃 + 𝑗𝑄 [𝑉𝐴] (5) |𝑆| = √𝑃2+ 𝑄2 (6) I (a) (b) φ φ Im Im Re Re U U I
10 where
𝑃𝜙= Active power in one phase
𝑄𝜙 = Reactive power in one phase
𝑆𝜙 = Complex power in one phase
|𝑆| = Apparent power
𝑈𝐿𝑁 = Line-to-neutral voltage
𝜑 = Phase angle
𝑈 = Voltage in phasor form
𝐼∗ = Complex conjugate of the current
[1].
Figure 3. Power triangle.
If Figure 2 and Figure 3 are studied, it can be seen that if the current and voltage are totally in phase the power factor is one and there is no reactive power in the system.
The power factor can also be expressed in terms of active and apparent power, more specifically as the ratio between useful and total power. In this way the power factor becomes a measure of the share of active power in the system, and by that a measure of how efficient the power transmission is. If there is only active power present, the apparent and the active power have the same value and the power factor becomes one. This can be seen if Equation 7 and Figure 3 are studied. Therefore, improving the power factor is one way to reduce the losses in the power system.
𝑃𝑜𝑤𝑒𝑟 𝐹𝑎𝑐𝑡𝑜𝑟 = cos 𝜑 = 𝑃
|𝑆| (7)
[1]
Where the last term can be extended to include the harmonic content, by using the power contribution from all present frequencies [18].
Reactive power, 𝑄 Apparent power, |𝑆| Active power, 𝑃 φ Im Re
11
3.7.2 Reactive Power Regulation
One problem with reactive power is, when transferred in the power system it reduces the capacity for active power transmission in the lines [20]. Another issue is that at a certain active power output and fixed voltage it can be understood from Equation 3 that the amplitude of the current increase at decreasing power factors. Currents causes ohmic losses and it is desirable to keep the currents as low as possible, it is therefore also desirable to keep the power factor as close to one as possible [1].
To reduce the losses caused by reactive power transmission or, a poor power factor, it is desirable to create the reactive power where it is to be used. This can be done by installing a capacitor bank that produces reactive power or, reactors can be installed to consume reactive power [1].
3.7.3 Restrictions
Falu energi och vatten operates the grid where Falu hospital is connected. They have regulations for
reactive power output and it is allowed to take 50 % of the subscribed power as reactive power. If there is more reactive power drawn from the grid there will be a fee of 11 kr/kvar for the excess power consumption. If more active is power taken than what the subscription is for, there is a fee of 136 kr/kW for the excess power consumption [22]. Falu hospital have a power subscription of 3 652 kW at Falu
12
4 Method
4.1 Limitations
This project focused on the quality of the voltage, and the parameters that were measured and analyzed were supply voltage variations, voltage dips, voltage swells, rapid voltage changes, voltage unbalance and voltage harmonics. All these parameters are restricted in the statute EIFS 2013:1 which was used as a reference for good power quality. Active and reactive power were also a part of the study and limiting values for these were provided by the grid operator.
There are other restrictions for what is considered good power quality but EIFS 2013:1 was chosen. That statute resembles the European standard EN 50160 Voltage characteristics of electricity supplied
by public electricity networks but has variations and additional restrictions. EIFS is recommended by
the Swedish Energy Markets Inspectorate and can be considered the Swedish standard. Since this is a study in Sweden, it seemed reasonable to use these restrictions as reference for good power quality. EIFS 2013:1 are focusing on voltage variations and therefore this study also focuses on those parameters. An analysis of the power is added, since consumption and production of reactive power can have an impact on the performance of the power grid.
4.2 Measurement
The measurements were performed with the portable instrument Unilyzer 900. The instrument is designed for power quality measurements and measure current and voltage and can from that calculate power quality parameters such as voltage dips and swells, harmonics, flicker, unbalance and transients [24]. The instrument samples 256 points per cycle, and for a 50 Hz power system there are 50 cycles per second [25]. The instrument has access to a back-up battery for half an hour, so measurement data will not be lost in case of minor power failures [25]. The instrument is classified by the standard IEC 61000-4-30 class A, defining how measurements and analysis of power quality should be done [24]. This ensure that the measurements are performed with high reliability and measuring accuracy.
Information about the facility and the power system was received from the electricity managers at the county council’s property management and the hospital. This information together with the results from the literature study and conversations with representatives at the hospital were used to determine where to perform the measurement study.
Both the current and the voltage were measured at three different locations in the power system of Falu hospital. One measuring point was at station M2 in measuring cubicle H202, which receive power from the supplying grid. The purpose of this measurement was to get an overall picture of the performance of the electricity in the hospital. Since disturbances in the power can come from machines that do X-ray, CT and MRI, a measurement was done on substation T15A which supply power to a department accommodating that kind of devices. In addition to that, a measurement was done at the same place as the power quality analysis in 2002 at substation M1VA, transformer T9. This substation is feeding prioritized power to the emergency unit, operating rooms and intensive-care unit.
All currents were measured on the secondary side of a current transformer, with current clamps around a conductor. The voltage at station M2 was measured on the secondary side of a voltage transformer with banana connectors. The two other voltages were measured direct from the lines, at T15A with vampire clips and at T9 with an adapter to metering fuses. Specifications for all measuring points are shown in Table 5. The measuring equipment was collected one week after the set up.
13
Some limits for what is considered reasonable to maintain good power quality are set as deviations from a reference value, often the nominal phase voltage, and these values were implemented in the instrument. The reference voltage for substation T15A and transformer T9 were set to 240 V since this is the intended phase voltage. The line voltage at the receiving station should be 11 kV and the phase voltage that is used as reference voltage should then be 6.35 kV. In reality the line voltage was a bit lower than 11 kV and the measuring instrument was set to sliding voltage reference level. This means that the meter itself adjust the reference value according to the magnitude of the incoming line voltage.
Configurations for the windings were also a part of the set up for the measuring instrument and all windings were wye-connected phases with an additional neutral conductor. According to EIFS 2013:1 the voltage characteristics for references over 1 000 V are determined with line-to-line voltages and for references under and including 1 000 V the line-to-neutral voltage is used. This was implemented in the instrument so that calculations were done at those premises.
The waveforms for the currents and voltages were registered by the instrument and from that, values for the different power quality parameters were calculated by it. Data was saved at an internal memory every ten minutes as a mean of that time period but also the maximum and minimum values for that period were saved. The instrument was set up to record all events that were over or under a limit of 10 % from the reference voltage. This was so that events of sags or swells could be detected from the data and in the same way levels exceeding a limit of 40 % from the reference were recorded to identify transients. To detect flicker, the nominal value for power output in outlets were set to 230 V in the instrument. Also, all the specifications in Table 5 were implemented in the measuring instrument together with the winding and trig configurations.
Table 5. Specifications for measuring points.
M2
T15A
T9
Frequency [Hz]
50 50 50Voltage transformer ratio [V]
11 000:110 ‒ ‒Reference voltage [V]
6 350, sliding 240 240Current transformer ratio [A]
300:5 2 500:5 2500:54.3 Analysis
The analysis of the obtained data was done using the software PQSecure. The software is developed to analyze data in a power quality aspect and it is provided by the same manufacturer as the measuring instrument. The measurement data can be visualized in graphs based on different parameters and it contains functions to show voltage variations, harmonics, THD and much more.
After the data was implemented in PQSecure all values were exported to Matlab where they were processed and visualized in graphs. Almost all data sets started with values that deviated from the rest and these values were considered non-representative and were ignored in the analysis.
The results from the voltage measurements were compared with the regulations in EIFS 2103:1 to determine if the quality of the power was good. The power was compared with Falu energi och vattens restrictions for reactive power consumption. Both the maximum or minimum value as well as the mean
14
value for every ten-minute period were compared with the permitted levels for each power quality criteria, to ensure that no values were exceeding the limits.
Additional processing and calculations to the values from PQSecure were:
• To get the voltage unbalance, the negative phase sequence was divided with the positive phase sequence. All these parameters were presented in PQSecure but the results from T15A was not accurate. In this measurement the negative and positive phase sequences had been shifted, and for this reason the unbalance was calculated in Matlab instead of using the given values. • In PQSecure, values for harmonics were plotted over time, these values were used in the analysis
to show time-dependent pattern for the harmonics. In addition to that a mean value for each order of harmonic at each phase were calculated and plotted to visualize the distribution between the different orders.
• The power factor was obtained from the analysis program, calculated from equation 7, by taking the active power divided by the apparent power. For the measurements at the receiving station the values for the power factor from PQSecure were inaccurate and they were recalculated by taking the cosine of the phase angle.
15
5 Results
The relevant results from the measured power quality parameters are presented here. Each chapter contains results from all measuring points: the receiving station (M2), the unit accommodating x-ray units (T15A) and the location for the former power quality analysis in 2002 (T9).
5.1 Voltage
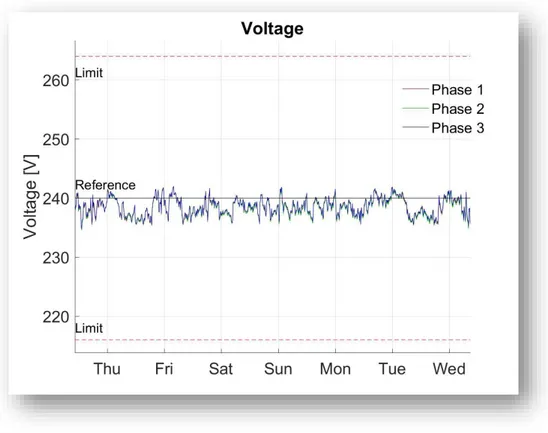
Maximum, minimum and mean values for the voltage were the highest respectively the lowest values are highlighted are presented in Table 6 and Table 7. The ten-minute mean values for the voltages are plotted over time in Figure 4, Figure 5 and Figure 6. For receiving station M2 the mean difference in voltage levels between the phases are presented in Table 8.
Table 6. Maximum, minimum and mean values for the voltages, were the highest respectively the lowest values are highlighted. The column limit/reference shows the limits and reference voltages for supply voltage variations according to EIFS 2013:1.
Limit/
reference
M2
Phase 1 Phase 2 Phase 3Max [V]
6 600 6 145 6 138 6 082Min [V]
5 400 5 789 5 816 5 764Mean [V]
6 000 5 983 5 977 5 922Table 7. Maximum, minimum and mean values for the voltages, were the highest respectively the lowest values are highlighted. The column limit/reference shows the limits and reference voltages for supply voltage variations according to EIFS 2013:1.
Limit/
reference
T15A
T9
Phase 1 Phase 2 Phase 3 Phase 1 Phase 2 Phase 3
Max [V]
264 245 245 245 245 245 246Min [V]
216 231 232 232 232 233 233Mean [V]
240 238 238 239 239 239 23916
5.1.1 Receiving Station M2
Table 8. Mean differences in voltage level between the phases for receiving station M2.
Phase 1-2 Phase 1-3 Phase 2-3
Mean difference between phases [V]
6.6 62 55Figure 4. Voltage at receiving station M2 in ten-minute mean rms values. The black line called reference is the nominal voltage and the dotted red lines are the limits for supply voltage variations according to EIFS 2013:1.
17
5.1.2 X-ray Units, Substation T15A
Figure 5. Voltage at substation T15A in ten-minute mean rms values. The black line called reference is the nominal voltage and the dotted red lines are the limits for supply voltage variations according to EIFS 2013:1.
5.1.3 Same Location as the Former Power Quality Analysis, Transformer T9
Figure 6. Voltage at transformer T9 in ten-minute mean rms values. The black line called reference is the nominal voltage and the dotted red lines are the limits for supply voltage variations according to EIFS 2013:1.
18
5.2 Voltage Dips and Swells
No dips or swells were detected at any of the measuring points during the period for the measurement.
5.3 Rapid Voltage Change
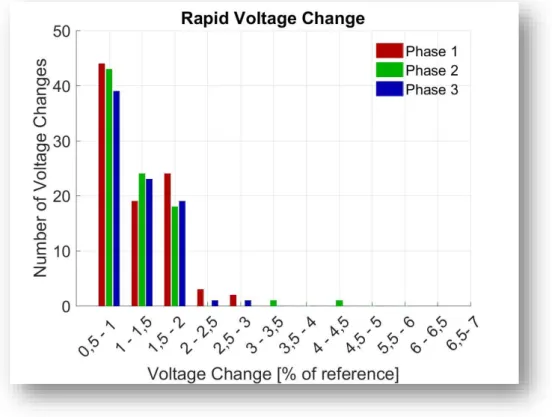
All Umax values for the entire measuring period are presented as bar charts in Figure 7, Figure 8 and
Figure 9.
5.3.1 Receiving Station M2
Figure 7. Number of rapid voltage changes at receiving station M2. The voltage changes shown are those called ΔUmax
19
5.3.2 X-ray Units, Substation T15A
Figure 8. Number of rapid voltage changes at substation T15A. The voltage changes shown are those called ΔUmax according
to EIFS 2013:1 and they are sorted by change in voltage level as percent of the nominal value for the voltage.
5.3.3 Same Location as the Former Power Quality Analysis, Transformer T9
Figure 9. Number of rapid voltage changes at transformer T9. The voltage changes shown are those called ΔUmax according
20
5.4 Voltage Unbalance
Ten-minute mean values for voltage unbalance levels plotted over time are presented in Figure 10, Figure 11 and Figure 12. Maximum and mean values are presented in Table 9.
Table 9. Maximum and mean values for voltage unbalances. The column limit shows the limit for voltage unbalance according to EIFS 2013:1.
Limit M2
T15A T9
Max [%]
2 0.13 0.17 0.22Mean [%]
0.066 0.11 0.145.4.1 Receiving Station M2
Figure 10. Voltage unbalance at receiving station M2, showing the deviation from a balanced three-phase system in percent. The dotted red line is the limit for voltage unbalance according to EIFS 2013:1.
21
5.4.2 X-ray Units, Substation T15A
Figure 11. Voltage unbalance at substation T15A, showing the deviation from a balanced three-phase system in percent. The dotted red line is the limit for voltage unbalance according to EIFS 2013:1.
5.4.3 Same Location as the Former Power Quality Analysis, Transformer T9
Figure 12. Voltage unbalance at transformer T9, showing the deviation from a balanced three-phase system in percent. The dotted red line is the limit for voltage unbalance according to EIFS 2013:1.
22
5.5 THD
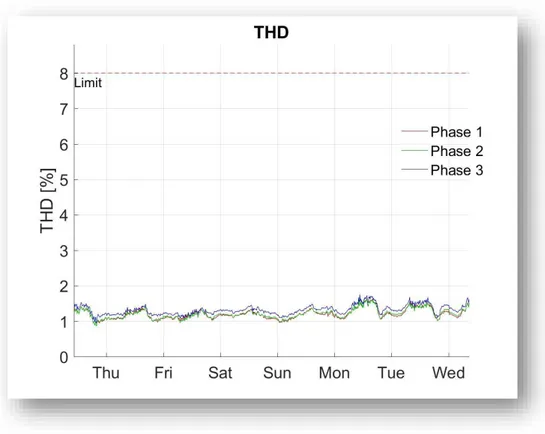
Ten-minute mean values for THD are plotted over time in Figure 13, Figure 14 and Figure 15. Maximum and mean values are presented in Table 10, were the highest values are highlighted.
Table 10. Maximum and mean values for THD, were the highest values are highlighted. The column limit shows the limit for THD according to EIFS 2013:1.
Limit M2
T15A
T9
Phase 1 Phase 2 Phase 3 Phase 1 Phase 2 Phase 3 Phase 1 Phase 2 Phase 3Max [%]
8 2.0 1.9 2.6 2.6 2.5 2.6 2.1 2.0 2.7Mean [%]
1.2 1.1 1.1 1.2 1.2 1.3 1.3 1.3 1.45.5.1 Receiving Station M2
23
5.5.2 X-ray Units, Substation T15A
Figure 14. THD in percent at substation T15A. The dotted red line is the limit for THD according to EIFS 2013:1.
5.5.3 Same Location as the Former Power Quality Analysis, Transformer T9
24
5.6 Individual Harmonics
Graphs of the individual harmonics as a mean of the three phases are plotted over time in Figure 16, Figure 19 and Figure 22. The mean harmonic content for individual harmonics of order 2 to 25 are shown as bar charts in Figure 17, Figure 18, Figure 20, Figure 21, Figure 23 and Figure 24.
5.6.1 Receiving Station M2
Figure 16. Harmonic content over time at receiving station M2. Showing odd harmonic voltages of order 3 to 13 in percent of the fundamental voltage.
Figure 18. Content of even harmonics at receiving station M2. Showing a mean value for each phase in percent of the fundamental voltage.
Figure 17. Content of odd harmonics at receiving stationM2. Showing a mean value for each phase in percent of the fundamental voltage.
25
5.6.2 X-ray Units, Substation T15A
Figure 19. Harmonic content over time at substation T15A. Showing odd harmonic voltages of order 3 to 13 in percent of the fundamental voltage.
Figure 20. Content of odd harmonics at substation T15A. Showing a mean value for each phase in percent of the fundamental voltage.
Figure 21. Content of even harmonics at substation T15A. Showing a mean value for each phase in percent of the fundamental voltage.
26
5.6.3 Same Location as the Former Power Quality Analysis, Transformer T9
Figure 22. Harmonic content over time at transformer T9. Showing odd harmonic voltages of order 3 to 13 in percent of the fundamental voltage.
Figure 24. Content of even harmonics at transformer T9. Showing a mean value for each phase in percent of the fundamental voltage.
Figure 23. Content of odd harmonics at transformer T9. Showing a mean value for each phase in percent of the fundamental voltage
27
5.7 Power
Graphs with ten-minute mean values for the apparent, active and reactive powers are plotted over time in Figure 25, Figure 26 and Figure 27.
5.7.1 Receiving Station M2
Figure 25. Apparent power, S, in MVA, Active power, P, in MW and reactive power, Q, in Mvar at receiving station M2 plotted over time. The black line is the subscribed power and the dotted red line are the limit for reactive power consumption without any excess fee.
28
5.7.2 X-ray Units, Substation T15A
Figure 26. Apparent power, S, in kVA, Active power, P, in kW and reactive power, Q, in kvar at substation T15A plotted over time.
5.7.3 Same Location as the Former Power Quality Analysis, Transformer T9
Figure 27. Apparent power, S, in kVA, Active power, P, in kW and reactive power, Q, in kvar at transformer T9 plotted over time.
29
5.8 Power Factor
Ten-minute mean values for power factors plotted over time are presented in Figure 28, Figure 29 and Figure 30. Mean values for the power factor for receiving station M2 are presented in Table 11.
5.8.1 Receiving Station M2
Table 11. Mean values for the power factors at receiving station M2.
Phase 1 Phase 2 Phase 3
Average power factor
0.87 0.85 0.9630
5.8.2 X-ray Units, Substation T15A
Figure 29. Power factor, cos(φ), at substation T15A plotted over time.
5.8.3 Same Location as the Former Power Quality Analysis, Transformer T9
31
5.9 Phase Angle
Ten-minute mean values for phase shifts are plotted over time in Figure 31, Figure 32 and Figure 33.
5.9.1 Receiving Station M2
Figure 31. Phase shift at receiving station M2. The angle for the voltages are references and are represented by the straight lines in the graph. The corresponding line at each phase are the angle for the current, the difference between is the phase angle, φ.
32
5.9.2 X-ray Units, Substation T15A
Figure 32. Phase shift at substation T15A. The angle for the voltages are references and are represented by the straight lines in the graph. The corresponding line at each phase are the angle for the current, the difference between is the phase angle, φ.
5.9.3 Same Location as the Former Power Quality Analysis, Transformer T9
Figure 33. Phase shift at transformer T9. The angle for the voltages are references and are represented by the straight lines in the graph. The corresponding line at each phase are the angle for the current, the difference between is the phase angle, φ.
33
6 Analysis
Table 12. Summarizing evaluation of the investigated power quality parameters.
M2
T15A
T9
Supply voltage variations
Approved Approved ApprovedVoltage dip
Approved Approved ApprovedVoltage sag
Approved Approved ApprovedRapid voltage change
Approved Approved ApprovedVoltage unbalance
Approved Approved ApprovedHarmonics
Approved Approved ApprovedPower
Approved Approved Approved6.1 Voltage
All values for the three measurements are within the limits of 90 % to 110 % of the reference voltage, as can be seen in Figure 4, Figure 5 and Figure 6. This means that the voltage in the three measuring points fluctuates within reasonable limits and that there were no dips or swells. As there are no events of voltage dips or swells, there are no heavy loads and it seems like all cables are intact. The grid within the hospital can handle variations in load situations and maintain the voltage level.
As can be seen if Figure 4, Figure 5 and Figure 6 are compared, the largest differences in voltages between phases occur at M2 where the voltage level for phase three constantly is lower than the others. According to Table 8 the average difference between phase one and three is 62 V, which is not a large difference in percentage (around 1 % of phase one), but that phase voltage could be improved. At T15A and T9 the three phases are very similar in both size and shape.
The recommendation from the former analysis of substation T9 was that the voltage should be increased to around 235 V. If Figure 6 is examined, it can be seen that the voltage now is higher than it was at the previous measurement, then it was around 227 V and now it is around 239 V. The voltage has been increased since that measurement and agree well with the recommended voltage level.
The reference level for the voltage at receiving station M2 are 6 kV, which is lower than the 6.35 kV that it should be. This is expected since it was known that the line voltage there was lower than the rated voltage of 11 kV.
6.2 Rapid Voltage Change
The rapid voltage changes combined with voltage dips should not be more than 24 Umax and 24 Ustationary
per day. As can be seen in Figure 7, Figure 8 and Figure 9 there are no events of rapid voltage changes that have an Umax that exceed the limit of 5 % of the reference voltage. Since there are no rapid voltage
changes larger than permitted values and no detected voltage dips, the restrictions from EIFS 2013:1 are fulfilled.
34
There occur many voltage changes, but most of them are not larger than 2 % of the reference voltage. In the case of T9 there are 2 543 rapid voltage changes in one of the phases (Figure 9), which is an outstanding value since there are around 60 changes in the two other phases, and for the other measuring points the numbers are also in that order. One explanation to that could be, that there is some single-phased load on the affected phase that cause those rapid voltage changes.
6.3 Voltage Unbalance
As can be seen in Figure 10, Figure 11 and Figure 12, there are no voltage unbalances that exceeds the limit from EIFS 2013:1 of 2 %. Table 9 shows that mean values of the unbalances at the three measuring points are 0.066 %, 0.11 % and 0.14 % which is well within the limit. This indicates that the majority of the connected loads are balanced.
6.4 Harmonics
No single harmonic or THD exceeds the limits from EIFS 2013:1, this can be seen if Figure 13 to Figure 24 together with Table 10 are studied.
Since it is a three-phase system it is expected to have a share of most uneven harmonics, which is clearly the case as can be seen if Figure 17 and Figure 18, Figure 20 and Figure 21, Figure 23 and Figure 24 are compared respectively.
The most present harmonic in all three measuring points are the seventh and after that it is the fifth. These sort of harmonics, odd non-multiples of three, originate from non-linear three-phase loads. A hospital contains a large number of different types of loads, all from medical equipment to loads used in facility maintenance, entertainment and daily living. Considering the range of different loads, it is reasonable that the most common sources of harmonics are three-phased, but it is hard to see exactly what loads that are causing the harmonics. Examples of loads that could cause these harmonics are frequency converters that in the hospital are present at pumps used in the heating and cooling systems. Also, the UPS system is a device that could cause these harmonics.
The share of harmonics of multiples of three is low in all three measuring points. This shows that the system does not have a problem with non-linear single-phase loads and there should not be large currents in the neutral conductor that could cause it to overheat.
If the results from the measurement in 2002 are compared to this one (Figure 4 in appendix and Figure 24), it can be seen that the fifth harmonic was the most common one then, and now it is the seventh. Both these harmonics can arise from the same type of loads, so they may have the same origin. The explanation given in the former analysis, that the harmonics were due to tv sets, computers and CD-players, seems unlikely with the theory in this report which says that single-phase loads should give harmonics of third order.
6.5 Power
The graphs over the power (Figure 25, Figure 26 and Figure 27) show a very distinct time dependent pattern, with an increase every morning and a decrease in the evening. The largest peaks in power consumption are during workdays at workhours, approximately 1.5 MW is consumed over the night-time values. At weekends the increase in power consumption is lower but still visual. This is in line with the operations at the hospital, in evenings and weekends there are less ongoing procedures. During
![Table 1. Duration and voltage levels for voltage dips. Valid for voltage references up to and including 45 kV [11]](https://thumb-eu.123doks.com/thumbv2/5dokorg/5528260.144238/12.892.107.787.814.989/table-duration-voltage-levels-voltage-voltage-references-including.webp)