THESIS
ANALYSIS OF POTENTIAL AIRBORNE RADIONUCLIDE EMISSIONS DURING AND AFTER FIRES THROUGH CONTAMINATED SOIL AREAS ON THE INL.
Submitted by Connor Williams
Department of Environmental and Radiological Health Sciences
In partial fulfillment of the requirements For the Degree of Master of Science
Colorado State University Fort Collins, Colorado
Spring 2021 Master’s Committee:
Advisor: Thomas Johnson Alexander Brandl
James Lindsay
Copyright by Connor Williams 2021 All Rights Reserved
ABSTRACT
ANALYSIS OF POTENTIAL AIRBORNE RADIONUCLIDE EMISSIONS DURING AND AFTER FIRES THROUGH CONTAMINATED SOIL AREAS ON THE INL.
The risk of wildfires burning through legacy soil contamination areas of the Idaho National Laboratory (INL) facility with consequent airborne radiological releases has been a concern for some time and this concern has only increased in recent years with an increasing number and size of wildfires burning through the property. The question of personnel safety has been raised in terms of firefighters and other first responders who might be in close proximity to an ongoing fire as well as the health risks to facility staff and members of the general public. As a result, this study seeks to update the current soil nuclide inventory of the known legacy contamination sites which pose a fire risk as well as update previous fire resuspension studies made of INL
contamination sites through the use of updated modeling techniques and inputs available in more recent literature.
Baseline soil contamination values were developed for the contaminated areas starting with average measured radionuclide concentrations in soil, using in-situ gamma spectroscopy or decay correcting the best available data from previous reports. Soil-to-plant uptake fractions from the literature were used to estimate radionuclide concentrations in plants growing on the sites. Worst case estimates of plant biomass were used to yield release estimates during a fire. Doses to first responders or other high-exposure individuals were estimated through a
comparison to the minimum soil screening concentrations calculated specifically for the INL facility in the literature. This study involved using dynamic dispersion models to determine the minimum soil and plant concentration, for various common nuclides found at INL, which would be necessary to produce an exposure of 10 mrem or greater either during a fire due to release of radionuclides from plant tissue, or after a fire due to resuspension of rootless soil.
Based on the relatively low level of soil radionuclide concentrations in even the most
contaminated sites, the low soil-to-plant transfer coefficients of the specific measured nuclides remaining in the soil and the likely quick dispersion and dilution of any released nuclides in the smoke/dust column, the overall exposure is likely to be small. Therefore, it is hypothesized that that any measurable radiological doses which could be expected to any given individual would be well below current occupational or public exposure limits and thus would not present a health hazard.
TABLE OF CONTENTS ABSTRACT ... ii CHAPTER 1: INTRODUCTION ... 1 1.1 Background ... 1
CHAPTER 2: LITERATURE REVIEW ... 4
2.1 INL Site Specific Parameters ... 4
2.1.1 EDF-1873 ... 4
2.1.2 IDO-19302 ... 5
2.1.3 EGG-ER-11227 ... 6
2.1.4 EDF-RE-22-94... 6
2.1.5 Walker, et. al. 2000 ... 7
2.1.6 DOE-ID-12082-08 through 12082-15 ... 9
2.1.7 INL/INT-15-37431 ... 10
2.1.8 TEV-3638 ... 10
2.1.9 ECAR-2850 ... 10
2.2 Recent Literature on Soil and Dust Resuspension Modeling ... 11
2.1.9 Whicker, J. et. al. 2019 ... 12
2.1.9 Whicker, J. et. al. 2002 ... 12
CHAPTER 3: MATERIALS & METHODS... 14
3.1 Materials ... 14
3.2 Site Selection for Radiation Surveys ... 14
3.3 GPS-Based Radiation Surveys ... 18
3.4 Soil and In-situ Sampling ... 22
3.5 Dose Evaluation ... 24
CHAPTER 4: RESULTS... 26
4.1 Maximum Soil Concentration Values ... 26
4.2 Nuclide Resuspension and Dose Calculation ... 28
CHAPTER 5: DISCUSSION ... 31
5.1 Current Regulatory Limits ... 31
5.2 Personnel and Public Exposures ... 32
5.2 Applicability of This Evaluation to Other Sites ... 33
CHAPTER 6: CONCLUSIONS ... 35
REFERENCES ... 37
APPENDIX I: CONVERSION OF HPGe PEAK COUNTS TO SOIL CONTAMINATION VALUES ... 39
APPENDIX II: DOSE ESTIMATES BASED ON COMPARISONS TO ECAR-2850 SOIL AND PLANT SCREENING VALUES ... 41
APPENDIX V: COPYRIGHT RELEASE ... 54 LIST OF ACRONYMS ... 55
CHAPTER 1: INTRODUCTION
1.1 Background
At 6:30 pm on Monday July 22, 2019, a lightning strike ignited the Sheep Fire on the INL property which eventually burned 112,107 acres over the course of four days and threatened several key facilities. As a result of this event, concerns were raised as to the potential for airborne releases of soil- and plant-bound radionuclides from known areas of legacy
contamination either during an active fire or afterwards as a result of wind-blown resuspension of dust in fire denuded areas. Previous studies on this topic had been conducted but it was realized that even the most recent study was nearly two decades old and that there was a high likelihood that the listed Soil Contamination Areas (SCAs) as well as the listed nuclide inventories were no longer accurate.
Potential nuclide releases and human health effects from fire-borne and wind-borne contaminants from legacy sites on the INL were therefore re-examined. Both posted soil contamination areas and Comprehensive Environmental Response, Compensation, and Liability Act (CERCLA) sites that are not posted as SCAs from the original evaluation (EDF-1873, 2001) were considered. The INL has not generated any significant environmental radiological contamination since the initial evaluation in 2001 (L. Burke, Personal Communication, July 20, 2020). Therefore, the original seven sites that were evaluated in the most recent study on this subject in 2001 were revisited.
The hypothesis is that any measurable radiological doses which could be expected to any given individual would be well below current occupational or public exposure limits and thus would not present a health hazard.
The action taken to support the hypothesis consists of:
1. A review all the environmental sampling data that have been generated since the finalization of EDF-1873 in 2001,
2. A GPS-based radiological mapping of the radiation in the SCAs of interest in order to locate areas of localized elevated soil contamination,
3. In situ measurement of the soil contamination in these localized areas as well as background sites.
4. Soil sampling of these localized elevated areas, and
5. An evaluation of the potential radiological exposures as a result of airborne emissions during and after a potential fire.
The evaluation of emissions is based upon baseline soil contamination values developed for the SCAs starting with average measured radionuclide concentrations in soil using in situ gamma spectroscopy or the best available data from previous reports. Soil-to-plant uptake fractions from the literature were used to estimate radionuclide concentrations in plants growing on the sites. Worst case estimates of plant biomass were used to yield release estimates during a fire. Doses to first responders or other high-exposure individuals were estimated either during a fire due to
release of radionuclides from burning plant tissue or following a fire due to wind-blown soil resuspension in denuded areas.
CHAPTER 2: LITERATURE REVIEW
2.1 INL Site Specific Parameters
The available literature was searched for all studies and documents relating to soil contamination on the INL property, environmental monitoring data specific to INL facilities, and fire and/or dust resuspension of radionuclides in soil and plant types which correspond to those found at INL or to eastern Idaho generally. The following is a review of the documents which were found in the search as well as the relevant information they contained.
2.1.1 EDF-1873
Analysis of potential airborne radionuclide emissions during and after fires through contaminated soil areas on the INEEL, 2001
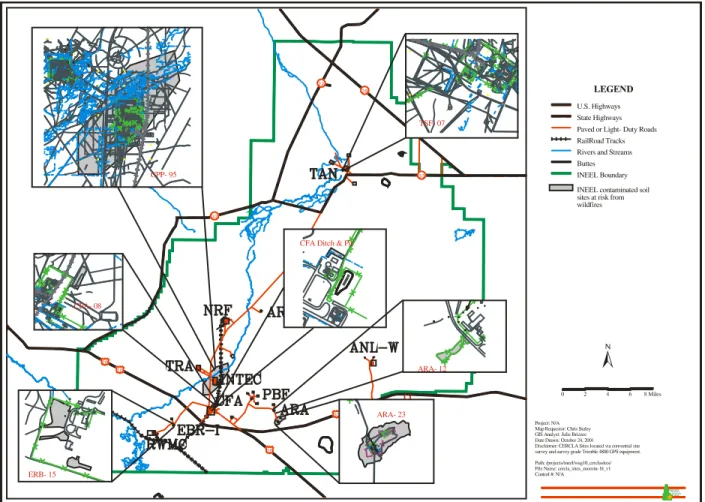
This report was the first major study to attempt to quantify the potential for radiological resuspension as a result of a fire on INL property. This document used the available listing of SCA and CERCLA sites from the original report of EDF-RE-22-94 (below) and updated the list based on which had been remediated and which no longer posed a fire risk in order to reach the final list of seven at-risk sites which were evaluated. EDF-1873 either updated and decay-corrected the soil contamination values as given in EDF-RE-22-94 or used updated values from other sources to give an estimate of soil contamination of specific radionuclides in the at-risk sites which was considered current at the time of publication in 2001. EDF-1873 gave estimates of the magnitude of nuclide releases as a result of fire and/or dust resuspension scenarios. Figure
1 below, shows the locations of the original sites of contamination studied in 2001, and also contains the sites analyzed in the current study.
Figure 1 - Map of INL showing locations of contaminated soil areas evaluated in EDF-1873. The sites evaluated in the current study are also present. (This file is a work of an employee of the U.S. Department of Energy, taken or made as part of that person's official duties.)
2.1.2 IDO-19302
IDO Report on the Nuclear Incident at the SL-1 Reactor on January 3, 1961 at the National Reactor Testing Station, January 1962
This is a report on the Stationary Low Power Reactor No.1 (SL-1) accident and provides historical monitoring data from this event. The contamination that resulted from this accident around the Auxiliary Reactor Area No. 2 (ARA-2) is the current posted SCA for ARA-23. This report was prepared by the SL-1 Report Task Force, U.S. Atomic Energy Commission within a year after the accident in 1962.
2.1.3 EGG-ER-11227
Compilation and Evaluation of the Idaho National Engineering Laboratory Radiological and Environmental Sciences Laboratory Surface Soil Sample Data for Use in Operable Unit 10-06 Baseline Risk Assessment, September 1994
This report is the compilation of all analytical surface soil data which was done at the Idaho National Engineering Laboratory (INEL) by the U.S. Department of Energy Radiological and Environmental Sciences Laboratory (RESL) from around 1970 to 1994.
2.1.4 EDF-RE-22-94
Radiological History and Current States of Soil Contamination at the Idaho National Engineering Laboratory, October 10, 1994
This engineering design file provided the soil nuclide concentrations for the initial evaluation in 2001. It contains the most recent data at the time the evaluation was issued in 1994. Nuclide
inventories which were listed in this document were decay corrected and used in the current study in cases where there were no more recent nuclide specific concentration data available.
2.1.5 Walker, et. al. 2000
Comparison of In Situ Gamma-Ray Spectrometry Measurements to Conventional Soil Sampling Methods at the Idaho National Engineering and Environmental Laboratory (INEEL), December 2000
This document is a thesis submitted for the degree of Master of Science by Doug Walker for Idaho State University. This thesis primarily deals with the evaluation of sampling data from the CERCLA site around the Idaho Nuclear Technical and Engineering Complex (INTEC). It also compares in situ gamma-ray spectrometry measurements to conventional soil sampling methods for the contaminated soils of the INL. A depth distribution profile for airborne deposited
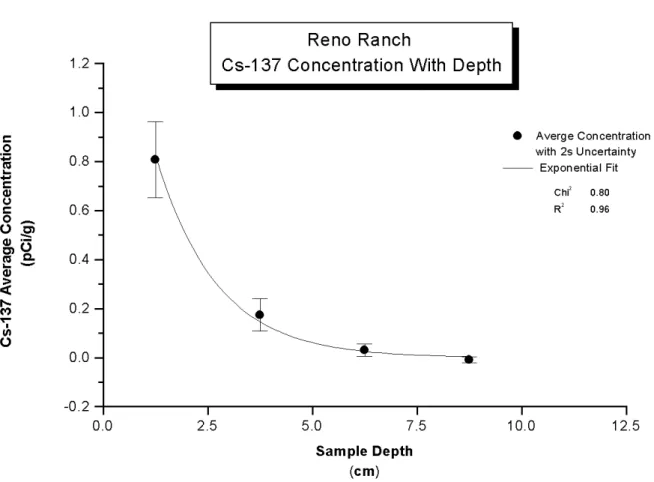
radionuclides within the soil of the INL was created to establish the penetration of different nuclides into the soil column. Measurements of the depth profile of Cs-137 in the soils around INTEC indicated that the cesium had not penetrated very deeply into the soil and that the majority of cesium contamination from all sources was limited to the first few centimeters. Figure 2 shows an area-averaged sample taken around INTEC and Figure 3 is of a non-contaminated area that has only been non-contaminated by atmospheric fallout.
Figure 3 - Background Cs-137 Concentration vs Depth (Walker, 2000; See Appendix V for permission)
2.1.6 DOE-ID-12082-08 through 12082-15
Idaho National Laboratory Site Environmental Report Calendar Year 2008-2015
The DOE Idaho Operation Office (DOE-ID) as per policy has published an annual
environmental report based on a compilation of the data collected by contracting and oversight agencies. The reports which had been made available were considered and those from 2002 to 2015 were reviewed as part of the current study.
2.1.7 INL/INT-15-37431
Historical Data Analysis Supporting the Data Quality Objectives for the INL Site Environmental Soil Monitoring Program, April 2017
This document consists of a compilation of all available soil monitoring data from 1974 through 2014. The data are taken specifically from selected points around the major current and former facilities of the INL. The data was used in this study to specifically update the previous
information available from the existing CERCLA site around INTEC. There was no information about the other six SCAs evaluated in the current study.
2.1.8 TEV-3638
Threshold Limit – Basis for Non-Impacted Volume Contaminated Material designated for disposal at the Landfill, April 24, 2019
This technical evaluation primarily deals with determining the background level of soil
contamination as a result of atmospheric fallout. The radiological inventory for fallout deposition around the INL property in this study was found to largely agree with the results of the
background in-situ surveys done by the study team.
2.1.9 ECAR-2850
Soil Screening Concentrations for Airborne Exposure to Radionuclides Released from Wildland Fires and Fugitive Dust Sources, June 23, 2020
In the years since the publication of EDF-1873, the INL has created an evaluation that gives minimum screening concentrations in soil for two scenarios of nuclide resuspension: 1) A wildfire burns across the INL property and radionuclides in plant tissue and also on the plant surface are released to the air, and 2) radionuclides in the soil are resuspended via wind action in the aftermath of a fire on newly rootless soils. These minimum screening concentrations are provided for radionuclides of interest at the INL and are calculated around the fact that they would result in an effective dose of 10 mrem to an individual being continuously exposed at a distance of 100 m from the smoke and dust column. These minimum soil screening
concentrations were used in the present study for the purposes of calculating a theoretical radiological dose due to the soil contamination values ultimately found within the SCAs themselves on the INL property.
2.2 Recent Literature on Soil and Dust Resuspension Modeling
The scientific literature was searched for recent studies which examined resuspension either as a result of a wildfire or wind-blown dust in arid environments similar to the climate of INL. These were used to look at potential alternative models for soil resuspension and aerial dispersion as well as to look into the validation of resuspension models in terms of air monitoring data found at other radiological sites of similar climate to INL.
2.1.9 Whicker, J. et. al. 2019
Validation Tests of Resuspension Models for a Finite and Infinite Site, October, 2019
This study looked at the resuspension of transuranic nuclide contamination based on wind-action on fine particulates in sand at Los Alamos National Laboratory (LANL). It discusses two
methods of simplistically calculating dust resuspension using either a resuspension factor or a mass-loading model. This study also discusses the physical process and mechanical action of wind-based soil resuspension as well as a full discussion of the limitations and accuracy of current resuspension models and their inherent uncertainty and need for accurate aerial dispersion data for dose calculation.
2.1.9 Whicker, J. et. al. 2002
Temporal and Spatial Variation of Episodic Wind Erosion in Unburned and Burned Semiarid Shrubland, March, 2002
This study looked at the environmental factors which governed the rates of wind-based soil erosion in the desert of Chihuahua, Mexico. It compared the rates of soil erosion in areas which had burned as a result of wildland fires with the rates seen in areas which maintained active plant life and root structures. This study also looks at effects of timing and geography on soil erosion rates in these areas such as variations in daily and weekly wind speed, peak wind gusts and the variation of wind speed across larger areas. The study found that the overall rates of soil erosion were chiefly governed by daily peak wind speeds as opposed to daily or weekly averages and
that soil erosion was markedly higher in areas which had been burned, both as a result of the lack of root structures but also as a result of the lack of plant life with which to catch soil which had been resuspended and limit the travel distance of particles. This study concluded that the threshold wind velocity for larger soil erosion in burned areas was approximately 7 m/s which agrees with the wind speed results and wind speed inputs used to create the minimum soil and plant screening values in ECAR-2850.
CHAPTER 3: MATERIALS & METHODS
3.1 Materials
All radiation surveys were performed using the following equipment:
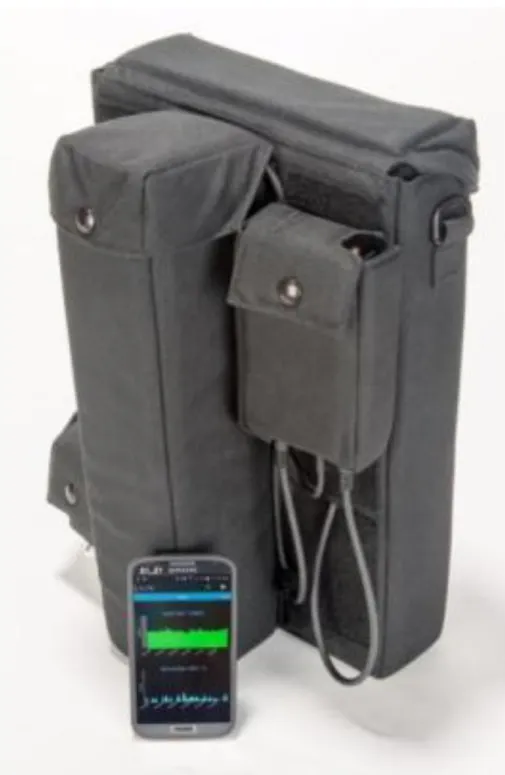
• Sodium Iodide detector, 8 x 3.75 x 1.5 inch carried as part of a backpack mapping system, Gemini (U.S. Department of Energy Remote Sensing Laboratory, Nevada National Security Site, Las Vegas. Nevada)
• Advanced Visualization and Integration of Data (AVID) software package on Galaxy S10 mobile phones, (National Nuclear Security Administration, Nellis Air Force Base, Las Vegas, Nevada)
• Mobile machine-cooled HPGe Detector, ORTEC Model EX-100, (Advanced Measurement Technology, Oak Ridge, Tennesee)
3.2 Site Selection for Radiation Surveys
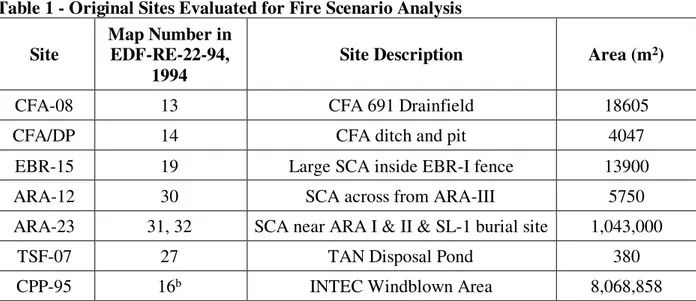
In EDF-1873, 35 SCAs and 18 CERCLA sites were screened for evaluation and six SCAs and one CERCLA site were chosen for detailed fire scenario analysis. The seven sites analyzed in detail range in size from 380 m2 to 8,068,860 m2, and are near five INL facilities – ARA, EBR-I,
that two of the sites had been remediated since the original study (EDF-1873, 2001). The original seven sites were as follows:
1. CFA-08 was originally a sewage treatment plant (CFA-691), septic tank and drain field for Central Facilities. Discharge from a Contaminated Laundry facility at the site made it into the CFA sewage treatment system. In 2001, the site was covered with clean soil in-fill and capped with lava rock boulders, which had the effect of changing the site from an SCA to an Underground Radioactive Material Area (URMA) (DOE, 2000a). The original size of the area was listed as 19605 m2 (EDF-1873, 2001). The site was visited in person by the study
team and it was concluded that the lava rock barrier remained in place securely, the infill had not eroded away and that the location was thus not susceptible to a fire.
2. CFA/DP is a drainage ditch and gravel pit located near the old CFA sewage treatment plant. It appears to have had contaminated water discharged into it from the former Contaminated Laundry facilities at CFA-08. (Ortel, 2000) The study team visited the site, and no changes were noted from the description in the original study. The site is not posted as hazardous. In the original evaluation, its size was given as 4047 m2 (EDF-1873, 2001).
3. EBR-15 is the last remaining of several former SCAs located inside the fence line of EBR-1. The area was contaminated by sodium-potassium (NaK) coolant which was spilled during operations at the facility in the 1950’s, and also later during the decommissioning process in the 1970’s (L. Burke, personal communication, July 20, 2020). The estimated size during the original evaluation was 13,900 m2 (EDF-1873, 2001). The area around the EBR I facility
appears to have been remediated and the only SCA remaining is the location that was designated in the original evaluation (EDF-RE-22-94, 1994) as Map Location 20, a pit of
pose a risk in a wildfire, as there is no flammable material, and thus it cannot be resuspended (DOE, 2001).
4. ARA-12 is the designation for the SCA located across Filmore Boulevard from the what used to be Army Reactor Area No. 3 (ARA III). ARA III was the location of a former gas-cooled reactor facility designed and built for the Army in the early 1960’s as part of the National Reactor Testing Station (NRTS). The program was phased out in 1965 (DOE, 2000b). The SCA which remains is a result of a leach pond formerly at the site and which was reduced from 5 acres to 0.25 acres in 1994 (EDF-RE-22-94, 1994). It is currently designated as 5750 m2 (EDF-1873, 2001).
5. ARA-23 is the designation for the SCA that was created as a result of the SL-1 accident in 1961 and contains both the former ARA I and ARA IIs sites. ARA I was originally the support facility for the Army reactors in the area and ARA II itself contained the SL-1 reactor complex (IDO-19302, 1961). The area consists of a burial ground for the former facility buildings and other contaminated debris (a chain link fenced area of 300 feet by 600 feet) as well as a larger area of contaminated soil that resulted from airborne deposition from the accident and the cleanup operations. Following the accident, the facilities at ARA I continued to be used up until the early 1990’s and resulted in further contamination of the general area. The combined areas of ARA-23 are 1,043,000 m2 (EDF-1873, 2001).
6. TSF-07 is the designation for the Technical Support Facility (TSF) Waste Disposal Pond which was built in the 1970’s to replace the use of injection wells which had been the primary means of disposing of radioactive waste generated at TSF up until that time. The disposal pond took in waste from various sources and included low-level radioactive waste, cold process waste, and treated sewage effluent (L. Burke, personal communication, July 24,
2020). The pond itself formerly covered an area of about 35 acres, but the remaining SCA now covers only a small portion (380 m2). Prior sampling has found Cs-137, Co-60, Sr-90,
and gross alpha activity in the surface soils of the area (EDF-1873).
7. CPP-95 is the designation for the CERCLA site that surrounds INTEC. This area is due almost entirely to aerial deposition from facility emissions as well as from resuspension of soil contamination that resulted from leaking underground radioactive waste lines. The soil contamination inside INTEC has since been remediated and fuel processing operations are no longer active at INTEC (DOE, 1997). The highest contamination in the area is near the facility fence and decreases commensurate with distance from the facility. The area around INTEC that is included in the CERCLA site is 8,068,858 m2 (EDF-1873, 2001). CPP-95 was
not evaluated in detail in the current study as the size of the area was too large to feasibly cover with current resources. The previously published soil contamination values from EDF-1873 were therefore used instead.
The original seven sites are contained in the Table 1 below: Table 1 - Original Sites Evaluated for Fire Scenario Analysis
Site
Map Number in EDF-RE-22-94,
1994
Site Description Area (m2)
CFA-08 13 CFA 691 Drainfield 18605
CFA/DP 14 CFA ditch and pit 4047
EBR-15 19 Large SCA inside EBR-I fence 13900
ARA-12 30 SCA across from ARA-III 5750
ARA-23 31, 32 SCA near ARA I & II & SL-1 burial site 1,043,000
TSF-07 27 TAN Disposal Pond 380
As a result of the initial site visits, the sites CFA-08 and EBR-15 were dropped from consideration. In the case of CFA-08, as noted above, the site was remediated and is now considered an URMA as it is covered with clean soil and capped by a fire-proof barrier of lava rock boulders which renders the site impervious to fire resuspension. EBR-15 is not considered a fire risk as the site of contamination is bare lava rock and concrete which has had contamination sink into the rock structure itself. There is no soil or plant life present and so it is not considered a fire or resuspension risk.
3.3 GPS-Based Radiation Surveys
The geographical spectrum of soil radiation intensity for the final four SCAs was mapped in order to give a visual reference for what the range of radiation levels were and also in order to locate the areas of maximum intensity which would correspond to the highest level of detectable soil contamination. These areas of maximum concentration would then be selected for further examination and for both soil and in-situ sampling in order to establish the true available nuclide inventory. The SCA surrounding the INTEC facility was not manually mapped as the sheer size of the area (8 km2) made the effort unfeasible with the time and resource limitations of the
current study. Therefore, the previously published soil contamination values from EDF-1873 were decay corrected for 2020 and used instead.
The area mapping for radiation was done with DOE manufactured Gemini backpack radiation detector systems which the study team obtained on loan from the DOE Region 6 Radiological
Assistance Program. The detector system included an 8” x 3.75” x 1.5” sodium iodide detector that transmits spectral and positional data each second to a remote database. These data were collected and mapped utilizing Advanced Visualization and Integration of Data (AVID) software (National Nuclear Security Administration, Nellis Air Force Base, Lax Vegas, Nevada). Access to the SCAs was limited by the requirements for a Radiological Work Permit (RWP), anti-contamination clothing consisting of a full Tyvek suit and two sets of gloves and boots, and full-time radiological control technician coverage. The backpacks were worn by members of the study team and the SCA was walked in a grid pattern of approximately 2 m x 2 m, which is the maximum width of scan of the Gemini backpack detector setup. The Gemini system was calibrated each field-day against a 10 Ci Cs-137 source. A background count and background intensity spectrum was created by walking a circumference of approximately 10 m outside the fence line of the SCAs as well as walking a small grid of land at the gate on Filmore Blvd leading to U.S. Highway 20, approximately ½ mile from the nearest SCA or area of known contamination.
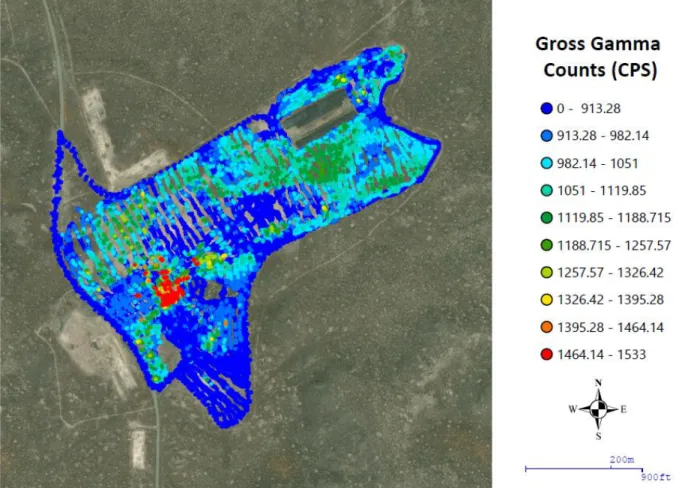
Results of the radiation intensity mapping were utilized to determine the locations for high purity germanium (HPGe) in situ gamma spectroscopy and soil sampling of the radionuclides in the SCA in order to collect the highest possible contamination values for each given area. As a result, the use of the highest possible values as opposed to an area average would result in worst case radiological dose estimates. The results of the radiation intensity mapping are presented in Figure 4 and Appendix II. The mobile HPGe detector was originally calibrated with a 10 Ci Cs-137 source but did not require daily source checks after that point. Background spectra of
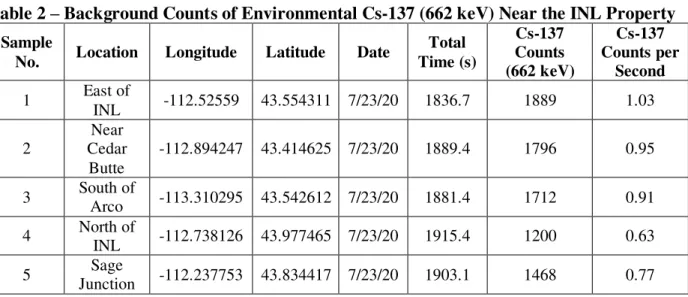
30-directions and the average of the background activities calculated for each measured nuclide were subtracted from the measured activities calculated in-situ at the SCAs. The results of the background spectra for Cs-137 are included in Table 2. Cs-137 was the only nuclide out of those found at the various SCAs which was observed in the background spectra.
Table 2 – Background Counts of Environmental Cs-137 (662 keV) Near the INL Property Sample
No. Location Longitude Latitude Date
Total Time (s) Cs-137 Counts (662 keV) Cs-137 Counts per Second 1 East of INL -112.52559 43.554311 7/23/20 1836.7 1889 1.03 2 Near Cedar Butte -112.894247 43.414625 7/23/20 1889.4 1796 0.95 3 South of Arco -113.310295 43.542612 7/23/20 1881.4 1712 0.91 4 North of INL -112.738126 43.977465 7/23/20 1915.4 1200 0.63 5 Sage Junction -112.237753 43.834417 7/23/20 1903.1 1468 0.77
Figure 4 – A Gemini backpack detector system showing the sodium iodide compartment (long tube at front) as well as a screenshot of the AVID data collection program on the Galaxy smartphone. (National Security Technologies for DOE, 2016 | Government document))
Figure 5 – An example of a heat map generated for in-situ and soil sampling site selection. This map is of the general area of ARA-23, the SL-1 accident site.
3.4 Soil and In-situ Sampling
Soil samples for the four SCAs which were mapped were taken between July and August, 2020. The locations selected for sampling were based on the local radiation maxima identified during the mapping operation. Samples were taken and counted by the Radiation Measurements
Laboratory at the Advanced Test Reactor Complex (Wells, 2020). The maximum results for each site are shown in Table 3.
Table 3 – Maximum Soil Sampling Results from the SCAs under Evaluation.
SCA Sample No. Radionuclide Activity MDA
ARA-12 ARA-3:1A
Ag-108m (8.97 ± 0.64) E+01
pCi/g 3.26E+00
Co-60 (8.75 ± 0.98) E-01 pCi/g 3.62E-01 Cs-137 (6.64 ± 1.10) E-01 pCi/g 4.29E-01
ARA-23 SL-1:1A Cs-137 (3.54 ± 0.25) E+02
pCi/g 1.33E+01
CFA/DP CFA:1C Cs-137 (9.17 ± 0.68) E+00
pCi/g 8.37E-01
TS-07
TAN:1A Cs-137 (5.63 ± 0.41) E+01
pCi/g 3.37E+00
TAN:2A
Co-60 (4.27 ± 0.73) E-01 pCi/g 3.30E-01 Cs-137 (3.87 ± 0.28) E+01
pCi/g 3.13E+00
Results of all the soil sampling performed in the summer of 2020 are listed in Appendix IV.
In situ soil measurements were also conducted at these localized maximum radiation intensity areas within the four SCAs. The in-situ spectroscopy was conducted with a mechanically cooled ORTEC Detective EX-100 with a counting time of 60 minutes at each area. Results of the in-situ sampling are provided in Table 4.
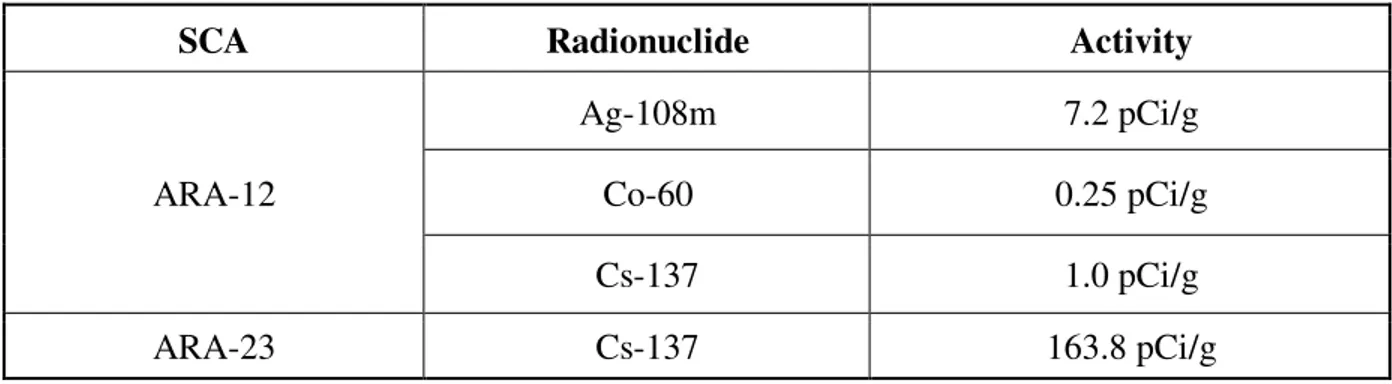
Table 4 – Maximum In-Situ Sampling Results from the SCAs under Evaluation.
SCA Radionuclide Activity
ARA-12
Ag-108m 7.2 pCi/g
Co-60 0.25 pCi/g
Cs-137 1.0 pCi/g
CFA/DP Cs-137 6.5 pCi/g Co-60 0.58 pCi/g TSF-07 Cs-137 26.2 pCi/g Co-60 0.61 pCi/g 3.5 Dose Evaluation
ECAR-2850 Soil and Plant Emission Models
ECAR-2850 utilized the most updated modeling information and software available at the time of writing (2017) to evaluate both the resuspension of nuclides during and after a fire event as well as the aerial dispersion of the resultant plume in order to estimate the dose to an individual at a downwind target. Both the PATHWAY model by Whicker and Kirchner (Whicker, F.W. et. al, 1987) as well as the COMIDA model by Abbott and Rood (Abbott, ML. et. al, 1993) were used to give estimates of the concentration of nuclides both on the surface and in the burnable tissue of plants of the type found commonly at INL as well as the potential concentration of nuclides released as a result of a wildfire. A fugitive dust resuspension model developed for the U.S. Environmental Protection Agency (EPA) (Cowherd, c. et. al., 1985) was then used to estimate the nuclide resuspension from dust and soil in burned and rootless areas in a wind event after a fire. Equations from both of these models were used in conjunction with a stated dose limit of 10 mrem, to find the nuclide concentrations across a range of different scenarios which would be required in plant life and in soil to produce an inhalation dose of 10 mrem assuming that all of it was released either during or after a fire, respectively.
The nuclide resuspension concentrations from both of these scenarios were then run through an EPA developed software model for determining aerial dispersion of fine particulates known as AEROMOD (EPA, 2004) which was input with 5 years’ worth of meteorological and wind speed data taken from an INL monitoring site in order to estimate the dispersion factors for nuclides which would most closely correspond to the times of the year when wildfires are most common. This range of dispersion factors was then combined with the range of soil and plant contamination values from the active fire and fugitive dust scenarios in order to find the
minimum possible soil and plant concentration values (pCi/g) which could result in a theoretical inhaled dose of 10 mrem to an individual standing at a minimum distance of 100 m from a burning or wind-blown area. These were then identified as the “minimum plant/soil screening values”.
As the exposure from nuclide emission scales linearly with increasing concentration, for the purposes of this current study, the current soil and plant contamination values either measured or reported for the different sites were compared to these minimum screening values. This was done in order to estimate the potential personnel exposure during these scenarios as conservatively as possible.
CHAPTER 4: RESULTS
4.1 Maximum Soil Concentration Values
The original study (EDF-1873) utilized the average nuclide concentration in soil to determine the potential dose during a fire due to a combination of burning plant tissue and also after a fire as a result of soil resuspension due to wind over denuded and rootless areas. This is opposed to the maximum concentrations used in the present study which lead to a more protective dose estimate. Due to limitations of the soil sampling process used by the study team including a limited time on station which necessitated only taking one soil core for each mapped maximum radiological intensity area, and the consequent inability to have a grid of cores taken and soil concentrations averaged by depth, it was decided that the soil contamination values to be used for dose calculation should be those from the maximum in-situ measurements.
The two exceptions to this are the measurements of Am-241 at TSF-07 and Sr-90 at ARA-23 and INTEC as neither were observed in the in-situ data. However, this is understandable as Am-241 emits alpha as well as a very low energy gamma and Sr-90 is a pure beta emitter and as such even a small thickness (a few millimeters in the case of alpha particles) of covering dirt could possibly keep the HPGe detector from registering a detection. Therefore, the previously published values for these nuclides were taken from EDF-1873 and decay corrected for 2020. Maximum available values for soil contamination concentration are listed in Table 6 by SCA.
The results of the 60-minute counts for each nuclide of concern made by the mobile HPGe detector were compared to the background spectra taken around the outside boundary of the INL
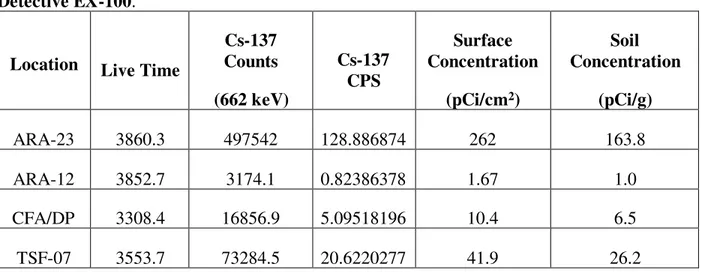
property, and these counts were then normalized against the averaged background counts for each nuclide. These background normalized counts (in counts per second) were then run through a proprietary software program developed jointly by NNSA and LANL which was developed specifically for the ORTEC Detective series of HPGe detectors and which gave results, based on a 1 m detector distance above ground level, in terms of the soil concentration of each nuclide in pCi/g. An example calculation for Cs-137 is given in Table 5. The full list of tables for this conversion calculation is included in Appendix I.
Table 5 – Cs-137 conversion of peak counts (662 keV) to soil concentration for the ORTEC Detective EX-100.
Location Live Time
Cs-137 Counts (662 keV) Cs-137 CPS Surface Concentration (pCi/cm2) Soil Concentration (pCi/g) ARA-23 3860.3 497542 128.886874 262 163.8 ARA-12 3852.7 3174.1 0.82386378 1.67 1.0 CFA/DP 3308.4 16856.9 5.09518196 10.4 6.5 TSF-07 3553.7 73284.5 20.6220277 41.9 26.2
Table 6 – Maximum Soil Contamination Values Used for Dose Calculation.
SCA Location Radionuclide Average
Activity
ARA-12 SCA across from ARA-III
Ag-108m 20.1 pCi/g Cs-137 1.0 pCi/g
Co-60 0.25 pCi/g ARA-23 SCA near ARA I & II & SL-1 burial
site
Cs-137 163.8 pCi/g Sr-90a 0.55 pCi/g
TSF-07 TAN Disposal Pond
Am-241a 0.02 pCi/g
Cs-137 26.2 pCi/g Co-60 0.6 pCi/g
CPP-95 INTEC Windblown Area Cs-137 8.61 pCi/g
Sr-90a 0.72 pCi/g
a. Values decay corrected from EDF-1873, 2001.
4.2 Nuclide Resuspension and Dose Calculation
Releases of nuclides during an active fire event were assumed to come from burned plant tissues and residual dust on plant surfaces only. Plant life is typically contaminated by root-based uptake of nuclides from the surrounding soil, and their surfaces can contain contamination from local soil resuspension. The two separate scenarios used in ECAR-2850 (an active fire with
simultaneous soil resuspension, and wind-based soil resuspension post-fire only) were done separately and two different sets of screening values were found. However, in all cases the plant and soil screening concentrations which had been calculated for the active fire scenario were smaller than those for the post-fire dust resuspension only simulation. As a result, suspension of soil itself during an active fire was assumed to be relatively small and was therefore not assessed for the purposes of dose calculation. Only dust resuspension after a fire event due to wind
erosion of denuded and rootless soils (known as the Fugitive Dust Scenario) was assessed and a dose calculated. The minimum soil and plant screening values are given in Table 7.
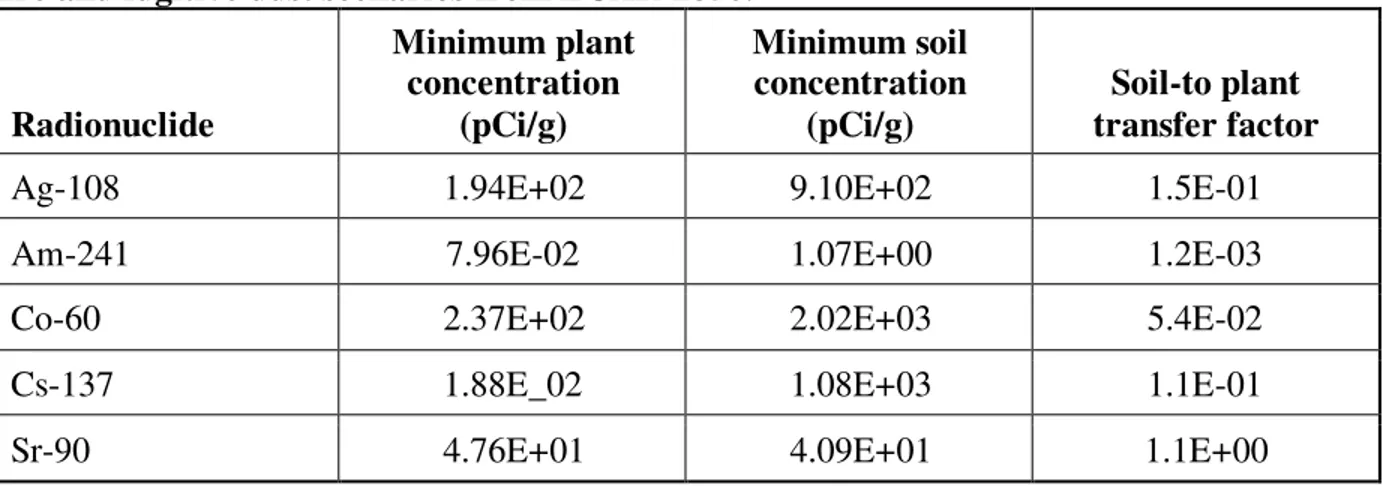
Table 7 - Comparison of the minimum radionuclide soil screening concentrations for the fire and fugitive dust scenarios from ECAR-2850.
Radionuclide Minimum plant concentration (pCi/g) Minimum soil concentration (pCi/g) Soil-to plant transfer factor
Ag-108 1.94E+02 9.10E+02 1.5E-01
Am-241 7.96E-02 1.07E+00 1.2E-03
Co-60 2.37E+02 2.02E+03 5.4E-02
Cs-137 1.88E_02 1.08E+03 1.1E-01
Sr-90 4.76E+01 4.09E+01 1.1E+00
In order to calculate the potential dose, soil concentrations from the in-situ measurements were multiplied by the soil-to-plant transfer factors (IAEA, 1994) for each nuclide to give an
estimation of the plant tissue concentrations for each nuclide. Following this, the values for the soil and plant concentrations were divided by the minimum soil and plant screening
concentrations from ECAR-2850 in order to give a final calculation for potential exposure due to the actual amounts of contamination for each nuclide at each SCA. An example of this
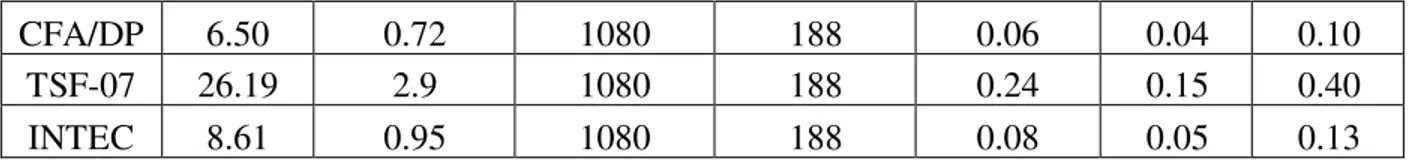
calculation for Cs-137, which was universal for all SCAs, is given in Table 8. The full list of tables for this calculation for each nuclide is included in Appendix II.
Table 8 – Dose Estimates for Cs-137 Exposure Based on a Comparison to Screening Values in ECAR-2850. Locatio n Soil In-situ Gamm a (pCi/g) Calculated Plant Concentra tion (pCi/g) ECAR-2850 Minimum soil screening concentrat ion (pCi/g) ECAR-2850 Minimum plant screening concentrat ion (pCi/g) Soil Resuspen sion Exposure (mrem) Plant Burn Exposu re (mrem) Total Fire Event Exposu re (mrem) ARA-23 163.75 18 1080 188 1.5 0.96 2.5
CFA/DP 6.50 0.72 1080 188 0.06 0.04 0.10
TSF-07 26.19 2.9 1080 188 0.24 0.15 0.40
INTEC 8.61 0.95 1080 188 0.08 0.05 0.13
All of the calculated exposures for each nuclide contaminant identified at each site were
tabulated and the results from both the active fire and post-fire dust resuspension scenarios were added together in order to give a final estimate of exposure to a downwind individual for each SCA from all sources. Table 9 presents the potential radiological exposure for each legacy soil contamination area remaining on the INL property.
Table 9 – Total Exposures from Resuspension for each Soil Contamination Area from All Sources. Location Cs-137 Total Exposure (mrem) Co-60 Total Exposure (mrem) Sr-90 Total Exposure (mrem) Am-241 Total Exposure (mrem) Ag-108m Total Exposure (mrem) Total Exposures from All Sources (mrem) ARA-23 2.5 - - - - 2.5 ARA-12 0.02 0.0018 0.26 - 0.08 0.4 CFA/DP 0.10 0.0001 - - - 0.1 TSF-07 0.40 0.0032 - 0.19 - 0.6 INTEC 0.13 - 0.34 - - 0.5
CHAPTER 5: DISCUSSION
5.1 Current Regulatory Limits
Regulatory limits on radiological doses are given both by federal regulations as well as
Department of Energy (DOE) orders. Dose limits for occupational workers are given in Code of Federal Regulations, Title 10, “Energy,” Part 835, Occupational Radiation Protection,” (10 CFR 835). Under these regulations, workers who are considered to be trained radiological workers are limited to less than 5 rem in terms of Total Effective Dose (TED) annually. Non-radiological workers have a much lower personal limit of less than 100 millirem TED annually.
Dose limits for members of the general public are governed by the EPA. These limits are given under DOE order 458.1, “Radiation Protection of the Public and the Environment”. Under these regulations, members of the general public are similarly limited to a maximum of less than 100 millirem TED, and as it relates to the current study, the contribution to this dose limit from airborne radioactivity is limited to less than 10 millirem Committed Effective Dose (CED). From a comparison to these values, it can be seen that even the combined total expected dose from the area with the highest level of contamination (ARA-23) in a theoretical scenario where the wind-blown fugitive dust scenario occurs simultaneously with an active fire event comes out to 2.5 mrem. This is far below the EPA limitation for members of the general public due to airborne radiation (10 mrem) and consequently even farther below any existing occupational standard for workers.
5.2 Personnel and Public Exposures
Overall, the greatest fire or resuspension exposure potential comes from ARA-23, the site of the former SL-1 and accident, (2.5 mrem) due to the Cs-137 in the soil and plant materials
remaining from the accident in 1961. All other sites present potential exposures which are at least an order of magnitude lower in comparison. The second highest exposure potential (0.59 mrem) would be from TSF-07, the former disposal pond at TAN, however this is a small area which would likely burn through very quickly in the event of a wildfire and as such the potential for exposure would be lower.
The other site with a reasonable potential for airborne exposure in the event of a fire is at INTEC (0.5 mrem), and while this is a very large area which would burn slowly and thus create a far longer lasting radioactive particulate plume, the soil and plant screening values in ECAR-2850 are specifically designed around the worst-case scenario of an individual exposed continuously to a radioactive smoke column at a distance of 100 m. This is unlikely to realistically occur even among first responders actively working a wildfire on INL.
The downwind risks to members of the general public would be of necessity lower than the values seen in Table 9 as the closest point of public access to any of the listed SCAs are on US Highways 20/26 and 33, which are around half a mile from the nearest SCA. This would
massively increase the dispersion factors used in aerial modeling and would result in a far lower overall potential for exposure along with a lower likelihood of spending any significant time within the smoke and dust emission column.
5.2 Applicability of This Evaluation to Other Sites
From the outset of this study, care was taken to find the most accurate information as to the actual environmental and radiological situation on the ground on the INL property. This resulted in most relevant documentation being site-specific in terms of previous studies relating to INL, INL facilities and INL operations. The decisions made to find accurate soil-to-plant transfer coefficients were based around wild, grassy plants grown in high-pH, low moisture soils so as to be as accurate as possible to the ecological and biological conditions present on the desert of Eastern Idaho.
The modeling inputs used to calculate the minimum soil- and plant-screening values in ECAR-2850 included using data which were entirely site specific including 5-year wind speed and direction data collected by the INL Field Research Division (FRD) and which were taken at the INTEC site on the INL property and used to find aerial dispersion factors specific to the times of year in which wildfires are most common at INL. Further, estimations of average plant biomass and consequent burn times across given distances were taken from INL-specific ecological data as used in EDF-1873.
While resuspension can be relatively easily calculated by either Resuspension Factor Models or Mass Loading Models (Whicker, J. 2019), aerial dispersion and deposition are not easily
modeled by equation and instead rely on probabilistic computer modeling which depends on site-specific factors such as the local climate and predictable values such as wind speed and direction which are of necessity specific to only one location.
Therefore, while the collected data and modeling can be considered accurate for INL and are recommended for further use in future studies of this sort in and around the INL facility, the models and dose calculations cannot be considered relevant to any other site of soil
contamination. It is possible that radiological sites which have very similar climate, geography and biota such as Pacific Northwest National Laboratory (PNNL) and LANL could find the data in this study as well as the soil and plant screening values from ECAR-2850 to be of some value for creating baseline exposure estimates. However, these sites would certainly need to validate any of the exposure estimates made with either more accurate and refined modeling using their own site-specific data, or with their own local resuspension data from continuous air monitoring. Further refinements to the models used here as well as different model inputs would be required to produce accurate data for any other site which is of a different ecological, climatological, or biological type.
CHAPTER 6: CONCLUSIONS
From the data in the present study, it can be seen that the highest potential for radiological exposure as a result of a fire or soil resuspension after a fire comes from the residual
contamination of the former site of the SL-1 accident, ARA-23. However, even this exposure is less than a third (2.5 mrem) of the regulatory limit for airborne exposure by members of the general public which is set at 10 mrem. This exposure estimate is also based on a theoretical individual being continuously exposed to a radiological smoke and dust column at a distance of 100 m for a matter of at least several hours and this scenario is very unlikely even by a trained radiological worker acting as a first responder in the event of a fire.
The ARA-23 site itself is also small enough that a fire would likely burn through the entirety of the contaminated area within just a few hours and therefore the radioactive exposure potential from the burning plant material would subside quickly. Furthermore, this estimate is based on the entirety of the burn area, and subsequent wind-blown dust resuspension area having a uniform soil contamination equal to the highest measured soil contamination seen as a result of the
radiation mapping and in-situ measurements, which is not the case. It can be seen in the radiation mapping results that the area of local maximum radiation strength is quite small compared to the full size of the marked SCA for ARA-23 and therefore realistically the time for the smoke and dust column to be at maximum radiological potential will be very short.
exposure estimate (4.0 mrem) is still far below current regulatory limits. Therefore, the original hypothesis that any measurable radiological doses which could be expected to any given
individual would be well below current occupational or public exposure limits and thus would not present a health hazard is proven within the context of the results of the current study. Further research is needed to conclude this hypothesis as proven across all possible levels of extant contamination at the SCA sites which should be ascertained in future through a combination of thorough soil sampling and in-situ data.
REFERENCES
1. 10 CFR 835, Code of Federal Regulations, Title 10, “Energy,” Part 835, Occupational Radiation Protection,” U.S. DOE
2. DOE (U.S. Department of Energy), 2011, Order 458.1, Radiation Protection of the Public and the Environment, U.S. DOE, DOE O 458.1 Chg 4.
3. DOE (U.S. Department of Energy), 1997, Comprehensive Remedial Investigation Feasibility Study (RI/FS) for ICPP OU 3-13 Part A; Remedial Investigation Baseline Risk Assessment (RI/BRA) Report, DOE/ID-10534.
4. DOE (U.S. Department of Energy), 2000a, Final Comprehensive Record of Decision (ROD) for Central Facilities Area (CFA) Operable Unit (OU) 4-13, DOE/ID-10719. 5. DOE (U.S. Department of Energy), 2000b, Record of Decision (ROD) for Power Burst
Facility Auxiliary Reactor Area (PBF/ARA) Operable Unit (OU) 5-12, DOE/ID-10700. 6. DOE (U.S. Department of Energy), 2001, Comprehensive Remedial Investigation
Feasibility Study for Waste Area Group 6 and 10 Operable Unit 10-04 (Draft), DOE/ID-10807.
7. IDO-19302, ID0 Report on the Nuclear Incident at the SL-1 Reactor on January 3, 1961 at the National Reactor Testing Station, U.S. AEC, January 1962
8. EDF-1873, Analysis of potential airborne radionuclide emissions during and after fires through contaminated soil areas on the INEEL. October 30, 2001
9. EGG-ER-11227, Compilation and Evaluation of the Idaho National Engineering Laboratory Radiological and Environmental Sciences Laboratory Surface Soil Sample Data for Use in Operable Unit 10-06 Baseline Risk Assessment, September 1994 10. EDF-RE-22-94, Radiological History and Current States of Soil Contamination at the
Idaho National Engineering Laboratory, October 10, 1994
11. Abbott, M.L. and A.S. Rood, 1993, COMIDA: A Radionuclide Food Transport Model for Acute Fallout Deposition. EGG-GEO-10367. Idaho National Engineering Laboratory. 12. Cowherd, C., G.E. Muleski, P.J. Englehart, and D.A. Gillette, 1985. Rapid Assessment of
Exposure to Particulate Emissions from Surface Contaminated Sites. EPA/600/8-85/002. Office of Health and Environmental Assessment U.S. Environmental Protection Agency, Washington D.C.
13. Whicker, F.W., and T.B. Kirchner, 1987, “PATHWAY: A Dynamic Food-Chain Model to Predict Radionuclide Ingestion After Fallout Deposition.” Health Physics, 52(6), pp 717-737.
14. Whicker, J.J., Breshears, D.D., Wasiolek, P.T., Kirchner, T.B., Tavani, R.A., Schoep, D.A. and Rodgers, J.C. (2002), Temporal and Spatial Variation of Episodic Wind Erosion in Unburned and Burned Semiarid Shrubland. J. Environ. Qual., 31: 599-612.
15. Whicker, Jeffrey J.; McNaughton, Michael; Ruedig, Elizabeth; Fuehne, David P.1
Validation Tests of Resuspension Models for a Finite and Infinite Site, Health Physics: October 2019 - Volume 117 - Issue 4 - p 408-415 doi: 10.1097/HP.0000000000001078 16. EPA, 2004, User’s Guide for the AERMOD Meteorological Preprocessor (AERMET),
EPA-454/B-03-002, U.S. EPA, Office of Air Quality Planning and Standards, Research Triangle Park, North Carolina.
17. Thesis, Comparison of In Situ Gamma-Ray Spectrometry Measurements to Conventional Soil Sampling Methods at the Idaho National Engineering and Environmental Laboratory (INEEL), Doug W. Walker, Idaho State University, December 2000
18. INL/INT-15-37431, Historical Data Analysis Supporting the Data Quality Objectives for the INL Site Environmental Soil Monitoring Program, April 2017
19. Pedestrian Mapping with Spectral Backpacks for GPS-Denied Areas, National Security Technologies LLC on behalf of U.S. Department of Energy, September 22, 2016,
https://www.osti.gov/servlets/purl/1578179, Accessed on February 25, 2021.
20. TEV-3638, Threshold Limit – Basis for Non-Impacted Volume Contaminated Material designated for disposal at the Landfill, April 24, 2019
21. ECAR-2850 - Soil Screening Concentrations for Airborne Exposure to Radionuclides Released from Wildland Fires and Fugitive Dust Sources, June 23, 2020
22. Memo, David J. Wells to Connor C. Williams, “Radiation Measurements Laboratory Gamma-Ray Analysis of Twenty-Six CFA Summer Intern Project Soil Samples,” dated August 4, 2020
23. IAEA (International Atomic Energy Agency), 1994, Handbook of Parameter Values for the Prediction of Radionuclide Transfer in Temperate Environments, Technical Reports Series No. 364, Vienna.
APPENDIX I: CONVERSION OF HPGe PEAK COUNTS TO SOIL CONTAMINATION VALUES
Table 10 – Cs-137 conversion of peak counts (662 keV) to soil concentration for the ORTEC Detective EX-100.
Location Live Time
Cs-137 Counts (662 keV) Cs-137 CPS Area Contamination (pCi/cm2) Soil Contamination (pCi/g) ARA-23 3860.3 497542 128.886874 262 163.8 ARA-12 3852.7 3174.1 0.82386378 1.7 1.0 CFA/DP 3308.4 16856.9 5.09518196 10.4 6.5 TSF-07 3553.7 73284.5 20.6220277 41.9 26.2
Table 11 – Co-60 conversion of peak counts (1332 keV) to soil concentration for the ORTEC Detective EX-100.
Location Live Time
Co-60 Counts (1332 keV) Co-60 CPS Area Contamination (pCi/cm2) Soil Contamination (pCi/g) ARA-12 3852.7 528.3 0.137124614 0.407 0.3 CFA/DP 1951 164.9 0.084520759 0.923 0.6 TSF-07 3583.4 317.2 0.088519283 0.973 0.6
Table 12 – Ag-108m conversion of peak counts (various energies) to soil concentration for the ORTEC Detective EX-100.
Location Spectrum Live Time Ag-108m Counts Ag-108m CPS Average Soil Concentration (pCi/cm^2) Average Soil Concentration (pCi/g) ARA-12 79.1 keV 3852.7 797 0.206867911 11.45 7.2 434 keV 3852.7 35651 9.253510525 614 keV 3852.7 28460.1 7.387053235 723 keV 3852.7 27991.6 7.265450204
APPENDIX II: DOSE ESTIMATES BASED ON COMPARISONS TO ECAR-2850 SOIL AND PLANT SCREENING VALUES
Table 13 – Dose Estimates for Cs-137 Exposure Based on a Comparison to Screening Values in ECAR-2850.
Location Soil In-situ Gamma (pCi/g) Calculated Plant Concentration (pCi/g) ECAR-2850 Minimum soil screening concentratio n (pCi/g) ECAR-2850 Minimum plant screening concentratio n (pCi/g) Soil Resuspensio n Exposure (mrem) Plant Burn Exposur e (mrem) Total Fire Event Exposur e (mrem) ARA-23 163.75 18.01 1080 188 1.52 0.96 2.5 ARA-12 1.04 0.11 1080 188 0.01 0.01 0.02 CFA/DP 6.50 0.72 1080 188 0.06 0.04 0.10 TSF-07 26.19 2.88 1080 188 0.24 0.15 0.40 INTEC 8.61 0.95 1080 188 0.08 0.05 0.13
Table 14 – Dose Estimates for Co-60 Exposure Based on a Comparison to Screening Values in ECAR-2850.
Location Soil In-situ Gamma (pCi/g) Calculated Plant Concentrati on (pCi/g) ECAR-2850 Minimum soil screening concentrati on (pCi/g) ECAR-2850 Minimum plant screening concentrati on (pCi/g) Soil Resuspensio n Exposure (mrem) Plant Burn Exposure (mrem) Total Fire Event Exposure (mrem)
ARA-12 0.254375 0.01373625 2.02E+03 2.37E+02 0.0013 0.00058 0.00184
CFA/DP 0.576875 0.03115125 2.02E+03 2.37E+02 0.0029 0.00131 0.00417
TSF-07 0.608125 0.03283875 2.02E+03 2.37E+02 0.0030 0.00139 0.00440
Table 15 – Dose Estimates for Ag-108m Exposure Based on a Comparison to Screening Values in ECAR-2850.
Location Soil In-situ Gamma (pCi/g) Calculated Plant Concentrati on (pCi/g) ECAR-2850 Minimum soil screening concentrati on (pCi/g) ECAR-2850 Minimum plant screening concentrati on (pCi/g) Soil Resuspensi on Exposure (mrem) Plant Burn Exposure (mrem) Total Fire Event Exposure (mrem)
Table 16 – Dose Estimates for Sr-90 Exposure Based on a Comparison to Screening Values in ECAR-2850.
Location Soil In-situ Gamma (pCi/g) Calculated Plant Concentrat ion (pCi/g) ECAR-2850 Minimum soil screening concentratio n (pCi/g) ECAR-2850 Minimum plant screening concentrati on (pCi/g) Soil Resuspensi on Exposure (mrem) Plant Burn Exposure (mrem) Total Fire Event Exposure (mrem)
ARA-12 0.55 0.605 4.09E+01 4.76E+01 0.1345 0.12710 0.26158
INTEC 0.72 0.792 4.09E+01 4.76E+01 0.1760 0.16639 0.34243
Table 17 – Dose Estimates for Am-241 Exposure Based on a Comparison to Screening Values in ECAR-2850.
Location Soil In-situ Gamma (pCi/g) Calculated Plant Concentratio n (pCi/g) ECAR-2850 Minimum soil screening concentrati on (pCi/g) ECAR-2850 Minimum plant screening concentrati on (pCi/g) Soil Resuspensi on Exposure (mrem) Plant Burn Exposure (mrem) Total Fire Event Exposure (mrem) TSF-07 0.02 0.000024 1.07E+00 7.96E-02 0.1869 0.00302 0.18993
APPENDIX III: SITE MAPPING
APPENDIX IV: SOIL SAMPLING RESULTS
(This file is a work of an employee of the U.S. Department of Energy, taken or made as part of that person's official duties.) (Wells, 2020)
APPENDIX V: COPYRIGHT RELEASE
Connor Williams <charlie2whisky@gmail.com>
Re: [EXTERNAL] Thesis use permission
1 message
Doug W. Walker <doug.walker@inl.gov> Fri, Feb 19, 2021 at 2:09 PM To: Connor Williams <charlie2whisky@gmail.com>
Conner,
You have my my permission to use any of the graphics, data or text from my thesis. Good luck to you on finishing with graduate school.
Sincerely, Doug Walker
Sent from my Verizon, Samsung Galaxy smartphone Get Outlook for Android
From: Connor Williams <charlie2whisky@gmail.com>
Sent: Friday, February 19, 2021 1:45:11 PM To: Doug W. Walker <doug.walker@inl.gov>
Subject: [EXTERNAL] Thesis use permission
Hey Doug,
This is to ask for your written permission to use the figures relating to the Cesium-137 deposition profile at INTEC from your thesis in my own thesis. Please let me know if that will be alright.
Cheers! Connor Williams
Gmail - Re: [EXTERNAL] Thesis use permission https://mail.google.com/mail/u/0?ik=58009dc509&view=pt&search=all...
LIST OF ACRONYMS
ARA: Army/Auxiliary Reactor Area
AVID: Advanced Visualization and Integration of Data CED: Committed Effective Dose
CERCLA: Comprehensive Environmental Response, Compensation, and Liability Act CFA: Central Facilities Area
CFR: Code of Federal Regulations CPP: Chemical Processing Plant CPS: Counts Per Second
DOE: U.S. Department of Energy
DOE-ID: Department of Energy, Idaho Office EBR-1: Experimental Breeder Reactor - 1
ECAR: Engineering Calculations and Analysis Report EDF: Engineering Design File
EGG: Edgerton, Germeshausen, and Grier, Inc EPA: U.S. Environmental Protection Agency FRD: Field Research Division
HPGe: High-Purity Germanium
IAEA: International Atomic Energy Agency IDO: Idaho Operations Office
INEEL: Idaho National Environmental and Engineering Laboratory INEL: Idaho National Engineering Laboratory
INL: Idaho National Laboratory
INTEC: Idaho National Technical and Engineering Complex LANL: Los Alamos National Laboratory
MDA: Minimum Detectable Activity NNSA: National Nuclear Security Agency PNNL: Pacific Northwest National Laboratory
RESL: Radiological and Environmental Sciences Laboratory RWMC: Radioactive Waste Management Complex
RWP: Radiological Work Permit SCA: Soil Contamination Area
SL-1: Stationary Low-Power Reactor - 1 TAN: Test Area North
TED: Total Effective Dose TEV: Technical Evaluation TSF: Technical Support Facility