The Impact of Amenities on
Housing Prices
An empirical study using the Hedonic Pricing Model
Bachelor’s thesis within economics
Author: Bennerhed, Robin 911114-0332 Isaksson Tieva, Therese 890326-8947
Tutor: Nilsson, Pia
Bachelor’s Thesis in Economics
Title: The Impact of Amenities on Housing Prices Author: Bennerhed, Robin; Isaksson Tieva, Therese
Tutor: Nilsson, Pia
Date: 2015-05-11
Subject terms: Geographical Economics
Abstract
The many stakeholders in property valuation often leads to speculations as the housing prices does not behave as other markets. This paper provides an explanation of the impact of amen-itites on housing prices in Jönköping municipality. The work is based on a hedonic pricing model with influences from Von Thünen’s (1966) idea about city structure and Christaller’s (1966) idea of centralisation. The purpose of the research is to explain the centralisation patterns and the impact of amenites on housing prices in Jönköping municipality through the years 2000-2011. The data include distance to different locations, house characteristics and neighbourhood characteristics in order to accomplish a comprehensive analysis. The results have given us an understanding of how the housing market in Jönköping municipality behaves as a whole and how the different variables work in relation to each other. The final results indicates that Jönköping grow at a relatively slow rate and do not experience conges-tion issues from an increasing populaconges-tion. Our research leads us to believe that Jönköping is close to optimal in size, meaning that inhabitans do not compete for different amenites.
Table of Contents
1
Introduction ... 2
2
Theory ... 3
2.1 Land Use ... 3 2.1.1 Hierarchy of Centralization ... 3 2.2 Amenity Theory ... 42.2.1 Local Public Goods ... 4
2.2.2 Urban Amenities ... 4
2.2.3 Nature-based Amenities ... 5
2.2.4 Historical Amenities ... 6
2.3 Hedonic Pricing Model ... 6
3
Data ... 8
4
Method ... 10
Characteristics of the House ... 10
4.1 Characteristics of the Neighbourhood ... 11
4.2 Accessibility ... 12 4.3 Control Variables ... 12
5
Empirical Result ... 13
6
Analysis... 16
7
Conclusion ... 21
List of References ... 22
Appendix 1 – Descriptive Statistics ... 24
Appendix 2 - Histograms ... 25
Appendix 3 – Robustness Test ... 27
1
Introduction
This study focus on the determinants of housing prices in the municipality of Jönköping in Sweden. In this particular housing market, prices have been steadily increasing during the 21st century, despite the financial crisis of 2008 (Statistics Sweden, 2015), which makes it an interesting case. The central bank’s policy to reach their inflation goal of two percent is achieved by using interest rates as a main tool. The lower interest rates have led to a large increase in household debt, which consist mainly of mortgages. Today we notice a trend where smaller cities lose inhabitants while larger cities expand. The population of Jönköping, for example, grew with 3416 inhabitants between 2010-2013 while 1792 new residencies was established during the time period (Jonkoping.se, 2015). The limited supply of new proper-ties together with low interest rates can explain the general rise in housing prices. Although, the favourable economic climate reflects the higher values of real estate market our focus will be the subjective value of a house which is the basic motivation for the purchasing deci-sion.
In general, the real estate market is very different from most other markets mainly because the house can be seen as fixed in space and time. This makes the location an important factor influencing prices. Also, as it takes time to construct a house, the supply synchronise with the demand differently compared to other markets (Larsson, 2012). The demand side is also very complex as people vary in taste and therefore demand different property characteristics. This leaves us with many potential variables in empirically assessing the price of properties. There are also many stakeholders involved in the real estate market. Besides consumers, real estate companies also try to find the most profitable locations in order to gain on the sale and banks estimate value in order to give out credits. One stakeholder not commonly con-sidered are municipalities attracting new inhabitants and planning for infrastructure. Differ-ent stakeholders contributes to speculations as no common measure of estimating the value of a house exist.
Limited research have been made in smaller cities where specific local attributes determine what makes certain areas more attractive for residential living than others. A lot of research in this area is also limited to a certain type of traits. The traits in the local environment that can bear value on a house are referred to as amenities which can further be separated into different categories. This study incorporates urban amenities including conveniences of liv-ing in a dense area and nature-based amenities such as views or green open space. Lastly, our study incorporates historical amenities, an area relatively new to academic research in terms of housing prices. Municipalities compete for inhabitants by offering better baskets of amen-ities, at the same time inhabitants strive to settle where they achieve the highest utility. In-creasing the knowledge on this subject is thus beneficial in order to asses land and physical planning for infrastructure with regards to location. Jönköping’s municipality expressed an interest in learning more regarding the development of housing prices during the 21st century further motivating this study.
The purpose of the study is to explain the centralisation patterns and the impact of amenities on single-family homes in Jönköping municipality through the time period 2000-2011 and investigate the role played by amenities in explaining price patterns. The research will be conducted on every SAMS (Small Areas for Market Statistics) in Jönköping municipality where Jönköping is considered the primary city (The Central Business District).
2
Theory
2.1
Land Use
The role played by location has long been recognised to be a key factor in explaining resi-dential prices. A theoretical framework to explain the relation between house prices and lo-cation was developed in the early work of Von Thünen (1966). The monocentric city model developed by this author describes a flat homogenous landscape with one central location referred to as the central business district (CBD). According to this framework, land is scarce and agents wants to locate as close to the CBD as possible. This creates a competitive bidding among the agents where the highest rents will be in the CBD and the lowest in the peripheral. This creates a bid-rent curve for each agent displaying the price of land relative to the location where the slope is fixed as transportation cost increases with distance. The bid-rent curve maps the relation between land and distance to the CBD for where each agent is indifferent in settling. The steepest curve will occupy more central locations and rank the accessibility to the CBD. The agent with the highest purchasing power will locate closest to the CBD and vice versa for the agent with the lowest.
William Alonso (1964) extends Von Tühnen’s work in his paper ‘’Location and land use. Toward a general theory of land rent.” Replacing farmers with firms and individuals of households commuting to the CBD in order to work, in contrast to the farmers and firms who bid depending on their profits. Residentials bid according to their income and taste leading to a trade-off between land use and proximity to CBD describing the bidding pattern. As individuals have unique preferences, the allocation is rather complex and land can behave both as a normal and inferior good. Breuckner et al. (1999) studied the settling patterns of individuals with higher purchasing power. The results showed that distance might work as an inferior good if different amenities (discussed in later chapters) are absent. This leads us to the following hypothesis:
H1: Housing prices are negatively correlated with distance to CBD
2.1.1 Hierarchy of Centralization
The monocentric city model has received criticism as it assumes that the location of a city is given and proximity to sub-centres are not explained (Berliant, 1985). Given the homoge-nous space, it is argued that centrality among different locations are distributed on a hierar-chical basis determined by internal economies of scale (Christaller, 1966). Larger cities supply both lower and higher order goods which carry a longer range, whereas the lower order places only supply goods purchased more often. Higher order goods are purchased less fre-quent and are more durable than lower order goods, for example a television or jewellery. Lower order goods have a shorter range and are purchased often, for example newspapers and food. The range implies that there is a maximum distance a consumer is willing to travel in order to acquire a certain good, at some point travel costs outweigh the benefit of the good (King, 1985). Different from Christaller’s view, where the functions in the hierarchy are assigned, Lösch (1944) develops an updated theory where the centralisation originates from a specific firm and the centrality is dependent on the cost-benefit relation. This theory starts from a single industry producing a good to be sold in a region where the good takes on iceberg type of transportation costs. Goods becomes more expensive the further away from the firm it is sold. At one point consumers cannot afford the good implying that there is possible profit for a firm settling closer to the consumer. As a new firm opens up, the
process will be repeated until the area is exactly the size of the initial one, creating the ‘’ideal distance’’ (King, 1985). A study on the performance of the central place theory between Bankeryd and Jönköping shows evidence of no significance. This due to the well efficient transportation system where most people are able to travel fast (Magnusson, 2007). Another force speaking against the theory is technological advancements since today several manu-factured goods are provided online. The theory outlined above also has important implica-tions for housing prices as Jönköping municipality is divided into different sub-centres.
H2: Housing prices are negatively correlated with distance to a larger set of sub-centres.
2.2
Amenity Theory
2.2.1 Local Public Goods
Another key perspective is the role played by various types of amenities in explaining housing prices. Individuals will obviously strive for achieving their first choice of residence, thus lo-cating in communities where they maximise their utility (Tiebout, 1956). However, individual preferences and quality will have a great impact on decision-making as different amenities are demanded. A family may, for example, have a higher tendency to look for a house with a garden and a student might be looking for a cheap central apartment to live in. Besides individual preferences, economic growth and wages are also sources of the observed hierar-chy as the individual with the strongest purchasing power achieves her optimal location (Fu-jita and Krugman, 1999). For example a feature of high-income neighbourhoods, is the con-ception of social status which, in itself, increases the premium as the area is perceived as ‘’high status’’ (Macintyre et al 1993). Looking at the supply side of public goods, communities provide residents non-rival and non-excludable collective goods such as schools or parks, which are also hypothesised as important determinants to housing prices. Communities strive to become optimum in size through offering public goods at the lowest average cost possible. A size larger than optimal will induce agglomeration while a potential lower will induce a centripetal force (Tiebout, 1956). Amenities demanded can be referred to as desir-able features in the surrounding environment capturing part of consumer behaviour in the real estate market. Further, we have divided these amenities into three different types; urban, geographical and historical amenities.
H3: Housing prices are positively correlated with the supply of local amenities.
2.2.2 Urban Amenities
There are several advantages of residing in a dense area. Alongside with higher wages, there is a potential to enjoy a more amenity-rich life outside work. Glaeser (2001) discusses three different variables contributing to urban amenities. First, a variety of local goods and services such as theatres, restaurants and an attractive mix of location specific social patterns which increase the welfare of consumers. The role of proximity to shopping districts have played out its role and service-related products are more demanded (Larsson, 2012). However, scale economies and specialisation advantages in larger cities allows businesses such as retail and restaurants to provide more diverse cuisine and clothing as they have a large enough mass of
consumers (Glaeser, 2001).The wider basket of goods increases welfare of consumers due
to love of variety (Brakman et al, 2009). Urban amenities can also be seen as excludable as individuals can choose which amenities to consume, encouraging businesses to establish ur-ban amenities where there is a demand (Clark, 2004). Assuming that individuals with higher purchasing power cluster due to scale effects, cities will offer a bigger basket of amenities. This idea was developed by Florida in his article ‘’creative class’’ which could be regarded as
a form of human capital (Brakman. et al, 2009). Presence of human capital in a given area leads to ‘’local creativity’’ which is the result of social interaction, authenticity and identity leading to regional growth in the shape of innovation or improvements in capital intensive industries, consistent with economies of scale (Storper and Scott, 2009).
The final two categories include public services and speed of transportation, however Glaeser
(2001) do not provide empirical research and an interpretation on how to measure these urban amenities. The increased consumption benefits are dependent on people coming to-gether which could be measured by the size of the population. Studies differ in how to best estimate how people coming together influence housing prices. Population density as a local amenity have a positive influence on the rents (Roback, 1982) while dense development of residencies influences residential prices negatively (Wu et al, 2004). It is also important to take into consideration negative effects of agglomeration such as congestion problems (Baumol 1967) and increased crime rates which are viewed as disamenities (Roback, 1982; Baumol, 1967; Harrison & Rubinfeldt 1978).
H4: Housing prices are positively correlated with population density up to a certain point and diminishes thereafter.
H5: Housing prices are negative correlated with amount of reported crimes, reflecting low neighbourhood quality
2.2.3 Nature-based Amenities
Another perspective that has received increasing attention in the literature is the im-portance of nature-based amenities in explaining local and regional attractiveness. The beauty of nature is captured not only by green open spaces easily accessible in rural areas but also by views and parks in urban areas.
As the environmental factors itself provide a socio-economic value it is mostly likely adding a premium to the estate (Luttik 2000). The appearance of nature-based amenities firstly gives an aesthetic value, secondly a value in proximity as it is associated with access to na-ture and outdoor activities. The value of nana-ture-based amenities will be determined by the distance and quality and can be divided into permanent open space (POS) and developable open space (DOS) (Bourassa, 2003). The latter include meadows, forests or grasslands with high levels of biodiversity or fragmentation (Geoghegan, 2002). POS include more estab-lished amenities such as views or parks. As the POS can be assumed to be relatively fixed and scarce, one can conclude that higher premiums will be paid for views in proximity to a POS. This can increase the premium up to three times compared to a DOS (Bourassa
2003). Previous researches have shown that lakeside properties have the highest premium where the premium descend as quality and distance to the amenity increase, in addition with the presence of disturbing amenities such as traffic noise or wind turbines tend to im-pact the premium negatively (Luttik, 2000). The amount of green areas an individual can reach by foot will also impact the perception of a green area. The presence of fewer areas will make the inhabitants more sensitive to changes as no substitute exist. (Svanström, 2010). The research gives rise to two hypothesis that can be tested empirically:
H6: Housing prices are positively correlated with proximity to urban green space and diminishes with dis-tance
2.2.4 Historical Amenities
A historical amenity or a heritage from the past will bring different values to the consumer. First, existence value raised for the sake of being a built heritage (Throsby, 2010). Parallels can be drawn to regular supply-demand theory where the supply of historical objects can be seen as minor and restricted to chosen objects. The limited supply will cause excess demand where the owner receives both advantages and disadvantages. The advantage the possessor holds is a unique part of history and tradition, creating a ‘’celebrity effect’’. The disadvantage, concerns responsibility to keep the object in good shape even though changes to the exterior are not allowed. The second value is the option value which is the value raised as a building is expected to become a built heritage in the future. Last is the bequest value raised from the wish to pass a heritage asset to future generations (Throsby, 2010).
The historical object will be unique and create beneficial externalities such as aesthetic or symbolic values to the local area (Throsby, 2010). A historical landmark such as monuments or parks might be protected by the government in order to conserve unique architecture or historical interests where the premium carry very local exogenous effect on the house prices (Koster et al. 2011). Historical buildings are territorial public goods as a lot of people in a geographical area can jointly consume this infrastructure without paying an explicit price. The buildings are instead associated with an implicit price shown in housing prices for the people that live there or in transport costs for people travelling there to consume (Andersson & Andersson, 2006). In addition, historical amenities can through renovation turn into urban amenities (Brueckner, et al. 1999).
H8: Housing prices are positively correlated with the local supply of built heritages.
2.3
Hedonic Pricing Model
There are different characteristics defining the price of a house. The hedonic pricing method is based on product differentiation through attributes or characteristics of goods. This he-donic method allows us to regress the price of the house on characteristics drawn from our theory.
In an empirical study of a hedonic model with price regressed on several characteristics it is very complex to find a feasible solution for a market equilibrium. The reason behind the complexity of the model is the difference in production factors on the supply side and the difference of taste on the demand side.
The issue of the model complexity is analysed in (Rosen 1974) where an equilibrium in this type of model will be located on several dimensions. Rosen claims that the different charac-teristics that comes along with the house be considered bundles of goods and it can therefore be argued that these transactions are equivalent to tie-in-sales. A practice that would state that the producer sells the product on the condition that the customer purchases the other characteristics of the house as well. Certain internal characteristics might also be of less weight to the price. The consumers are also producers and goods purchased are not the finalized good but merely an input to create the ultimate utility maximization of the charac-teristics. Buyers can also gain utility by renovating their home and “making it their own”. However, it introduces a way for us to test our theories empirically by using the formula below:
Where Pit is the observed market expenditure on housing, S are characteristics of the house (age, size,
rooms), N characteristics of the neighbourhood (income level, environment) and A = Accessibility (distance
to Central Business District). Xi represents the corresponding parameter vectors and µ a vector of random
error terms.
Eq (2) only reflects demand. Ideally, an aggregate model should incorporate both supply and demand in determining prices. From our literature review with empirical research, we found that the hedonic pricing model is the most common approach for the real estate market in order to estimate factors contributing to housing prices (Harrison & Rubinfeldt 1978; Goeghegan 2002, Cropper et al, 1988; Nilsson, 2013)
3
Data
The study has been conducted on a fine geographical level where amenity variables are meas-ured at the neighbourhood level referred to as SAMS (Small Areas for Market Statistics). Jönköping consists of 72 SAMS-areas which are used as reference in our study. Moreover, each house purchased in the SAMS-areas are included in our data. The provider of the property data is the Municipal Housing and Development Office and includes single-family homes purchased in the municipality over the years 2000 – 2011 totalling 8319 transactions. Each property transaction is then matched to its corresponding neighbourhood (SAMS). Data to reflect neighbourhood quality and size in terms of median income and density was retrieved from the municipality’s webpage. The number of built heritages in each SAMS was retrieved from The Swedish National Heritage Board (Byggnadsminnesregistret), and this data was assigned the previously used NYKO code (a similar neighbourhood classification mainly used for planning purposes) over areas instead of SAMS which is why we had to match these two manually. The data covering built heritages are limited to independent build-ings and certain historical buildbuild-ings, these were mainly found in areas where single-family homes was non-existent. To solve this we instead took the closest available SAMS that had single-family homes and matched it with quantity of built heritage in a very close SAMS areas. The SAMS areas in central Jönköping is very small leading to residents in neighbouring SAMS being able to enjoy built heritage in other central SAMS areas close by without trans-portation costs. This method was applied in order to solve for few observations and a greater advantage in determining influence of built heritage on housing prices.
Distances to central locations have been calculated according to Pythagoras theorem using location specific SWEREF x and y coordinates for the central location of Jönköping Munic-ipality and each of the largest sub-centres, were distance is calculated as:
𝑙𝑛𝐷𝑖𝑠𝑡 = 𝑙𝑛(√(𝑥1− 𝑥2)2+ (𝑦
1− 𝑦2)2) (1)
SWEREF as a reference system result in distance from each house to centers or amenities in metres.
Including distances in the estimations without logging them would causes problems of het-eroscedasticitysince we experience different variances for subpopulations. Distances to and the size of POS, parks and waterfront are retrieved from the municipality (Areas included in the local preservation program). Distance to POS, parks and waterfront have been calculated in the same way but with a software (ArcView) in order to incorporate closest possible wa-terfront and green space.
Interest rates have been gathered by taking a weighted average of Swedbanks’s flexible rate from the day the house was bought and three months back.
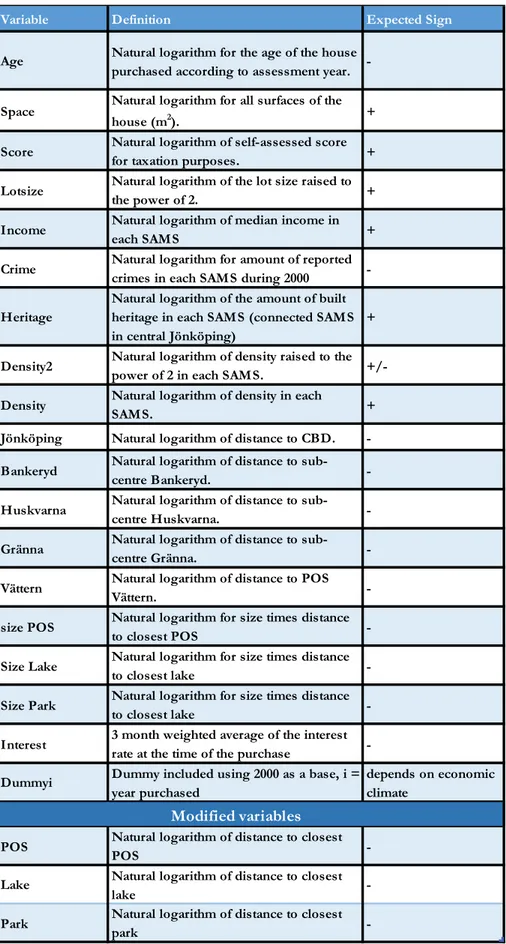
The variables defined in Table 1 was concluded from our research and estimated in our final specification.
Table 1. Summary of hypotheses including variable, definition an expected sign.
Variable Definition Expected Sign
Age Natural logarithm for the age of the house purchased according to assessment year. -Space Natural logarithm for all surfaces of the
house (m2). +
Score Natural logarithm of self-assessed score for taxation purposes. + Lotsize Natural logarithm of the lot size raised to the power of 2. + Income Natural logarithm of median income in
each SAMS +
Crime Natural logarithm for amount of reported crimes in each SAMS during 2000 -Heritage
Natural logarithm of the amount of built heritage in each SAMS (connected SAMS in central Jönköping)
+ Density2 Natural logarithm of density raised to the
power of 2 in each SAMS. +/-Density Natural logarithm of density in each
SAMS. +
Jönköping Natural logarithm of distance to CBD. -Bankeryd Natural logarithm of distance to
sub-centre Bankeryd.
-Huskvarna Natural logarithm of distance to
sub-centre Huskvarna.
-Gränna Natural logarithm of distance to
sub-centre Gränna.
-Vättern Natural logarithm of distance to POS
Vättern.
-size POS Natural logarithm for size times distance
to closest POS
-Size Lake Natural logarithm for size times distance
to closest lake
-Size Park Natural logarithm for size times distance to closest lake -Interest 3 month weighted average of the interest rate at the time of the purchase -Dummyi Dummy included using 2000 as a base, i =
year purchased
depends on economic climate
Modified variables
POS Natural logarithm of distance to closest
POS
-Lake Natural logarithm of distance to closest
lake
-Park Natural logarithm of distance to closest
-4
Method
In Sweden it is common for stakeholders such as banks and real estate brokers to use the sales comparison approach. In this approach, value is estimated by comparing the sales price of similar objects sharing similar characteristics in the same area (Axlund, 1994). However, this method disregards individual preferences, the fact that objects even though similar, rarely share identical characteristics and can give a biased view in smaller regions where house sales happen less frequently. In this thesis we argue that the heterogeneity of the neighbourhoods and the individual properties can better be captured by the hedonic pricing method. Since we include a large sample of properties in our study, the bias is likely to be low. Access to such large samples of data at the disaggregated level allows us to control for several environ-mental factors, besides house characteristics which is expected to further reduce the bias caused by less frequent purchases in certain areas.
Some drawbacks of using the hedonic pricing method is the pre-required knowledge buyers need in order for significant variables to influence the price fully. A disamenity such as noise disturbances and pollution would have a negative influence on housing prices, however, it is not certain that home-buyers are aware of the level of negative externalities before purchas-ing the house. These types of externalities can be very hard to observe and measure empiri-cally. This holds true for amenities as well, since a lack of awareness of the environmental qualities would reduce the value of these variables on housing prices. Therefore, this model assumes perfect information and also that people are able to choose their optimal bundle of characteristics. This is not true in reality due to factors such as limited supply and certain types of buildings in specific areas as city centres in many cases are occupied by apartment buildings. One way that we have filtered this out is by limiting our research to single-family homes. It is virtually impossible to purchase a home in which every demanded characteristic is satisfied, one might want to live close to the city centre but at the same time have a large garden or easy access to nature which rarely reflects reality. There is also a time lag in the real estate market adjusting for changes in local attributes. In Sweden bureaucracy and politicians are shaping the terms for how new properties can be built (Larsson, 2012). This and the fact that it takes time to construct houses implies that the supply can be assumed to be fixed in the short-run.
Selecting variables may cause collinearity problems as variables such as density and distance to central business district could be highly correlated. Also the central areas of Jönköping are all located next to the waterfront making it hard to separate these two attributes. These po-tential problems are addressed by looking at partial correlations between variables and by estimating separate specifications including/excluding variables that are highly correlated to assess robustness. By using the present value approach, future expectations and welfare ef-fects of changes in amenities are capitalized and reflected in land prices preventing omitted variable bias (Wu et al, 2004).
Characteristics of the House
Characteristics related to the house (S) in our model consists of structural variables that typ-ically are included when housing prices are tested empirtyp-ically. A larger lot size and size of the house have generally been shown to have a positive influence on the price. Studies have also argued that since the age of the house is also related to quality of structure, this leads to newer houses contributing positively to the price of the house (Harrison & Rubinfeldt 1978; Goeghegan 2002, Cropper et al, 1988). Therefore, we have chosen to include lot size and one variable capturing the size of both the living area and other surfaces of the house such as a basement and garage. A larger lot can at some point become a burden as more work is
needed in order to maintain a nice condition, therefore the squared form of lot size is tested in the model to control for non-linear effects.
The year the property was built usually determines the assessment year and age of the house, however if the house has been largely renovated it can be difficult to capture the effect of age and quality since this would require controls which we don’t have access to. This means that the age effect need to be interpreted with care. The standard of single family homes are measured in terms of number of standard points reflecting quality of building materials and equipment with regards to exterior and interior characteristics. This variable is self-reported (by the owner) and is used to determine the tax assessment value. As the score is self-reported there are potential bias problems, however, reporting a false score can result in consequences for the owner. We have included a variable defining the age in terms of the assessment year of the house and the standard points for each house. The category in which a real estate belongs to also affects the price, however our study is delimited to the study of detached single-family homes which is why other categories are excluded.
4.1
Characteristics of the Neighbourhood
As discussed, individuals with stronger purchasing power (income level) have an advantage when it comes to settling in areas with high neighbourhood qualities (Fujita & Krugman, 1999), hence we assume that the variables reflecting high neighbourhood quality are associ-ated with a higher price of housing. To control for this, we have included a variable of median income for each neighbourhood.A common factor of the benefits and the positive influence of urban amenities is density, which is why we chose to capture the effect of urban amenities by incorporating the population density of each neighbourhood. Density can also become a disamenity as it raises external costs to a society with increased crime and congestion prob-lems (Ceccato & Wilhelmsson, 2011). Increased density in connection to public goods mean that more people have to share the benefits of the existing public goods in the area. Review-ing the literature leads us to a variable where total external costs will vary not only in propor-tion with density but also with its squared covariate (Baumol, 1967), which is why we will test for both the amenity and disamenity effects associated with density. Measuring density according to population per SAMS includes all people in an area as we also want to take into consideration the social benefits of residing in a denser area. An income density measure would not incorporate this and could cause bias in measuring urban amenities. There is only a small portion of goods a person will consume to gain utility despite earning a higher in-come.
To further control for neighbourhood quality, the number of reported crimes per 100 inhab-itants is included among the variables.
The added premium to sales price of historical amenities is measured by number of regis-tered built heritages in each SAMS, this because we predict that the benefit gained will be very local, as is true also for the other amenities included in our study. However, we do not take the history behind or subjective quality of the heritages in consideration, although it will most likely impact the effect. For instance, living close to the Eiffel tower might add a premium to the sales price while proximity to Auschwitz will give a negative impact, yet both would be considered and registered as historical objects. Hence, a drawback is the dif-ficulties to measure the subjective value of cultural heritage. Individuals adding a senti-mental value to a historical amenity will most likely value it higher than other people and cannot be controlled for. Furthermore, the age of a house is disregarded in the context of reflecting historical value because of possible renovations.
4.2
Accessibility
In our model, accessibility is measured in terms of distance to different centres and proximity to nature-based amenities. In order to interpret the value of accessibility we proxy it by the straight line distance as described above. Although the opportunity cost of residing further away from a centres can be seen as marginal, lower bound amenities are provided in several locations outside the CBD making distance to any sub-centre most likely to have an impact. Furthermore sub-centres will most likely have lower levels of congestion. Therefore, three different sub-centres in addition to the CBD was picked by descriptive statistics where SAMS was plotted against sales price. Husqvarna, Bankeryd and Gränna was chosen. Other towns such as Taberg or Tenhult was disregarded as outliers causing a spike in housing prices was not found and will most likely be insignificant in a model. As discussed previously, distances to different centres was calculated by using Pythagoras theorem on SWEREF x and y coor-dinates according to Equation 1. A flaw of this method is that the straight line will not show the real time and monetary cost of transportation. Calculating the real path would be very extensive work and does not necessarily reflect the actual path chosen by inhabitants. Previ-ous studies have argued that the straight line distance is a good proxy for walking distance in the study of local amenities and house prices (Thériault et al 2004, Nilsson, 2014).
Since size will determine congestion and distance likelihood of using the amenity an econo-metric approach was used where distance and size was multiplied in order to get a more precise measure. The marginal effect of this variable is expected to be larger in places where the supply of nature-based amenities are smaller. Forests or fields are easier accessed in a small towns and proximity to nature is scarce in big cities because of dense development. As Bourassa (2003) pointed out, urban green space do not only give an aesthetic view value, but also proximity to nature and the possibility to engage in outdoor activities.
As an extensive amount of houses are built in proximity to lake Vättern it is rather inevitable to avoid the impact of the lake. Therefore, distance to lake Vättern was given its own variable but is most likely correlated with distance to CBD. A drawback of the Vättern variable is that proximity does not explain the quality of the view, since the view can be blocked by other houses or by features in the geographical landscape, which we are unable to control for in this study.
4.3
Control Variables
We also include a set of variables to control for temporal influences during the studied time period in terms of interest rate and year dummies. A higher interest rate indicate a higher cost of purchasing a house which is why this this is expected to affect housing prices nega-tively. Swedbank’s flexible rate was chosen due to its direct effect on consumers purchasing a house, in contrast to the Swedish Central Banks’ rate which reflects the general interest rates of the economy. Dummies are included for every year using 2000 as a base.
Last but not least, a robustness test was made substituting housing price for lot price as dependent variable. The variable describes the values of land where no building is con-structed. By using lot price, instead of housing price we can also control for potential biased-ness caused by housing characteristics. This will also indicate whether our coefficients are stable or not. In addition, an advantage of performing the test and isolating the different house characteristics can possibly give amenities a higher influence on the price.
5
Empirical Result
The regression was made according to the hedonic model using the natural logarithm of the sales price of the house as dependent variable estimated in SEK. Each category was added stepwise, starting with house characteristics, followed by neighborhood characteristics and last distance to central areas and amenities. Control and dummy variables were included in every regression.
Table 3 illustrates the regressions conducted in order to achieve the final model. The value within the parenthesis is the standard error, and the one above that is the standardized beta coefficient1. Specification 1 contains characteristics of the house (Sit), characteristics of the neighborhood (Nit) was added in specification 2 and distance to amenities and central areas (Ait) in specification 3. The final specification is a modified, estimated model achieved by looking at partial correlations between variables and including/excluding variables in order to improve the fit and exclude insignificant variables. Specification 4 demonstrated the high-est R square, lowhigh-est AIC and bhigh-est model fit (Table 2). In addition VIF was thigh-ested where distance to Gränna scored the highest value (4.31). Hence, multicollinearity does not seem to prevent the interpretation of the results.
Equation for the fourth estimated specification:
𝑙𝑛𝑃𝑖𝑡=𝛽0+𝛽1(𝐴𝑔𝑒)𝑖𝑡+𝛽2(𝑆𝑝𝑎𝑐𝑒)𝑖𝑡+𝛽3(𝑆𝑐𝑜𝑟𝑒)𝑖𝑡+𝛽4(𝐿𝑜𝑡𝑠𝑖𝑧𝑒)𝑖𝑡+𝛽5(𝐼𝑛𝑡𝑒𝑟𝑒𝑠𝑡)𝑖𝑡+𝛽6(𝐻𝑒𝑟𝑖𝑡𝑎𝑔𝑒)𝑖𝑡+𝛽7(𝐼𝑛𝑐𝑜𝑚𝑒)𝑖𝑡+
𝛽8(𝐷𝑒𝑛𝑠𝑖𝑡𝑦2)𝑖𝑡+𝛽9(𝐽ö𝑛𝑘ö𝑝𝑖𝑛𝑔)𝑖𝑡+𝛽10(𝐺𝑟ä𝑛𝑛𝑎)𝑖𝑡+𝛽11(𝑉ä𝑡𝑡𝑒𝑟𝑛)𝑖𝑡+𝛽12(𝑃𝑂𝑆)𝑖𝑡+𝛽13(𝐿𝑎𝑘𝑒)𝑖𝑡+𝛽14(𝑃𝑎𝑟𝑘)𝑖𝑡+𝜀
Table 2. Regressions including standardized beta and standard error in parenthesis. * indicates 1 % level
of significance; ** 5 % level of significance; and *** 10 % significance level. All variables are logged besides
interest rate and dummies and the specifications contain 8319 observations.
Variable Specification 1 Specification 2 Specififaction 3 Specification 4
Age 0.461* (0.005) (0.005) 0.495* (0.005) 0.498* (0.005) 0.495* Space 0.278* (0.020) (0.021) 0.207* (0.020) 0.177* (0.020) 0.173* Score 0.100* (0.036) (0.034) 0.100* (0.033) 0.100* (0.033) 0.101* Lotsize2 -0.146* (0.004) -0.043* (0.005) -0.019*** (0.005) (0.005) -0.014 Crime - 0.039* (0.005) (0.007) 0.002 - Heritage - 0.043* (0.010) -0.074* (0.017) -0.066* (0.016) Income - 0.171* (0.032) (0.038) 0.069* (0.032) 0.085*
Density - N/A N/A -
Density2 - 0.169* (0.002) (0.003) 0.046* (0.003) 0.045* Jönköping - - -0.194* (0.013) -0.173* (0.012) Huskvarna - - -0.020*** (0.011) - Bankeryd - - -0.000 (0.013) - Gränna - - -0.113* (0.018) -0.098* (0.017) Vättern - - -0.103* (0.10) -0.130* (0.007) Size POS - - -0.001 (0.005) - Size Lake - - 0.026* (0.003) - Size Park - - 0.005 (0.005) - POS - - - 0.008 (0.008) Lake - - - -0.043* (0.008) Parks - - - -0.007 (0.008) Interest -0.341* (0.009) N/A N/A -0.344* (0.008) Dummy_2011 0.165* (0.027) (0.032) 0.320* (0.031) 0.320* (0.025) 0.165* Dummy_2010 0.025** (0.028) (0.031) 0.279* 0.280* (0.030) 0.022** (0.026) Dummy_2009 N/A 0.278* (0.031) 0.279* (0.030) N/A Dummy_2008 0.235* (0.032) (0.031) 0.232* (0.030) 0.237* (0.029) 0.236* Dummy_2007 0.209* (0.030) (0.031) 0.236* (0.030) 0.235* (0.028) 0.210* Dummy_2006 0.015 (0.025) (0.031) 0.197* (0.030) 0.189* 0.016*** (0.023) Dummy_2005 -0.095* (0.025) (0.031) 0.120* (0.030) 0.124* -0.077* (0.023) Dummy_2004 -0.033* 0.028) (0.033) 0.105* (0.032) 0.106* -0.030)* (0.026) Dummy_2003 0.021** (0.031) (0.034) 0.078* (0.033) 0.077* 0.021** (0.029) Dummy_2002 0.051* (0.035) (0.034) 0.052* (0.032) 0.052* (0.032) 0.056* Dummy_2001 0.006 (0.033) (0.034) 0.036* (0.033) 0.030* (0.031) 0.001 Model fit R Square 0.457 0.496 0.534 0.535 F 466.7 429.6 351.6 397.0
All the variables in the final model were significant at a 10 percent level besides dummy for 2001, lotsize, POS and Park. From our original model only Gränna was a significant sub-center while Bankeryd and Huskvarna was dropped due to insignificance. Plotting the hous-ing prices with SAMS demonstrated price spikes in these areas but these could be captured in the first hypothesis, distance to CBD and Vättern due to correlation. Gränna was the only sub-center that was negatively correlated with Jönköping and is more isolated from drawing benefits of being located close to CBD.
In data measuring urban amenities, Density2 was significant while we decided to exclude Density from the model, since these variables showed perfect correlation. Running the re-gression in SPSS including both variables always led to one being excluded due to collinearity problems. Crime showed no significance when added to the last step of the empirical mod-elling. Income showed strong negative correlation with the amount of reported crimes. The explanation factor for housing prices could thus be captured by using only the variable for median income since studies have shown that areas with lower income tend to have more reported crimes. One unexpected result on the other hand was the strong positive correlation Crime had with Bankeryd. However, this can also be connected to median income as the SAMS areas around Bankeryd have high median income. From this we can also argue that median income can explain some of the spikes of housing prices in connection to Bankeryd. Another factor explaining the insignificance of crime is the potential bias of crimes being unreported. According to Skogan (1977) the pool of unreported crime consists mainly of minor property offenses.
The measures concluded in our method for geographical amenities where size of amenity is multiplied by distance to the amenity in order to account for both proximity and congestion showed no significance. Variables in this form are also harder to interpret; when it comes to proximity the sign should be negative, while size would influence prices positively. These variables was disregarded in the final model and replaced by distance to the closest nature-based amenity.
Including both Gränna and supply of built heritages might be problematic as the same impact might be explained by one of these variables due to high correlation. The dataset for supply of built heritages had few observations in SAMS areas which makes it hard to achieve normal distribution of this variable. The empirics does however show that both variables are signif-icant in the model. In addition, a robustness test of the final regression was conducted where House Price was replaced with Lot Price, the natural logarithm of lot price for each sale (see Appendix 3 - Robustness Test).
6
Analysis
Land Use
First we have chosen to start the analysis by looking at the different hypothesis drawn from previous studies and our theory. The model indicates that Jönköping municipality is mo-nocentric, the impact of distance to Jönköping is independent from the amount of variables included and most sub-centres were insignificant. The relation between median income and distance to CBD which are the corner stones of the monocentric city model are negatively correlated, meaning that individuals with a higher purchasing power tend to locate closer to the CBD and occupies the houses closer to the city center which have a higher housing price. Along with this, several house characteristics are positively correlated with distance to Jön-köping. This could indicate that certain individuals can see distance to CBD as an inferior good and compensate the transportation costs with a higher degree of housing consumption. This reasoning results from most housing characteristics tendency to increase with distance from CBD, even though these result was fairly marginal. On the other hand, the negative correlation between housing prices and distance to CBD shows that the influence is strong. The results get additional support from the robustness test, where the characteristics of the house lost its importance and the variable Jönköping became more significant. Due to this we do not reject H1.
Moving on to hierarchy of centralization, Jönköping municipality do consist of several other towns which from Lösch’s ideal distance perspective shows evidence of the central place theory. The different towns provide goods on different levels of internal economies of scale which also impact the significance of the monocentric city model. This means that from a business perspective, the central place theory is valid. When it comes to explaining the impact on housing prices, our results supports the idea of Magnusson (2007) that distance and con-gestion problems can be seen as nonexistent. Because of this, proximity to a sub-centre can be seen as fairly insignificant and has no effect on housing prices. An interpretation is that the municipality do not experience congestion which is the solitary reason for the existence of sub-centers. Distance to Bankeryd and Huskvarna received insignificant results due to proximity to CBD. We concluded that the premium in housing prices in areas connected to Bankeryd are filtered out by controlling for neighborhood characteristics. As both amount of reported crimes increased heavily with distance to Bankeryd and median income decreased with distance to Bankeryd, this can be perceived as one of the ‘high status’ neighborhoods discussed in Macintyre et al. (1993).Gränna which is located approximately 40 kilometers away from CBD, on the other hand, gave significant results supporting the criticism to the monocentric city model. Because of the long distance between Gränna and Jönköping this town benefits more from providing local goods to its inhabitants and Gränna has a negative impact on housing prices and only marginal differences in the robustness test. However, as we will discuss below the premium in Grännas housing prices can be explained by other factors. We can conclude that our data for central place theory in Jönköping does not support this hypotheses for this particular housing market, since two sub-centers were dropped due to insignificance. Further discussed, there are other factors in relation to distance impacting prices in the sub-centres of Jönköping municipality, hence we reject H2.
Amenity theory
From the amenities included in our final model, all but two were significant in explaining housing prices. Overall, the amenities do not show a heavy impact on housing prices in re-lation to factors such as characteristics of the house, characteristics of the neighborhood and interest rate. Amenities gains significance and impact in the robustness test using lot price. Amenities are characterised by consumer preferences where every individual have a different taste when it comes to what specific amenities they value the most. This could explain why the actual values are small as they get diluted by this variance in taste. The results, however, are of significance and most of the amenities do show the signs expected thus data give support for H3.
The resulting measurement for urban amenities from our theory consisted of density and crime rates as a disamenity originally, however crime rate was dropped due to insignificance and correlation with median income. Testing H5 was therefore found to be problematic. The result was significant for Density2, but did not influence housing prices to a large extent in comparison to other variables. We cannot reject H4 despite the impact of Density2 being very minor on housing prices. This could be an indicator that the overall size of Jönköping is reaching the peak for people to enjoy the benefits of coming together as density will be-come a disamenity when reaching a critical value. It could also mean that inhabitants of Jön-köping do not value the advantages of residing in a dense area, and that the city does not attract people gaining utility from living in highly populated areas. However we discussed before, distance to CBD is negatively correlated with housing prices further supporting the first part of our hypothesis that population density is positively correlated with population density in Jönköping as the densest areas are in and around CBD. Furthermore, the explicit price of travelling to enjoy urban amenities in Jönköping could be lower than the implicit price of purchasing a house in Central Jönköping and inhabitants can thus locate a bit further away without losing the benefits of urban amenities in denser areas.
It might be the case that density has not yet become an issue in Jönköping arguably because it is a relatively small city when it comes to population size. The empirical studies discussed earlier covered larger cities in the United States. Growth of sub-centers are according to Christaller dependent on how congested a city is. Since the density practically have no impact on the sales price, we can see Jönköping as a city with no congestion and people have the possibility to reach sub-centers fairly easy because of the efficient transportation system. Par-ticularly Huskvarna and Bankeryd that can be reached by trains in a matter of minutes. The low significant value of density can be seen as a measurement of Tiebout’s theory about optimal sizes. The beta of density equals 0.045 therefore the municipality face in general optimal size and the existing competition of amenities can be seen as non-existent. The ur-banisation process in Jönköping can be considered minor in relation to metropolitan areas experiencing a much more rapid growth. Because this process is slower in Jönköping, the municipality have a better opportunity to adapt supply of local public goods with resulting demand of an increasing population. However, on a local level SAMS in connection to Vät-tern seem to be of higher density and also have the highest housing prices. These particular areas can be taken as larger than optimal, and the centrifugal force operates through higher housing prices. However, these forces only operates around Vättern. Proximity to other lakes or parks are nearly insignificant. Parallels can be drawn to the ‘’celebrity effect’’ when it comes to Vättern as a POS which can never expand in size.
Generally, nature-based amenities was found to be the category that influenced housing prices more than the other amenities measured, however the various measurement gave
mixed results. Distance to DOS was insignificant in our model along with Park. By this ar-gument we would reject H6 as the variables for proximity to urban green space does not add significance in explaining housing prices in Jönköping. The difficulties behind these variables can be explained by our correlation matrix2. Jönköping is negatively correlated with distance to DOS and positively correlated with distance to closest park. Proximity to central areas of Jönköping, a smaller lot size and higher density characterizes proximity to parks, and the other way around for Jönköping. Meaning in our case, proximity to urban green space could be captured in Jönköping along with other variables making it impossible for us to analyse the results. It is logical that a DOS is located in the rural areas outside of Jönköping. Disre-garding the low significance level, a DOS seem to be positively influencing housing prices in these areas only slightly in accordance with Bourassa (2003) but as mentioned before the insignificance of these variables forces us to reject the hypothesis. While proximity to green-space cannot be used to explain housing prices in Jönköping, proximity to waterfront was found to be more successful. Both Vättern and Lake was significant for the model and showed that the closer a house is to the waterfront the higher the premium thus we cannot reject H7.
The measures concluded in our method for geographical amenities where size of amenity is multiplied by distance to the amenity in order to account for both proximity and congestion showed no significance. Variables in this form are also harder to interpret, when it comes to proximity the sign should be negative, while size would influence prices positively. In our previous hypothesis we have already concluded that density is not an issue in Jönköping since it is a relatively small city which can explain the insignificance of measuring nature-based amenities in this form. Distance to Vättern was negative and significant giving support to the hypothesis that proximity to nature-based amenities have a positive influence on the price. Supply of built heritage indicating historical amenities was significant but showed a different sign that expected as it was negatively correlated with housing prices. Built heritage showing a marginal negative impact, could depend on two reasoning. First, the obligations of main-taining a built heritage and the required work to keep the amenity in a restricted shape might decrease the demand. Secondly, the subjective value is too low and the ‘’celebrity effect’’ is non-existent. An emphasis to be made is the strong negative correlation between distance to Gränna and built heritage meaning most built heritage is found in this town. Gränna’s per-ceived cultural status is dependent on its supply of built heritages which could lead to people valuing these choosing to live here. Including both distance to Gränna and supply of built heritages could therefore be problematic as the same impact can be explained by one of these variables. The dataset for supply of built heritages had few observations in selected SAMS areas making it hard to achieve normal distribution of this variable. The empirics does how-ever show that both variables are significant in the model.
Besides few observations the dataset values on historical objects hold a strong subjective value which makes it difficult to interpret the data. As discussed earlier there is a big differ-ence between living close to Auschwitz and the Eiffel tower. We have no subjective values of the built heritage included in our data allowing us to argue that there are no historical buildings or monuments in Jönköping that has significance to be commonly known on a national level. Furthermore, high amounts of built heritage are located in a suburb of Jönkö-ping as opposed to a neighbourhood making transaction costs to reach the primary city too high. Applying the influence of historical objects on housing prices on another city with neighbourhoods that carry these characteristics such as Stockholm and measuring historical
objects on a more subjective level could give rise to interesting research. Our empirical result and the reasoning above leads us to reject H8; housing prices are not positively correlated with the supply of built heritages.
House Characteristics
Analysing the remaining variables included in characteristics of the house the result gave us some unexpected results. Lot size was negatively correlated with housing prices and Age positively correlated. All the variables were significant to the model at a 95 % interval besides lot size. The reason behind this result could be the high prices in the central areas of Jönkö-ping where lot size is limited due to space. Lot size tend to increases with distance to central business district, and less dense areas. Lotsize also have a negative impact on the housing price. The benefit of a larger lot size will most likely diminish with size as a larger lawn would imply more work to keep it proper. At one point the benefits is overweighed by the cost of maintaining it.
One possible explanation to the age of the house showing a positive value could be that new construction is limited while housing prices increase throughout the years. The average score of the house measures the quality of the property. Together with Space it explains a large fraction of the individual preferences and needs an individual must satisfy before other amen-ities will be of interest. We can conclude this since these variables move fairly independent from the different amenity variables.
Land Use and Distance
Breuckner et al. (1999) allows us to demonstrate one difficulty concerning utility maximiza-tion and distance which works as both a normal and an inferior good. Individuals with higher purchasing power will either locate in the city center, or close to other amenities. Individuals located in the city benefit from various urban amenities and sees distance as a normal good. Individuals choosing to reside away from the CBD demand certain house characteristics that cannot be found in the CBD, such as a larger house or lawn. Hence other variables are determining the housing prices for regions outside CBD. People here see distance as an in-ferior good and compensate the longer distance with several amenities, such as a view of Vättern or parks and other lakes. This pattern does partly support the results in Fujita and Krugman (1999) and Breuckner, et al (1999) who sees economic growth and wage growth as the source of hierarchy of housing selection.
Areas further away from the city centers which are smaller than optimal try to attract new people, where the agglomeration force works through compensation in a larger house, lawn, or other amenities. In cases where the city center provide the same amenities as the peripheral locations, these will be occupied by individuals with a higher purchasing power and areas in the peripheral will be occupied by people with ’lower income’. However, this effect cannot be seen as very strong as earlier been mentioned the opportunity cost of residing away from the CBD is very low.
Continuing the discussion about land use as both a normal and inferior good, interesting reflections can be drawn to Age. The peripheral of the municipality has expanded throughout the years and houses built 50 years ago could today be a part of the urban centre instead of the periphery. By assuming that the size of the municipality was smaller before we can con-clude that the city was smaller than optimal and the competition for accessibility and amen-ities was on a lower level. This implies that relatively more houses could be built in proximity to CBD as well as to amenities compared to today. As the municipality’s peripheral expand, the older houses becomes a part of the urban centre. Age is also positively correlated with
most housing characteristics, meaning older houses are larger. This means that the owners are able to have a high degree of housing consumption and also enjoy low transportation cost in proximity to CBD. This development gives individuals few reasons to relocate mak-ing the availability of these types of houses low on the market, further increasmak-ing prices. Areas such as Bäckalyckan and Bymarken, the areas where houses are the most expensive, could fall into this category.
Controls
Interest rate, as expected, have a strong negative correlation with housing prices and is sig-nificant to the model. There were several attempts of running the regression that resulted in interest rates being dropped from our model. A possible explanation is high correlation be-tween interest rates and yearly dummies. When not including interest rates the dummy vari-ables showed a steady increase in housing prices which is what we would expect. Including interest rate in our regression that controls for general economic climate such as inflation and unemployment gave different results. We believe that including both dummies and the interest rates allows us to better interpret the effect of economic fluctuations in our dummy variables included for each year. The dummy variables indicates that housing prices in Jön-köping tend to follow economic fluctuations in the sense that downturns leads to increased positive influence on housing prices. During downturns the central bank also decrease inter-est rates in order to stimulate the economy. The years of the financial crisis 2007-2008 was shown to influence housing prices more heavily in relation to other years arguably because the housing market is viewed as a safe investment. The recovery from the crisis was inter-rupted in 2011 due to the fact that several European countries inability to manage their fi-nances was revealed. This is reflected in the dummy variable for 2011 where people were inclined to invest in the real estate market once again.
7
Conclusion
In this paper we have researched housing prices from a hedonic perspective including char-acteristics of the house, charchar-acteristics of the neighborhood and distances to local amenities. The impact of proximity and amenities seem to be a second priority for house buyers, as interest rate and the different house characteristics have higher priority in relation to ameni-ties.
Density seem to be a common factor in explaining the results. The relatively small city of Jönköping only observe marginal congestion. Since the city is close to optimal in size, there is not only easy to access a diverse amount of amenities, but also low competition for the once available. This means that most houses can benefit from the same amenities independ-ent from location. Combining this with the efficiindepend-ent transportation system and the existence
of different sub-centres makes it easy to live anywhere in the municipality and enjoy easy
accessibility to amenities. Access to public transportation from each house can influence the house of the price. Further studies incorporating this factor would therefore be of great in-terest. The results would most likely look very different in a larger city, where transportation to CBD actually is more inconvenient and there is a higher competition for amenities. There-fore, another point is to perform a similar research on a larger city where the contrasts be-tween the center and the periphery would most likely be stronger and where people are more dependent on public transportation.
Our results show that amenities can explain housing prices to a certain extent. Proximity to waterfront, in particularly Vättern, a nature-based amenity was proven to have the largest impact on housing prices in Jönköping municipality. Vättern is different from the other
amenities as it existence cannot be replaced by another water front. Other amenity variables
of significance showed very little effect. This points to urban and historical amenities playing a less central role when determining housing prices in the municipality.
A positive aspect about this paper is the comprehensive research capturing the impact of a wide amount of variables, and an analysis on how they relate to each other. Nevertheless, this is also the negative aspect of the paper as we have not dug deeper into the impact of different individual amenities. Hence this is an option for further research, especially to an-alyse the impact of historical amenities as conditions for this is not optimal in Jönköping.
Historical amenities had a slight negative influence on housing prices as opposed to expected. Our observations of built heritages in the municipality was placed mainly in Gränna located far from CBD and was short on information about subjective values of the buildings. Re-search of historical amenities might benefit from being conducted in a city that has a more cultural profile where data has some sort of subjective value.
Urban amenities was measured in terms of density and indicated that the positive effects of density in Jönköping was minor and that the city is at its optimum level in concern to what is beneficial for its inhabitants. Using density to measure the advantages of residing in an urban area can be considered a secondary measure of research that can be performed directly. One way of assessing urban amenities differently is looking at amount of various service industries in the area. This can motivate further research of urban amenities in Jönköping municipality that possibly yields greater results.
List of References
Andersson, Åke E. and Andersson, David E. (2006). The Economics of Experiences, Arts and Entertainment. Cheltenham, UK & Northampton, MA: Edward Elgar Publishing.
Alonso, William. "Location and land use. Toward a general theory of land rent." Location and land use. Toward a general theory of land rent. (1964).
Axlund, Anders ”Ortsprismetoden -en analys av rättstillämpningen” (1994:2). Lantmäteriet
Baumol, W. J. (1967). Macroeconomics of unbalanced growth: the anatomy of urban crisis. The American economic review, 415-426.
Berliant, M. (1985). Equilibrium models with land: A criticism and an alternative. Regional Science and Urban Economics, 15(2), 325-340.
Bourassa, S. C., Hoesli, M., & Sun, J. (2003). What's in a view?. FAME Research Paper, (79). Brakman, S., Garretsen, H., & Van Marrewijk, C. (2009). The new introduction to geographical economics. Cambridge University Press.
Brueckner, J. K., Thisse, J. F., & Zenou, Y. (1999). Why is central Paris rich and downtown Detroit poor? An amenity-based theory. European Economic Review, 43(1), 91-107.
Christaller, W. (1966). Central places in southern Germany. Prentice-Hall.
Ceccato, V., & Wilhelmsson, M. (2011). The impact of crime on apartment prices: Evidence from Stockholm, Sweden. Geografiska Annaler: Series B, Human Geography, 93(1), 81-103. Clark, T. N. (2004). Urban amenities: lakes, opera, and juice bars: do they drive develop-ment? Clark, Terry Nichols (2004) The city as an entertainment machine. Research and urban policy, 9, 103-140.
Cropper, Maureen L., Leland B. Deck, and Kenenth E. McConnell. "On the choice of func-tional form for hedonic price functions." The Review of Economics and Statistics (1988): 668-675.
Fujita, M., Krugman, P., & Mori, T. (1999). On the evolution of hierarchical urban systems. European Economic Review, 43(2), 209-251.
Geoghegan, J. (2002). The value of open spaces in residential land use. Land use policy, 19(1), 91-98.
Glaeser, E. L., Kolko, J., & Saiz, A. (2001). Consumer city. Journal of economic geography, 1(1), 27-50.
Harrison, David, and Daniel L. Rubinfeld. "Hedonic housing prices and the demand for clean air." Journal of environmental economics and management5.1 (1978): 81-102.
Jonkoping.se, (2015). Bostadsstatistik - Jönköpings kommun.
King, L. J. (1985). Central place theory. Regional Research Institute, West Virginia University Book Chapters.