Do Dynamic Capabilities influence the
Growth of Start-Ups?
A Study within the German E-Commerce Sector
Master‘s thesis within MSc in Strategic Entrepreneurship
Author: Michael Kreutz
Matthias Henrichs
Tutor: Massimo Baù
i
Master’s Thesis in Business Administration
Title: Do Dynamic Capabilities influence the Growth of Start-Ups?
A Study within the German E-Commerce Sector Authors: Michael Kreutz & Matthias Henrichs
Tutor: Massimo Baù
Date: 2015-05-11
Subject terms: dynamic capabilities, growth, new firm growth, e-commerce; strategic management
________________________________________________________________________
Abstract
Purpose - The purpose of this thesis to investigate the influence of dynamic capabilities on
growth in start-ups within the e-commerce sector.
Methodology - Findings were derived from both secondary and primary sources, namely
an extensive literature review and a data set consisting of 73 German e-commerce start-ups. The data were collected through surveys with founders and members of the management teams.
Findings - The key findings reveal no significant influence of the tested dynamic
ties on start-up growth. Further, findings indicate that the dimensions of dynamic capabili-ties, which influence growth in established firms, might not be applicable to start-ups. Thus, this thesis proposes to modify the conceptualization and perspective of dynamic ca-pabilities in the context of start-up firms.
Key terms – dynamic capabilities, growth, new firm growth, strategic management,
ii
Acknowledgements
We would like to thank all the people who have supported and inspired us during the last month of writing this thesis.
First of all, we would like to express our gratitude to our supervisor Massimo Baù for the useful comments, remarks and engagement through the learning process of this master thesis.
Also, we would like to thank the participants in the survey, who have willingly shared their precious time for our research.
Finally, we would like to thank our loved ones, who have supported us throughout the en-tire process, both by keeping us harmonious and helping us putting pieces together. We will be grateful forever for your love.
Michael Kreutz & Matthias Henrichs Jönköping International Business School
iii
Table of Contents
1
Introduction ... 3
2
Theoretical Framework ... 5
2.1 Firm Growth ... 5 2.1.1 Entrepreneurial Growth ... 6 2.2 Dynamic Capabilities ... 72.2.1 The Resource Based View ... 8
2.2.2 Dynamic Markets and Routines ... 10
2.2.3 Strategic Processes in Entrepreneurial vs. Established Firms... 11
2.3 Dynamic Capabilities in E-Commerce ... 11
3
Hypothesis ... 14
3.1 Technology Capabilities ... 14 3.2 Business Capabilities... 15 3.3 Network Capabilities ... 164
Methodology ... 18
4.1 Research Philosophy ... 18 4.2 Research Approach ... 18 4.3 Research Purpose ... 19 4.4 Research Strategy ... 20 4.5 Time Horizon ... 214.6 Sample and Data Collection ... 21
4.6.1 Sample Description ... 21
4.6.2 Data Collection... 23
4.6.3 Measures ... 24
4.6.4 Reliability of Data ... 26
5
Analysis ... 27
5.1 Normal Distribution Test ... 27
5.2 Correlation Analysis ... 28
5.2.1 Kendall‘s-Tau Correlation Test ... 29
5.2.2 Summary Findings of Correlation Analysis ... 30
5.3 Factor Analysis ... 31
5.4 Linear Regression Analysis ... 33
5.5 Table 12:Results Regression Analysis ... 34
6
Discussion ... 35
6.1 Exploring potential causes ... 36
7
Conclusion ... 39
7.1 Implications for Theory ... 39
7.2 Implications for Practice ... 39
7.3 Limitations and further research ... 39
8
References ... 41
1
List of Figures
Figure 1: Thesis Structure………..…….5
Figure 2: A conceptual framework for testing the impact of dynamic capabilities…… on firm growth ………16
List of Tables
Table 1: Dimensions and Indicators of Dynamic Capabilities………..…14Table 2: Summary Descriptive Statistics……….…….….23
Table 3: Firm Cluster by Turnover & Employee Growth Rate……….…...24
Table 4: Sample Firms by Location……….…….25
Table 5: Dimensions of Dynamic Capabilities for E-Commerce Firms………27
Table 6: Cronbach's Alpha Test with all 24 Items………29
Table 7: Normal Distribution of the Dimension ……….30
Table 8: Descriptive Statistics and Correlations……….…………...31
Table 9: Results Pearson's Correlation……….32
Table 10: Result Kendall's Tau Correlation………..33
Table 11:Factor Analysis Correlation Matrix………36
Table 12: Results Regression Analysis………..38
Table 13: Technological Capabilities for E-Commerce……….58
Table 14: Business Capabilities for E-Commerce………..58
2
List of Abbreviations
B2B Business-to-Business B2C Business-to-Customer DC Dynamic Capability RBV Resource Based View
rTB Pearson‘s Correlation Coefficient of Technology Capability & Business Capability
rNB Pearson‘s Correlation Coefficient of Network & Business Capability
rTN Pearson‘s Correlation Coefficient of Technology Capability & Network Capability rGTT Pearson‘s Correlation Coefficient of Growth Rate Turnover & Technology
Capability
rGTB Pearson‘s Correlation Coefficient of Growth Rate Turnover & Business Capability rGTN Pearson‘s Correlation Coefficient of Growth Rate Turnover & Network Capability rGET Pearson‘s Correlation Coefficient of Growth Rate Employees & Technology
Capability
rGEB Pearson‘s Correlation Coefficient of Growth Rate Employees & Business
Capabil-ity
rGEN Pearson‘s Correlation Coefficient of Growth Rate Employees & Network
Capabil-ity
rAE Pearson‘s Correlation Coefficient of Age of the firm & Number of Employees τBT Kendall‘s Correlation Coefficient of Business Capability & Technology Capability
τNT Kendall‘s Correlation Coefficient of Network Capability & Technology Capability τEN Kendall‘s Correlation Coefficient of Number of Employees & Network Capability τNB Kendall‘s Correlation Coefficient of Network Capability & Business Capability τET Kendall‘s Correlation Coefficient of Number of Employees & Technology
Capability
τAE Kendall‘s Correlation Coefficient of Age of the Firm & Business Capability τNT Kendall‘s Correlation Coefficient of Network Capability & Technology Capability
3
1 Introduction
As the environmental changes for companies in dynamic markets occur frequently, so does the opportunity for firms to grow. Companies are required to change and adopt their stra-tegic approaches likewise to environmental changes in order to remain competitive in to-day‘s market. So does the dynamic nature of the environment of the Internet forces man-agers to combine resources in new ways, repeatedly. Simply relying on assets such as staff or brands is no longer possible, when growth and being highly competitive is the goal (Daniel & Wilson, 2003).
However, of the literature within dynamic capabilities have been focusing on established organizations (Telussa et al.2006). Little research has been done on dynamic capabilities in the context of start-ups (see Lee, 2001, Telussa et al.2006.) To our knowledge, so far no study has investigated the effect of dynamic capabilities in e-commerce start-ups. From our perspective, existing studies used rather broad dimension for assessing dynamic capabilities, but none using concrete determinants of dynamic capabilities of e-commerce firms. More-over, it seems to be unclear whether the dimensions of dynamic capabilities as suggested by Eisenhardt and Martin (2000) are applicable on start-ups.
Drawing on recent literature, it is argued that start-ups adapt differing strategic processes compared to established firms (Bhide, 2000; Lester, 1997; Michael, 2002). The main focus of these processes seems to be on value creation, opportunity recognition and the explora-tion of business opportunities (Michael et al., 2002) as well as on opportunity adaptaexplora-tion (Bhide, 2000), while established firms emphasize analysis and continuity (Bhide, 2000) as well as loss prevention and coordination (Michael et al., 2002). Further, different dynamic capabilities seem to be relevant for early firm development and growth. Although, a huge amount of studies on dynamic capabilities does exist there is less focus on whether the suggested determinants are applicable on established companies and start-ups equally. As such, a discrepancy between the determinants used and the nature of the firm their applied on might emerge.
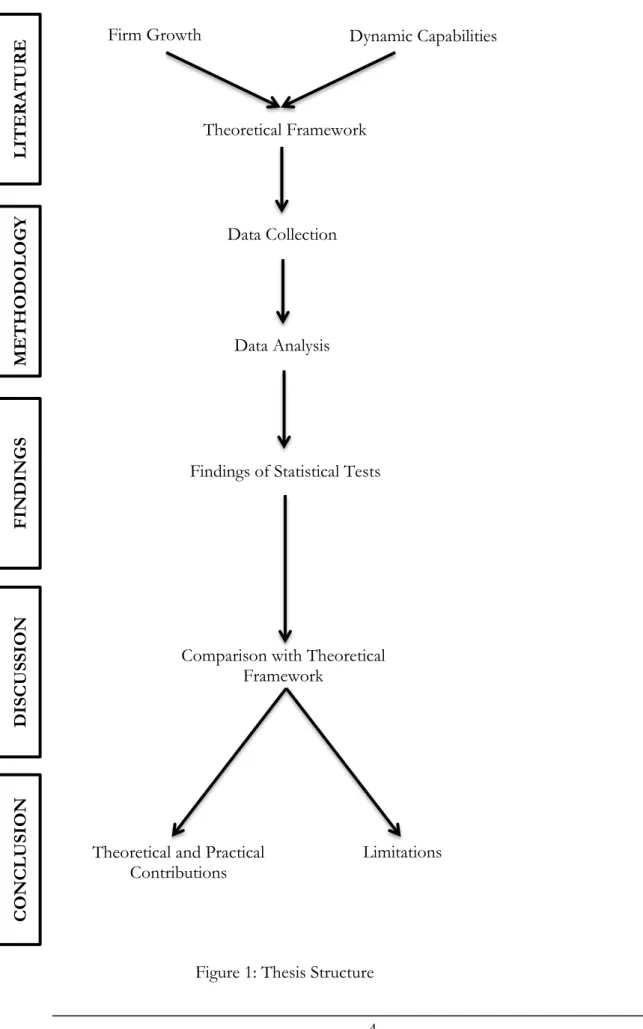
4 L ITE R A TUR E M ET H OD OL OG Y DISC USSI ON F IN DINGS C ON C L USI ON
Firm Growth Dynamic Capabilities
Theoretical Framework
Data Collection
Data Analysis
Findings of Statistical Tests
Comparison with Theoretical Framework
Theoretical and Practical
Contributions Limitations
5
2 Theoretical Framework
2.1 Firm Growth
Firm growth has been one of the most studied subjects in business and economic literature. Its importance is underlined firstly by the argument that firm growth is coherent to a firm‘s survival. Firms that grow continuously have a higher chance to persist in a market (Gero-ski, 1995). Secondly, firm growth is related to employment. New jobs are created under a positive growth rate and, in turn, destructed under a negative rate. Thirdly, on a wider per-spective, firm growth has an effect on economic growth. In general, an increase in firm growth triggers the positive dynamisms of an economy, which consequently can lead to growth (Carrizosa, 2007).
In spite of the given importance of firm growth, there is no common theory to analyze the impact, causes, or evolution of firm growth. As Correa (1999) pointed out, this may be due to the complexity of the various definitions of the firm. Edith Penrose (1959) argues that the term growth is usually used in two different comprehensions: ―It sometimes denotes merely
increase in amount; for example, when one speaks of „growth‟ in output, export, and sales. At other times, however, it is used in its primary meaning implying an increase in size or improvement in quality as a result of a process of development, akin to natural biological processes in which an interacting series of internal changes leads to increases in size accompanied by changes in the characteristics of the growing object‖
(Pen-rose, 1959, p. 1).
Penrose (1955) further suggests that causes of growth can be both internal and external. External causes, such as raising capital and demand condition ―cannot be fully understood
with-out an examination of the nature of the firm itself‖ (1955: p. 532). Internal causes, such as the
management of a firm‘s resources, however, would consequently produce growth (Penrose, 1959).
The complexity of the term has led to different perspectives and, more importantly, differ-ent predictions of the evolution of growth among scholars. This can clearly be seen from the variables used in the literature to measure firm growth and its determinants. Some the-ories focus on average size, some focus on internal characteristics and others focus on ran-dom variables (Davidsson, Achtenhagen and Naldi, 2007). More specifically, sales, assets, physical output, market share and profits are commonly proposed measures (Delmar, 1997; Weinzimmer, Nystrom and Freeman, 1998; Wiklund, 1998). Kruger (2004) furthermore ar-gues that firm growth can also be measured in the form of qualitative features like market position, quality of product, and goodwill of the customers.
In the context of early firm growth, there is a common understanding under scholars that an entrepreneurial firm is successful if it is growing. There are many different theories on identifying the main factors underlying the growth of the new firm. One set of theories
ad-6
dressed the influence of size and age on growth (Evans 1987; Heshmati 2001; Morone and Testa 2008), and the second set deals with the influence of variables such as strategy, or-ganization, and the characteristics of the firm‘s owners (Fazzari et al. 1988; Lumpkin and Dess 1996; Freel and Robson 2004) on growth of the firm. Mateev and Anastasov (2010) have found that an enterprise's growth is related to size as well as other specific characteris-tics like financial structure and productivity. Lorunka et al. (2011) have found that the gen-der of the foungen-der, the amount of capital required at the time of starting the business and growth strategy of the enterprise are very important factors influencing growth in a small enterprise. They have further highlighted that, apart from human capital resources, the growth of an enterprise can be predicted on the basis of commitment of the person start-ing a new enterprise.
Despite the numerous measures of firm growth as identified by different scholars, the un-derlying perspective on growth in this thesis is on the ―increase in amount‖ (Penrose, 1959) aspect, namely the increase in a firm‘s turnover as well as its number of employees. Those measures serve as dependent variables in the data analysis (see Chapter 4.7 ―Dependent Variables‖).
New perspectives on the role of a firm‘s environment on growth have been provided by Wiklund et al. (2013). They argue that the environment provides small firms with exploita-ble opportunities. Specifically, location, industry and market influence firm performance. Further, they introduce the thoughts of Audretsch et al., who argue that the unionization of employees (Acs and Audretsch, 1990), industry growth rate (Audretsch and Mahmood, 1994), degree of economies of scale (Audretsch, 1995), and new innovations (Audretsch and Vivarelli, 1998) impact the growth of small businesses. However, these studies ana-lyzed environments as a whole, which is why it ―is assumed to have the same effect on all firms in a particular industry, market or location‖ (Wiklund et al., 2013). Consequently, re-searchers have suggested distinguishing between dynamic, hostile and heterogeneous envi-ronments (Wiklund et al., 2013). Dynamic envienvi-ronments are described as instable and con-tinuously changing, with the latter bringing opportunities for growth. Hostile environ-ments, however, are characterized by increased market competition and decreased product demand and are thus considered threatening to a firm‘s growth. Last, heterogeneous envi-ronments are considered easy to enter if firms discover and shape market niches (Wiklund et al., 2013).
2.1.1 Entrepreneurial Growth
The objective of entrepreneurship is new firm creation. The growth of a new firm needs involvement of strategic activities, which have been labeled strategic entrepreneurship (Hitt et al., 2001). Hence, creation and adaptation of a resource base are essential for the early stage development of a firm, which often proves to be difficult as new firms experience re-source scarcity (Døving & Gooderham, 2008). Consequently, firms are confronted with performance deficits if they cannot develop a strong resource base. To tackle this problem,
7
new firms must develop dynamic capabilities to reconfigure the resource base for their purposes (Teece et al., 1997; Eisenhardt and Martin, 2000). Dynamic capabilities refer to “the firm‟s processes that use resources – specifically the processes to integrate, reconfigure, gain and release
resources – to match and even create market change” (Eisenhardt and Martin, 2000, p. 1107). In the
following section, we define and describe the dynamic capability approach further.
2.2 Dynamic Capabilities
“The growth and survival prospects of new firms will depend on their ability to learn about their environment,
and to link changes in their strategy choices to the changing configuration of that environment”.
Geroski (1995) As the environmental changes for companies operating in the e-business occur rapidly, so does the opportunity for firms to grow. Companies are required to change and adopt their strategic approaches likewise to environmental changes in order to remain competitive in today‘s market. The dynamic nature of the environment of the Internet forces managers to combine resources in new ways, repeatedly. Simply relying on assets such as staff or brands is no longer possible, when growth and being highly competitive is the goal (Daniel & Wil-son, 2003).
Entitled as the holy grail of strategic management, the question of how to achieve competi-tive advantage has fired up the minds of practitioners throughout the past decades. Schol-ars on the other hand have been given a platform on which to development new strategic paradigms that give explanations according to the current economic circumstances. As an effort to match strategic management perspective to the dynamism of high-velocity mar-kets, dynamic capability (DC) framework was introduced as an approach to understand strategic change and explain “the resources of enterprise–level competitive advantage over time“ (Teece, 2007, p. 1320). Over the years different viewpoints on how dynamic capabilities are constructed and how they affect firm performance have emerged. Some scholars have claim a direct impact on firm performance (e.g. Teece et al., 1997) while others report a ra-ther mediating effect of dynamic capabilities (e.g. Eisenhardt & Martin, 2000, Winter, 2003, Protogerou et al. 2014).
However, over the last decades scholars have researched and extended this topic with am-bition. This has produced a respectable amount of literature and helped unfortunately, this has also increased the complexity of this topic. After reviewing predominant literature on dynamic capabilities, our findings have shown that numerous scholars still remain skeptical about the value of the dynamic capability approach (Peteraf et al., 2013). Influential studies such as Eisenhardt & Martin‘s (2000) or Teece et al. (1997), however, underpin the
signifi-8
cance of the DC approach for developing value creating strategies. Nevertheless, a concise and comprehensive definition of dynamic capabilities is still to come (Protogerou et al., 2011). Scholars label the dynamic capability research as “not a theory yet” (Helfat & Peteraf, 2009, p. 99).
Despite the ongoing debate whether the DC approach can be considered a fully developed theory or not, this thesis tries to shed some light on the conception of the dynamic capabil-ity framework as an approach to explain SCA. The studies of Teece et al. (1997) and Ei-senhardt and Martin (2000) stand out as the most influential and seminal in the literature of dynamic capabilities up until now. Thus, their basic understanding of the topic is applied in this thesis. Nevertheless, from an extensive literature research we were able to derive three dynamic capability dimensions (technology, business, and network). Each of which we can assign four specific capabilities (see Table 1 ―Dimensions and Indicators of Dynamic Ca-pabilities) for e-commerce firms that are capable of generating a sustained advantage (Lin & Hsia, 2011; Wu & Hisa, 2008). Those capabilities are further assigned to three overarch-ing categories of capabilities. However, in order to provide the reader with substantive background to fully understand the theoretical environment this thesis is situated, the fol-lowing will shed some light on the theory and logic behind the dynamic capability frame-work. The section thereinafter will provide a more detailed description of certain dynamic capabilities for companies operating in e-commerce and introduce hypotheses the authors do derive from that.
2.2.1 The Resource Based View
Dynamic Capabilities have been referred to as processes of a firm‘s reconfiguration in or-der to gain competitive advantage in a dynamic market (Teece, 1997). Therefore, as the dy-namic capability approach targets a firm‘s value creation, it can be understood as a para-digm for superior strategic decision making, rather than pure operational processes to ―keep the business alive‖. Furthermore, dynamic capabilities have been described as “specific
strategic and organizational processes such as product development, alliancing” (Eisenhardt and Martin,
2000). To better understand the nature of dynamic capabilities it helps to inspect the Re-source Based View (RBV) first, as the dynamic capability approach can be considered as a modification of it (Arend and Lévesque, 2010).
RBV is a strategic management perspective on value creating strategies in a competitive en-vironment. RBV differs from environmental models as it focuses on the internal organiza-tion of a firm and its resources in order to gain sustained competitive advantage (SCA) - excluding external analysis of opportunities and threats (see Barney, 1991; Wernerfelt, 1984). Within the RBV it is assumed that a firm can be seen as a bundle of heterogeneously distributed resources (physical-, human-, organizational capital). According to the RBV, a company may gain SCA from its internal organization when its assets (resources) are
valua-9
ble, rare, imitable and non-substitutable – known as the VRIN attributes. SCA in the con-text of RBV is when an organization is capable of implementing and reproducing a value creating strategy, which its current competitors simultaneously cannot. Accordingly, Barney (2001) proposes that firms can enrich their performance if they base their competitive strategies on their capabilities. In addition, it should be worth noticing that a sustained competitive advantage is not to be understood as lasting forever but rather as not imple-mentable and duplicable by competitors at the same time (Barney, 1991). RBV as a strate-gic approach has since then been reviewed and extended by several scholars.
As one of the early scholars for instance, Grant (1991) extended the concept by linking a firm‘s competitive strategies and capabilities to value creation. Correlating with Barney (1991), he argues that a firm‘s capabilities can be considered as a base to SCA. Moreover he suggests that those capabilities need to be renewed over time. But we will have a closer look at that later in a later section. As we notice, so far there have been underlying thoughts on resources and capabilities that lead the way to dynamic capability approach before it was introduced and became a widely discussed framework. However, rapid changes in a firm‘s environment may transform a former sustained advantage into a disadvantage or ―nullify‖ resources in a new industry setting (Barney, 1991). And digital networks of modern markets provide firms with a vast speed for innovation and manufacturing, technological change occurs rapidly and companies are forced to constantly re-create for sustained advantage. Whilst both, the RBV and dynamic capability paradigm, take on a resource based approach to explain/explore SCA, there is a significant difference between them. RBV has proved to be a practical paradigm to explore markets where the mere existence of resources can lead to SCA (Daniel & Wilson, 2003). However, it was not conceptualized for dynamic markets and therefore is considered to be fundamentally static in nature (Teece, 2007). Nor has it been helpful to explain how companies with the same bundle of resources achieve different competitive standings (Peteraf et al., 2009). Thus, scholars such as Teece et al. (1997), Ei-senhardt & Martin (2000), Daniel and Wilson (2003) etc. argue that the limits of RBV lie within the industry structure. Moreover, RBV is considered fruitless in a business environ-ment where sustaining competitive advantage is a major strategic challenge and the under-lying processes are short living, unpredictable and of an unstable nature (Eisenhardt & Martin, 2000). Simply having a bundle of resources is not enough to gain SCA in such mar-kets (Daniel and Wilson, 2003). As a key differentiating factor market dynamism stands out. Therefore, the dynamic capability framework was conceptualized as an attempt to overcome constrains of the RBV and to explain why and how certain companies have a SCA in dynamic markets.
10
2.2.2 Dynamic Markets and Routines
The variation of market dynamism can be characterized by the occurring changes within the industry. Change in competitive markets may take the form of e.g. change in technolo-gy or consumer behavior. In moderately dynamic markets on the one hand, change is con-sidered to occur frequently and along a more or less linear path. Thus, the outcome is somewhat predictable. For instance, a manager wants a certain outcome and accordingly the firm would follow the required steps to generate such desired outcome. The processes from analyzing to implementing are well known and boundaries are clearly given within that industry. Ergo, such markets build heavily on already existing knowledge and well-structured routines (Eisenhardt & Martin, 2000). Competitors are known and the industry in total is stable. Hence, dynamic capabilities in such moderate dynamic markets likewise are of a stable nature and do take the form of well-known routines and precisely clocked processes.
In dynamic markets however, the overall industry seems to be more unstructured and vague. The business environment changes more frequently and the outcomes are less pre-dictable than in moderate markets. Due to the high degree of uncertainty such high-velocity markets cannot build on existing knowledge. In such environments, capabilities that enable rapid reconfiguration of a firm‘s resources are the means through which a firm can gain unique resources (Wheeler, 2002). Therefore, companies operating in dynamic markets must constantly combine their resources in new ways and gain novel resources to achieve SCA (Daniel & Wilson, 2003).
Dynamic Capabilities are referred to as the ability of a firm to achieve new forms of com-petitive advantage by reconfiguring a firm‘s resources to be able to respond to the rapidly changing environment in a timely manner (Teece et al., 1997; Eisenhardt and Martin, 2000). The nature of the dynamic capability framework has been characterized as a “strong break
with the five forces” (Teece, 2007, p. 1325) model, where the analytical purpose is
conceptual-ized for the inter-organizational ecosystem only. Further, that the DC approach is concep-tualized for unpredictable, dynamic markets.
In contrast, Eisenhardt and Martin (2000) argue that dynamic capabilities vary within mar-ket dynamism and thus justify the functionality of DC for moderate dynamic marmar-kets. They claim that the nature of the capabilities change by market dynamism. Within moderately dynamic markets, dynamic capabilities embody the nature of analytical processes and rou-tines that build on a solid knowledge base and thus can be executed linear. In contrast, in dynamic market dynamic capabilities take the form of simple unstable routines. Because of the fact that there is no past knowledge to build upon, the outcome of those simple rou-tines is less predictable compared to moderate dynamic markets (Eisenhardt & Martin, 2000). Consequently, firms have to take strategic decisions that build on timely gained
11
knowledge (Wheeler, 2002). As a result companies take on a ―learning-by-doing‖ approach to achieve SCA.
In detail, dynamic capabilities incorporate routines such as product development, alliancing or knowledge management (Eisenhardt and Martin, 2000). However, it is noteworthy, that dynamic capabilities themselves are not considered to be the source of SCA. Rather they have a mediating effect by realizing resource configurations that in turn allow the firm to gain SCA (Wheeler, 2002). Simply having a bundle of resources is not enough to gain SCA in dynamic markets (Daniel and Wilson, 2003). It is more about how well a firm can utilize a certain resource configuration. In this context, Helfat et al. (2007) speak of the term technical fitness, which describes the effectiveness of a capability‘s function. Further they argue that the value of technical fitness ranges from zero to a positive value.
2.2.3 Strategic Processes in Entrepreneurial vs. Established Firms
Strategic processes in established firms and entrepreneurial start-ups differ vastly according to Bhide (2000). He argues that in the early phases of firm development, opportunity adap-tation is of great importance. In contrast, established companies focus rather on analysis and continuity. Likewise this distinction, Lester et al (1997) distinguishes the strategic pro-cesses of entrepreneurial firms and established firms as interpretive and interpretive man-agement respectively. Michael et al (2002) further differentiate between focusing on value creation, opportunity recognition and the discovery of business opportunities in entreneurial firms and the administrative management in established firms, focusing on loss pre-vention and coordination.
According to Boccardelli et al. (2006), the distinctive competence for entrepreneurial firms in fast changing environments should be the ability to understand the future development of strategic industry factors, resources and capabilities as well as their inter-relationship. Consequently, entrepreneurial firms should find themselves in a process of constantly re-evaluating their resources and capabilities.
2.3 Dynamic Capabilities in E-Commerce
The meteoric growth of Internet based e-commerce at the turn of the last century is truly baffling. During the last one decade, this market space has grown in several directions. In its first generation, it saw the emergence of portals and search engines. However, in due course more and more organizations began to cater to the Business to Customer (B2C) market. In the last two years, there is significant growth in the Business to Business (B2B) segment. As several organizations began to operate in the Internet market space, they are innovative in creating unique value propositions during the process. These were either not found or difficult to replicate in the traditional brick and mortar operation.
However, the authors consider this framework more of a theoretic approach rather than a practitioner‘s guide on how to develop the required sets of capabilities in a certain type of
12
industry, e.g. e-commerce. Given the specific nature of the Internet, the need for this study arises to draw on dynamic capabilities that are specific for firms operating in the e-commerce sector. Over the last years, several scholars have studied capabilities of firms in the e-commerce field, some by applying the dynamic capability approach. For instance, Daniel and Wilson (2003) applied the dynamic capability approach on e-business compa-nies. Their findings allowed them to identify eight dynamic capabilities and to suggest prac-tices for companies to effectively alter those capabilities.
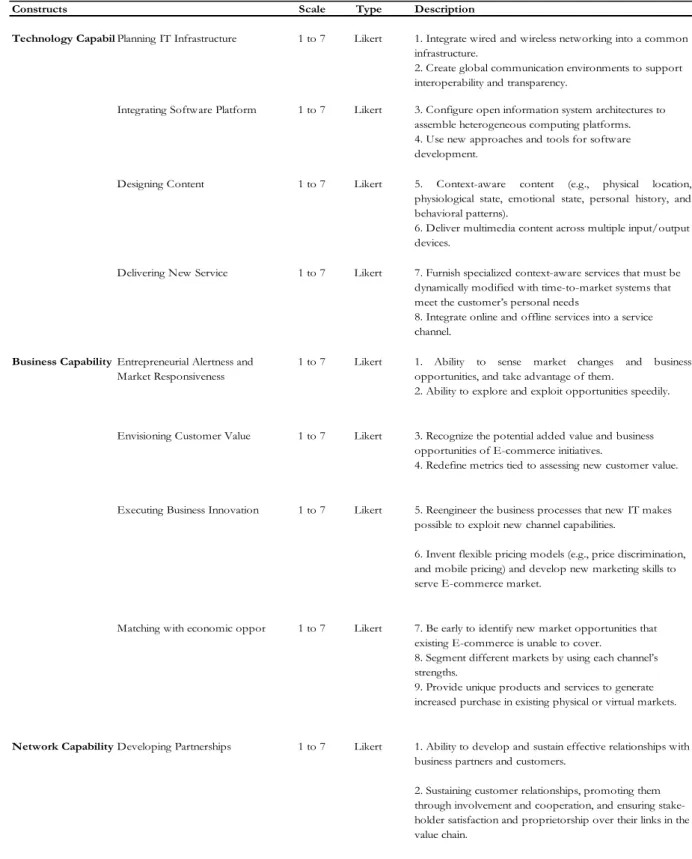
According to Wu and Hsia (2008), the ability of an E-business to grow rests on two basic capabilities: technological and business. The two basic capabilities combine, along with or-ganizational routines, to form the dynamic capabilities of E-business. The technological ca-pabilities include planning IT-infrastructure, integrating software platform, designing con-tent, and delivering new services (see Table 1). The business capabilities are envisioning customer value, executing business innovation, matching with economic opportunities, and building relationships (see Table 1). In addition, we propose a third group of network ca-pabilities as introduced by Lin and Hsia (2011), which include developing partnerships, val-ue network governance, fostering co-production and knowledge sharing, and co-creating relational value (see Table 1).
13
Constructs Scale Type Description
Technology CapabilityPlanning IT Infrastructure 1 to 7 Likert 1. Integrate wired and wireless networking into a common infrastructure.
2. Create global communication environments to support interoperability and transparency.
Integrating Software Platform 1 to 7 Likert 3. Configure open information system architectures to assemble heterogeneous computing platforms. 4. Use new approaches and tools for software development.
Designing Content 1 to 7 Likert 5. Context-aware content (e.g., physical location, physiological state, emotional state, personal history, and behavioral patterns).
6. Deliver multimedia content across multiple input/output devices.
Delivering New Service 1 to 7 Likert 7. Furnish specialized context-aware services that must be dynamically modified with time-to-market systems that meet the customer‘s personal needs
8. Integrate online and offline services into a service channel.
Business Capability Entrepreneurial Alertness and
Market Responsiveness
1 to 7 Likert 1. Ability to sense market changes and business opportunities, and take advantage of them.
2. Ability to explore and exploit opportunities speedily.
Envisioning Customer Value 1 to 7 Likert 3. Recognize the potential added value and business opportunities of E-commerce initiatives.
4. Redefine metrics tied to assessing new customer value.
Executing Business Innovation 1 to 7 Likert 5. Reengineer the business processes that new IT makes possible to exploit new channel capabilities.
6. Invent flexible pricing models (e.g., price discrimination, and mobile pricing) and develop new marketing skills to serve E-commerce market.
Matching with economic opportunities1 to 7 Likert 7. Be early to identify new market opportunities that existing E-commerce is unable to cover.
8. Segment different markets by using each channel‘s strengths.
9. Provide unique products and services to generate increased purchase in existing physical or virtual markets.
Network Capability Developing Partnerships 1 to 7 Likert 1. Ability to develop and sustain effective relationships with business partners and customers.
2. Sustaining customer relationships, promoting them through involvement and cooperation, and ensuring stake-holder satisfaction and proprietorship over their links in the value chain.
14
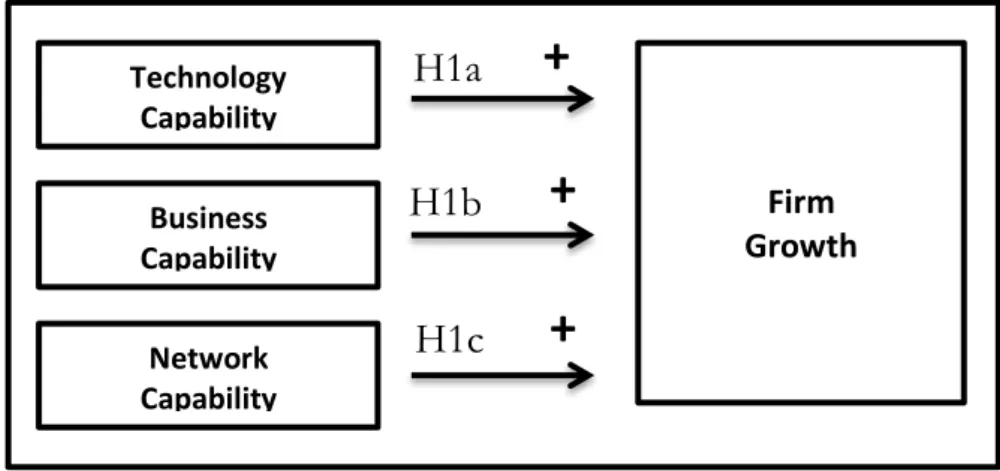
3 Hypothesis
Based on the theoretical findings, we propose a tri-core model which aims at exploring the influence of the three dynamic capability dimensions Technology, Business, and Network. More precisely, these three capabilities are each considered to positively influence firm growth (see Figure 2). In the following, we suggest three hypotheses.
Figure 2: A conceptual framework for testing the impact of dynamic capabilities on firm growth(elaborated by the authors).
3.1 Technology Capabilities
Originally dynamic capabilities were introduced as an effort to explain how companies can achieve and sustain competitive advantage in industries with speedy technological change (Teece et al. 1997). Consequently, from the nature of e-commerce it logically derives that companies operating in this industry must possess technology capabilities- to a various dgree. It can be assumed that otherwise they simply could not be able to operate in the e-commerce sector.
Technology capabilities can be defined as the ability to provide new products and/or ser-vices, to automate business processes and to implement new technological innovations (Hoque et al., 2006). Those capabilities can be considered as critical technology capabilities for firms throughout e-commerce capability research (Lin and Hsia, 2011). By focusing on IT innovation, Wheeler (2002) applies technology capabilities on net enabled organizations (NEO). NEO are companies operating in dynamic markets and relying which rely on digi-tal networks. According to this study, companies constantly adopt novel technologies and therefore constantly are in the need to reconfigure their resources in order to exploit busi-ness opportunities. Moreover, a persistent reconfiguration of technology resources acts as a stimulus to the value of a firm‘s resources and thus technology capabilities can be utilized to gain a periodical SCA (Wheeler, 2002). Rashirad et al. (2013) argue that e-commerce firms may be successful if they are able to extract new ideas from customers by using new Internet-based technologies (Rashidirad et al., 2013).
Technology Capability Firm Growth
+
H1a
Business Capability Network Capability+
H1b
+
H1c
15
Being in line with that, Wu & Hsia (2008) state that an increasing affordability of innova-tive technologies has formed new opportunities for commerce firms. Managers of e-businesses are in constant need of refiguring technological resources and expertise in order to embrace those opportunities. Research on this topic has shown that, in order to tackle upcoming challenges, high priority should be placed on reconfiguring a firm's technological capabilities. By doing so, a sustained competitive advantage in e-commerce can be generat-ed (Daniel and Wilson, 2003; Wu and Hsia, 2008; Rindova & Kotha, 2001).
In addition, a study by Bharadwaj et al. (1999) used firm performance dimensions such as strategic flexibility and intangible value to investigate a firm‘s IT-Performance relationship. Their findings also implied that IT investment favors a firm‘s performance potential. It therefore can be concluded that technology capabilities and firm performance are positively related. Thus, we suggest that:
H1a: Technology Capabilities have a positive impact on firm growth.
3.2 Business Capabilities
Teece et al. (1997) break down dynamic capabilities into managerial and organizational processes. Moreover, business capabilities have been referred to as the ability to understand the overall market environment and the specific organizational context, and execute busi-ness practices for achieving strategic and operational goals (Kohli & Gover, 2008; McDon-ald, 2007). More precisely, business capabilities represent a firm‘s ability to utilize market opportunities, to deliver new value propositions, to reinvent business models, and to ab-sorb new knowledge and skills (Lin & Hisa*, 2011). According to Lin & Hisa (2011), these
capabilities are translated into business activities such as fostering business agility and mar-ket responsiveness, identifying customer value proposition, and reinventing established business models. In the following, each activity‘s impact on an e-commerce firm‘s growth will be explained.
First, fostering business agility and market responsiveness are described by Lin & Hisa (2011) as the ability to sense market changes and business opportunities. In the e-commerce environment, this ability is considered critically for innovation in the short term and growth in the long term (Sambamurthy et al., 2003; Malhotra et al., 2005).
Second, identifying customer value proposition describes a firm‘s ability to communicate a product‘s or service‘s value to customers (Lin & Hisa, 2011).
* Due to the fact, that we found different versions of how the name „Hsia― (or ―Hisa‖) is spelled in the article
by Lin & Hsia, 2011, we consider that it must be a spelling mistake. Nevertheless, we decided to go with the spelling of „Hsia― for this thesis.
16
Johnson et al. (2008) furthermore argue that a clear definition of customer value proposi-tion is crucial to any new venture‘s survival. Hence, this ability can ―support a firm‟s success
ac-tively by enhancing value creation and improving business model design through innovations in products, ser-vices, channels and market segmentation‖ (Lin & Hisa, 2011, p.1888).
Third, business model reinvention describes a firm‘s ability to introduce sound solutions as inputs, match them with business opportunities, deliver innovative products and services for customer value creation, design a profit formula for execution, and commit to recon-figuring its key resources and processes (Lin & Hisa, 2011). Hence, business model rein-vention is a main source of sustaining competitive advantage for e-business firms (Johnson et al., 2008). It can therefore be assumed that the bundle of business activities supports firm growth. Hence, we suggest:
H1b: Business capabilities have a positive impact on firm growth.
3.3 Network Capabilities
Firms utilize their networks to access external resources, to improve their strategic posi-tions, to acquire new skills and knowledge, to control transaction costs and coordinate ac-tivities effectively, and to obtain new technologies (Alvarez & Barney, 2001). Therefore it is safe to say that networks can be seen as a resource itself (Amit & Schoemaker, 1993). Building on that argument, Lin and Hisa (2011) introduce the term ‗network capability‘. They explicate that ―network capabilities refer to the ability to build and govern inter-organizational
partnerships and collaborative relationships with customers and partners for the execution of value co-creation activities‖ (Lin and Hisa, 2011, p.1888).
Research on networks has furthermore proven that the success of a firm is likely to depend on its ability to obtain resources through networking (Watson, 2007; Zhai and Aram, 1995). It is furthermore suggested that networking enables SMEs to gain access to complementary or external resources (Jarillo, 1989; Chang, 2003; Liao, Kickul & Ma, 2009). This effect is of major importance for smaller firms and start-up firms as they are often limited by resource scarcity (Døving & Gooderham, 2008). These kinds of cooperation, in turn, can provide the attainment of economies of scale in SMEs without causing economic inefficiency due to large size (Julien, 1993). Watson hence argues that the utilization of networks can
―poten-tially lower a firm‟s risk of „failure‟ and increase its chances of „success‟‖ (2007, p.854). It is
further-more suggested that a collaborative network fosters innovation and firm growth (Pisano & Verganti, 2008).
A study conducted by Havnes and Senneseth (2001) found that networking activities had no short-term benefits such as growth in employment or turnover. However, the findings indicate a clearly positive relationship between networking and the geographic extension of markets. Hence, they argue that networking has an indirect effect on firm growth as it sus-tains long-term goals of the firms. Refuting findings were produced by Watson (2007), who
17
studied the relationship between networking and firm performance. His findings show a significant positive relationship between networking and both firm survival and growth. Therefore, we suggest:
H1c: Network capabilities have a positive impact on firm growth.
So far, we have explained the theoretical framework this thesis is situated in and from that we created three hypotheses which will be tested using scientific methods. To test Hypoth-esis H1a, H1B and H1c it is required to possess a sample, in our case, Start-up companies to test up on. The following section will describe the methodology that was used for this thesis.
18
4 Methodology
The methodology presents how the study is conducted and explains the necessary logic as-sumptions as contingency factors for the findings. Based on the purpose and problem dis-cussion presented in the introduction, the underlying purpose and overall approach for an exploratory and explanatory quantitative survey study is presented at first. Furthermore, the specific research philosophy, design, sampling methods, data collection process and data analysis are described to lead the reader through the whole research process.
4.1 Research Philosophy
From the reader‘s perspective, the research philosophy guides through the thesis and sup-ports the comprehension of how the authors view the world. Furthermore, it helps to un-derstand the links between the methods chosen accordingly and what influenced the choice of strategy. It is a practical means to underpin what it is what this thesis is researching. Due to the fact, that there are several research philosophies that researchers can follow rather than a single ‖all-it-takes‖ one, different philosophies fit to different sets of research. The philosophy adapted in this thesis might be working well for this kind of quantitative search but a different kind of philosophy might be better suited for another. From a re-searcher perspective, adapting a certain research philosophy helps the rere-searcher to ap-proach the research in a certain way, where a more or less clear path is given. In addition, it allows the researcher to be consistent in the choice of methods suitable for the kind of re-search undertaken.
Positivism
The present study adapts the assumptions of a positivistic research philosophy. A positiv-istic philosophy takes the position of a natural scientist where observable phenomena are investigated and the results of the research can be generalized thereinafter (Remenyi et al. 1998:32). Hence, the researcher ”will be concerned with facts rather than impressions” (Saunders et al., 2009). Being in line with a positivistic approach, existing literature is used to develop hypotheses. For the purpose of testing these hypotheses credible quantitative data needs to be collected from only observable phenomena. It is from importance that the way this re-search is undertaken is as far as possible value free and a highly structured methodology is used throughout the research (Saunders et al., 2009, Gill and Johnson, 2002). The choices made for the methodology as presented in the following shall mirror the perspective of a positivistic research philosophy.
4.2 Research Approach
So far, numerous scholars have investigated the theoretical approach of dynamic capabili-ties over the last decades. However, of the literature within dynamic capabilicapabili-ties have been focusing on established organizations (Telussa et al.2006). Little research has been done on dynamic capabilities in the context of start-ups. Therefore, our goal is to provide empirical evidence and extend the existing literature. In particular, this study is grounded on the
the-19
ory of dynamic capabilities as introduced by Teece (1997; 2007). Several scholars then fur-ther extended this approach (e.g. Eisenhardt & Martin 2000; Winter, 2003; Zahar, 2006; Teece, 2007; Helfat & Peteraf; 2009). Furthermore, the tri-core model we use to divide the dynamic capabilities into three categories (business-, technological-, network capabilities) was developed from an extensive literature review on dynamic capabilities. Moreover, the conception of the tri-core model is routed in the models used by Wu & Hsia (2008) and Lin & Hsia (2011) but modified to the purpose of the study and the specific characteristics of e-commerce businesses.
Thus, the basic theoretical approach used in this study is in line with frameworks scholars have used in previous studies to investigate dynamic capabilities for E-businesses. There-fore we use a deductive research approach for this study. As such, the developed frame-work will be subjected to a rigorous test. Collis and Hussey (2003) state that a deductive study design is the dominant research approach that allows an anticipation of phenomena and laws provide the basis for explanation. Important characteristics of deduction will be presented subsequently.
A deductive research approach is usually applied in order to develop a theoretical frame-work and hypotheses from existing literature. The developed hypotheses are then tested by a research strategy that is designed to suit the approach. The research strategy could, for in-stance, take the design of a survey, as it is case for this present study. Following Robson‘s (2002) list of sequential stages of a deductive research approach, we will first deduct hy-potheses from theory as introduced in the theoretical framework. Second, to indicate how the variable used will be measured, the proposed hypothesizes will be expressed in opera-tional terms, in the following called controls. Controls are important to ensure that the change of a variable is a function of the aspect tested and not due to any other random as-pect. The methodology used here is of a highly structured nature to allow replication by further research (Gill and Johnson, 2002). Third, the developed hypotheses will be tested following a quantitative research design. In the next stage, the result of the testing will be examined. The findings will either confirm or refute the hypotheses tested. At last, the findings indicate to modify the theory if needed. Furthermore, it is an important character of deduction that the facts can measured quantitatively, which permits the variables to be reduced to the simplest element possible. At last it needs to be mentioned, that a substan-tial sample size is required that allows the findings to be statistically generalized thereafter (Saunders et al., 2009).
4.3
Research Purpose
The purpose of this study is two-folded, both exploratory and explanatory, as our purpose is to first explore existing general literature on dynamic capabilities to the specific phenom-enon of growth in German e-commerce Start-ups, as well as it aims at explaining the rela-tionship between the variables of the different dynamic capabilities and growth.
20
According to Saunders et al. (2009), there are three ways of conducting exploratory re-search, one of them being the research of literature which is aims at clarifying ―the
under-standing of a problem‖ (Saunders et al., 2009, p.139) and to build the theoretical foundation of
the study. Originating from the literature review, the tri-core model of e-commerce Dy-namic Capabilities based on the research of Wu & Hsia (2008) and Lin & Hsia (2011) was developed and, furthermore, the logical hypotheses were compiled.
The second part of this research, however, follows the explanatory purpose as it aims at explaining the relationship between the variables from the hypotheses. The hypotheses were tested with the data collected through a survey. In order to get a clearer view of the relationship, the data was subjected to correlation and other statistical tests (Saunders et al., 2009). The findings from the data analysis were then discussed with reference to the find-ings from the research of literature.
4.4
Research Strategy
Being in line with the explanatory part of the study, a questionnaire was chosen to collect primary data. In particular, we chose an Internet-mediated questionnaire over a postal questionnaire because it offers more confidence that the right person will respond (Witmer et al. 1999). We approached the sample companies within a dual-effort via telephone and Email to increase the response rate. The purpose and the procedure of the study were ex-plained to the companies and a discrete handling with the data was assured. Afterwards, the designated respondents were asked to click on a link in the email message that directed them to our online survey.
Given the English origin of the researched literature on the one hand and our German population on the other, the English source survey had to be translated into a German tar-get survey. This was done with direct translation due to implementation and monetary pur-poses. This translation technique, however, brings the disadvantage that it ―can lead to many
discrepancies (including those relating to meaning) between source and target questionnaire‖ (Sounders et
al., 2009, p.385). The construct of our questionnaire was as follows: The capabilities (tech-nology, business, and network) that were to test were grouped in four capabilities (predic-tors) each. The predictor itself consisted of a total amount of eight items in the survey, the business capabilities of nine items and the network predictors were present by seven items within the questionnaire.
Validity of the Questionnaire
In order to ensure the validity of the survey, the items to each scale were pilot tested in two-steps: First the basic indicators from which the actual survey questions were derived have been tested on consultation with academics and peers throughout the thesis seminars. In the second step, practitioners were asked to evaluate the questionnaire items and to re-port problematic items. Problematic items were modified or deleted until a sound and comprehensive questionnaire was created. This practice was important to make sure that the managers understood the research instrument as intended, as well as to reduce the
po-21
tential measurement error that might occur by using mono-method data collection. For the duration of data collection, the survey distribution was set to be four weeks in total.
4.5 Time Horizon
Following the goal of this thesis to study the relationship between Start-up growth and dy-namic capabilities of an organization- within the given time of circa three months to fulfill the task of a master thesis- the present research uses a cross-sectional time horizon rather than longitudinal studies. Among researchers cross-sectional studies are commonly used as a means to study a ―snapshot‖ of a phenomenon and are often employed within a survey strategy (Easterby-Smith et al., 2008; Robson, 2002). Through the questionnaire sample firms were asked to provide data about their number of employees and annual turnover of the past 3 years, starting from 2014.
4.6 Sample and Data Collection
4.6.1 Sample Description
The study‘s population was drawn from several Internet databases listing e-commerce and Start-up ventures in Germany as well as from personal contacts to Start-ups. Our sample includes 73 German companies. In this present study, we are dealing with a population that operates in a highly dynamic environment, namely the German e-commerce sector. Build-ing on Teece et al. (1997) companies in such markets face rapid technology changes and thus firms constantly have to reconfigure their resources to be able to achieve SCA. The listing included small- medium sized firms from various sectors of e-commerce.
Due to long working hours, especially in high growth periods, employees hardly find time to answer questionnaires besides their daily working routines. Moreover, e-commerce start-ups barley reveals important business information to people outside their company. How-ever, it should turn out that personal contacts should serve as an effective approach to gain required sample information. Through personal contacts we were able to collect our first data from companies. Those contacts in turn forwarded us to other startups within their network. This resulted in a snowball sampling effect.
N Mean
Age of the firm 73 3.45
Number of employees 73 63.59 Employee Growth Rate 73 0.8232 Turnover Growth Rate 73 0.6915 Valid N (Listwise) 73
Sample Description
22
In total, we approached 936 companies, from which we could collect 73 complete answers for our study. Considering both values, our response rate was 7.80 percent. The number of employees ranged from 2 to 591. Accordingly, the companies in our sample fit the EU def-inition of small and medium sized companies (SME).The annual turnover ranged from €47.000,00 to €99.683.000,00.
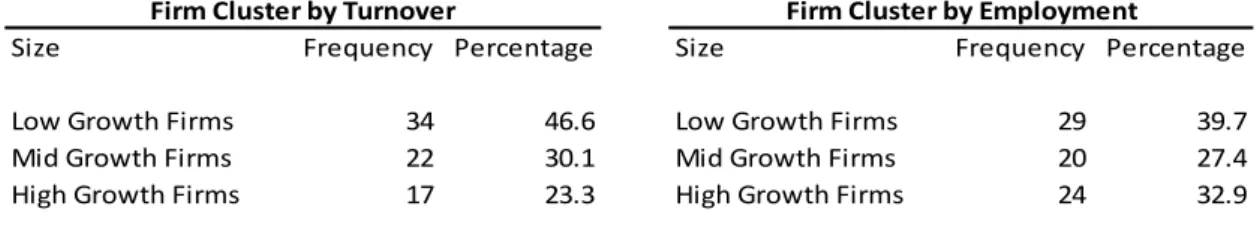
However, the mean number of employees throughout our sample was 63.59 and the mean turnover growth rate was .69 (69.00 percent) for the years 2013 to 2014. Based on the turnover growth rate we classified the firms in three categories: low growth firms (0.00-0.49), mid growth firms (0.50-0.99) and high growth firms (>1.00). Table 3 summarizes this data.
Size Frequency Percentage Size Frequency Percentage
Low Growth Firms 34 46.6 Low Growth Firms 29 39.7
Mid Growth Firms 22 30.1 Mid Growth Firms 20 27.4
High Growth Firms 17 23.3 High Growth Firms 24 32.9
Firm Cluster by Employment Firm Cluster by Turnover
Table 3: Firm Cluster by Turnover & Employee Growth Rate
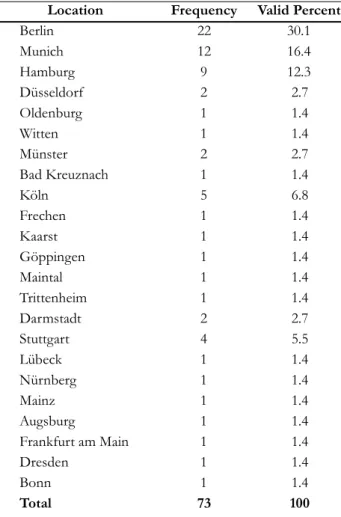
Further, we categorized the population by location of the firm. From our data analysis we could derive that our sample firms are located in 23 different cities all over Germany, how-ever, small clusters emerged (see Table 4). For instance, 30.1 percent of the firms are locat-ed in Berlin, 16.4 percent in Munich, 12.3 percent in Hamburg, 6.8 in Cologne and 5.5 per-cent in Stuttgart.
23
Frequency Valid Percent
Berlin 22 30.1 Munich 12 16.4 Hamburg 9 12.3 Düsseldorf 2 2.7 Oldenburg 1 1.4 Witten 1 1.4 Münster 2 2.7 Bad Kreuznach 1 1.4 Köln 5 6.8 Frechen 1 1.4 Kaarst 1 1.4 Göppingen 1 1.4 Maintal 1 1.4 Trittenheim 1 1.4 Darmstadt 2 2.7 Stuttgart 4 5.5 Lübeck 1 1.4 Nürnberg 1 1.4 Mainz 1 1.4 Augsburg 1 1.4 Frankfurt am Main 1 1.4 Dresden 1 1.4 Bonn 1 1.4 Total 73 100 Location
Table 4: Sample Firms by Location
4.6.2 Data Collection
The population was selected across various e-commerce sectors to ensure sufficient sample size and potential generalization of the results thereinafter (Protogerou et al., 2014). Em-pirical data was not collected randomly but using judgmental sampling as a type of non-probability sampling. This type of sampling is usually used, when only a certain range of people within the population possess the necessary traits or knowledge to (Saunders et al., 2009). Due to the specific nature of the questionnaire, the subject was required to possess great internal knowledge about the company, such as only top-managers, in Start-up‘s usu-ally a member of the founding-team, can have. Hence, in order to answer the question-naire, a person from the firm‘s top-management was asked to indicate on a seven-point scale to which extent the company had possesses a particular capability to the given time (203-2014). The managers were asked to indicate their firm‘s capability in a set of twenty-four questions in total. In addition, only companies considered to be in their first life cycle phase- usually (further referred to as start-ups) with a maximum age of five years were al-lowed in the sample (see Greiner, 1972; Churchill-Lewis, 1983). For the data collection we did not differentiate whether the firm focused on to-Business (B2B) or Business-to-Customer (B2C) business model.
24
The development of the scales for the questionnaire was based on an extensive literature review of studies on dynamic capabilities (e.g. Teece et al. 1997, Wu & Hsia, 2008, Lin & Hsia, 2011). Each dimension of dynamic capabilities was represented by specific capabili-ties for the section. Further, each of the specific capabilicapabili-ties was described by indicators, which were drawn from existing theory. The indicators of the specific e-commerce capabil-ities were then used to develop rating questions for a seven-point Likert scale, as rating questions are often used to collect opinion data (Saunders et al. 2009). Moreover, using a Likert scale is a well-accepted practice in a quantitative research (Protogerou et al. 2014).
4.6.3 Measures
Performance Measures – Dependent Variables
The aim of this study is to provide an empirical result whether dynamic capabilities have a positive impact on firm growth. Therefore, a firm‘s growth rate represents the dependent variable in our model upon which the impact of the independent variables will be tested. There is no definite way to measure growth. However, for this thesis the authors decided to run two identical analysis using two different measures to asses growth: turnover growth rate & employee growth rate.
To calculate both, the employee and turnover growth rate for each firm, we used the fol-lowing formula as suggested by Parker (2002):
( ) ( ) ( )
The sample firm‘s present turnover or employee value (2014) was subtracted by the past turnover or employee value (2013) and the result then was divided by the past (2013) turn-over or employee value.
Controls
We control for firm size as larger firms can be expected to possess greater levels of re-sources and control greater market share than smaller firms (Wiklund, 1998). Firm size was operationalized using number of employees.
Further, we control for firm age, as older firms, in comparison to younger firms, can pur-sue different growth strategies due to their greater access to resources (Venkataraman et al., 1990; Wiklund, 1998).
Independent Variables
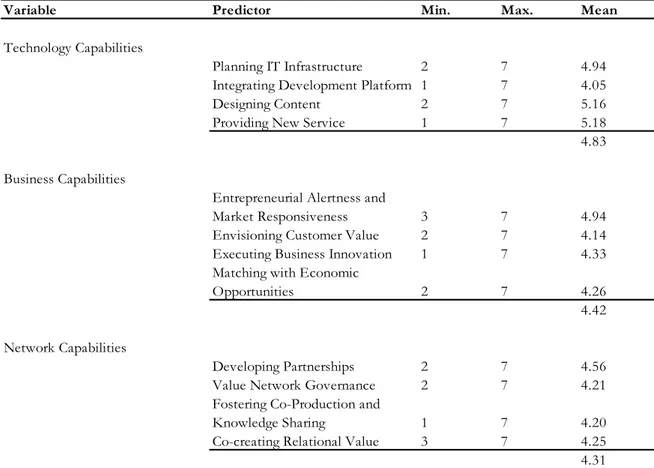
To test the hypotheses, operational terms were developed to serve as a basis for data col-lection. For the construct of the questionnaire, dynamic capabilities were separated in three dimensions: technological, business and network capabilities (see Table 5).
25
Variable Predictor Min. Max. Mean
Technology Capabilities
Planning IT Infrastructure 2 7 4.94
Integrating Development Platform 1 7 4.05
Designing Content 2 7 5.16
Providing New Service 1 7 5.18
4.83 Business Capabilities
Entrepreneurial Alertness and
Market Responsiveness 3 7 4.94
Envisioning Customer Value 2 7 4.14
Executing Business Innovation 1 7 4.33 Matching with Economic
Opportunities 2 7 4.26
4.42 Network Capabilities
Developing Partnerships 2 7 4.56
Value Network Governance 2 7 4.21
Fostering Co-Production and
Knowledge Sharing 1 7 4.20
Co-creating Relational Value 3 7 4.25
4.31
26
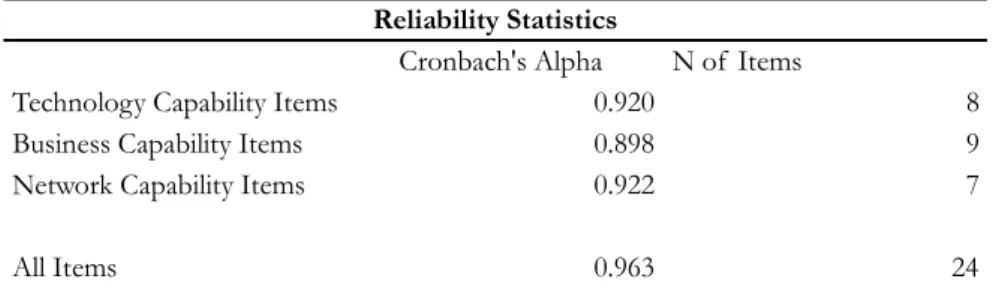
4.6.4 Reliability of Data
Certain efforts have been undertaken to minimize the potential measurement errors. Test-ing the reliability of a questionnaire is important to ensure that it reflects the construct it is measuring throughout the analysis (Field, 2009). To do so, there are different ways for pri-mary and secondary data. Given the explanatory/exploratory nature of this study, we used a deductive and quantitative research approach based on an extensive literature review to evolve the basic dynamic capabilities. Hence, to ensure the reliability of secondary data, the literature incorporated in this thesis mainly was select from peer reviewed journals.
In addition, to ensure the reliability of our primary data we performed a Cronbach‘s-alpha test. It is most commonly used to test the internal reliability within measures of scale relia-bility. In general an alpha value of 𝛼 = 0.80 is considered to be reliable (Field, 2009). For this thesis, the reliability was tested using two steps.
First, a Cronbach‘s Alpha Test was conducted for the questionnaire items of each dimen-sion (independent variable) individually. Second, all 24 items of the three dimendimen-sions were tested together. As presented in Table6, the result of Cronbach‘s alpha test indicates a 𝛼 =
0.92 for Technology Capability Items (eight items), 𝛼 = 0.898 for Business Capability Items
(nine items) and an alpha value of 𝛼 = 0.92 for Network Capabilities (seven items). For the test including the total of all items (24 items), the alpha value is 𝛼 = 0.963. Therefore, the specific items used in our questionnaire are considered reliable individually and in total.
Cronbach's Alpha N of Items
Technology Capability Items 0.920 8
Business Capability Items 0.898 9
Network Capability Items 0.922 7
All Items 0.963 24
Reliability Statistics
27
5 Analysis
To test whether our hypotheses can be confirmed or rejected, the data gathered through the questionnaire had to be implemented into a database. This was done using two soft-ware tools; first, to create a comprehensive dataset, the questionnaire answers were trans-ferred into Microsoft Excel. Second, for statistical analysis we uploaded the dataset from Ex-cel into IBM‟s SPSS Statistics. SPSS assisted us in performing several different statistical analyses on our dataset: First, a descriptive analysis was conducted to measure whether our sample is normally distributed. Second, in order to minimize potential measurement errors and to test the questionnaire‘s reliability, a Cronbach‘s Alpha Test was performed (see Chapter 4). Third, to find out if the independent variables (factors) are correlated with each other, we performed a Pearson‘s Correlation Test as well as a Kendall‘s-Tau Correlation Test. Factor Analysis helped us to determine whether there is a difference between the three independent factors tested and if the items of each dimension show factor loadings. Finally, a Regression Analysis was used to test our hypotheses.
In the following, the data analysis, the findings, and the statistical tests used to perform the analysis will be described in detail. The discussion part (see Chapter 6) will again take up the results as presented and an interpretation will be given. Thereinafter, the findings from the analysis will be compared to the findings from literature.
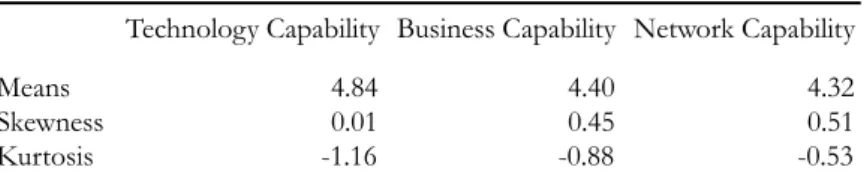
5.1 Normal Distribution Test
In order to explore the distribution of variables, a descriptive analysis was conducted in SPSS. Table 7 shows the result for normal distribution testing.
Technology Capability Business Capability Network Capability
Means 4.84 4.40 4.32
Skewness 0.01 0.45 0.51
Kurtosis -1.16 -0.88 -0.53
Statistics Normal Distribution
Table 7: Normal Distribution of the Dimension
From Table 7, we can see that, on average, Technology Capability scores 4.84 (out of 7) Business Capability scores 4.40, compared to 4.32 for Network Capability. Here, important measures to investigate normal distribution are the skewness and kurtosis values. In a nor-mal distribution both values should be zero (Field, 2009). In turn, the further the value dif-fers from zero, the more likely it is that the data is not normally distributed. For Technolo-gy Capability the skew value is close to zero (.008), which indicates a normal distribution. The kurtosis value, however, is -1.16, which indicates a flat and light-tailed distribution. The Business Capability skew value is 0.45, which indicates a pile up of scores left of the bution. The related kurtosis value is -0.89, which also indicates a flat and light-tailed
distri-28
bution. For Network Capability the skew value is 0.51, which again indicates a pile up of scores left of the distribution. The kurtosis value for Network Capabilities is -0.53, which suggests a flat and light-tailed distribution.
5.2 Correlation Analysis
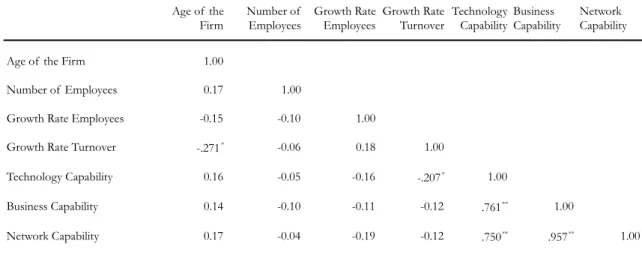
As an effort to test whether the variables (Age of the Firm, Number of Employees, Turno-ver Growth rate, Employee Growth Rate, Technology Capability, Business Capability, and Network Capability) are correlated, a Pearson‘s Correlation test was conducted. In general, a one-tailed correlation test should be used to test a directional hypothesis. On the other hand, a two-tailed correlation test should be used when the nature of the relationship is not predictable from the current standing (Field, 2009). As this thesis test a directional hypoth-esis (―positive impact on firm growth‖), the one-tailed Pearson‘s Correlation Test was cho-sen to assess the correlation among our variables. Descriptive statistics and correlations are summarized in Table 8. When two variables show a correlation coefficient (r) about r =
0.05, a correlation is considered. The description below is structured by importance.
Mean S.D. 1 2 3 4 5 6 7
1 Age of the Firm 3.45 0.90 1.00
2 Number of Employees 63.59 106.51 0.17 1.00
3 Growth Rate Employee 0.69 0.81 -0.15 -0.10 1.00
4 Growth Rate Turnover 0.82 1.02 -.271* -0.06 0.18 1.00
5 Technology Capability 4.84 0.99 0.16 -0.05 -0.16 -.207* 1.00
6 Business Capability 4.40 0.89 0.14 -0.10 -0.11 -0.12 .761** 1.00
7 Network Capability 4.32 0.97 0.17 -0.04 -0.19 -0.12 .750** .957** 1.00
*. Correlation is significant at the 0.05 level (1-tailed). **. Correlation is significant at the 0.01 level (1-tailed).
Descriptive Statistics and Correlations
N= 73; S.D., Standard Deviation;
Table 8: Descriptive Statistics and Correlations
Technology-, Business- and Network Capability
In our test, Technology Capability was positively correlated with Business Capability,
rTB = 0.76, and Network Capability, rTN = 0.75; Network Capability was also positively
correlated with Business Capability, rNB = 0.96. The fact, that the correlation coefficients are r > 0.70, up to r = 0.96 indicates that a strong correlation between the factors is given. All three factors where significantly correlated (all one-tailed, ps < 0.01).