http://www.diva-portal.org
Preprint
This is the submitted version of a paper published in Communications in Statistics - Theory and Methods.
Citation for the original published paper (version of record): Alam, M. (2014)
Likelihood prediction for generalized linear mixed models under covariate uncertainty. Communications in Statistics - Theory and Methods, 43(2): 219-234
http://dx.doi.org/10.1080/03610926.2012.657330
Access to the published version may require subscription. N.B. When citing this work, cite the original published paper.
Permanent link to this version:
Likelihood prediction for generalized linear mixed models under
covariate uncertainty
Md Moudud Alam Sep. 22, 2010.
Abstract
This paper presents the techniques of likelihood prediction for the generalized linear mixed models. Methods of likelihood prediction is explained through a series of examples; from a classical one to more complicated ones. The examples show, in simple cases, that the likelihood prediction (LP) coincides with already known best frequentist practice such as the best linear unbiased predictor. The paper outlines a way to deal with the covariate uncertainty while producing predictive inference. Using a Poisson error-in-variable general-ized linear model, it has been shown that in complicated cases LP produces better results than already know methods.
Key words: Predictive likelihood, Pro…le predictive likelihood, Stochastic covariate, Coverage interval, Future value prediction, Credit risk prediction.
1
Introduction
Predictive inference is a tricky task, especially for non-Bayesian statisticians (Bjørnstad, 1990 and Hinkley, 1979). The core of the problem was understood during the foundational period of statistics (see e.g. Pearson 1920) but it took a long time for the non-Bayesian statisticians to come up with a set of reasonable proposals on the predictive tools with Lauritzen (1974) and Hinkley (1979) being credited as the earliest, theoretically most sound, references. Unless otherwise stated, by prediction we mean the prediction of one or more unobserved (observable or not) variables or some function of them after having observed the observable variables. Let y = (y1; y2; ; yn)T be the vector observations on the response, Y; Xn p be the matrix of
associated observed covariates, y = (y1; y2; ; ym) be the future observations on Y which are not observed and _Xm pbe the associated covariate matrix where some of its elements are known and some are unknown.
Note that we use an asteric ("*") in the superscript (e.g. X ) to indicate that the whole variable, vector or matrix or a part of it is not observed, but they are observable. The covariates and the design matrices associated y are denoted with an over head accent- dot (".", e.g.
_
X). As per convention, we use upper case letters to indicate variables, lower cases to indicate their realized values and bold faces to indicate vectors and matrices. We use the subscripts, i (i = 1; 2; :::; n) to indicate observed data, j (j = 1; 2; :::; m) to indicate future observations and their sum is n + m = l.
The unknown elements in _X are not necessarily missing values in the ordinary sense, e.g. non-response in a survey as in Bjørnstad (1996) and Bjørnstad and Sommervoll (2001), rather
School of Technology and Business Studies, Dalarna University and Swedish Business School, Örebro Univer-sity. Contact: Dalarna University, SE 781 88 Borlänge, Sweden; maa@du.se .
they might be some future values which can be observed only in future time while the prediction is made at current time.
We further assume that, given Xn p and information on the clustering of Y; the response
can be modeled with a suitable generalized linear mixed model (GLMM). The unknown future covariates can also be modelled with a suitable stochastic model. The problem of interest is to predict Y itself or some function S = s (Y ) and provide a measure of uncertainty of those predictions based on observed data on Y and X. Some illustrations of the above problem with known _Xare given in Lee et al. (2006).
Natural examples of stochastic covariates with generalized linear models come from the time series models (Slud and Kedem, 1994; Startz, 2008), dynamic panel discrete choice models (Honoré and Kyriazidou, 2000) and measurement error models (Buzas and Stefanski, 1996). Here we motivate the application of unknown future covariates from the credit risk modeling’s view point. Assume that Y represents whether a credit is default or not and X consists of the respective …rm level accounting data, industry classi…cation of the …rm, credit bureau observation (comments) and macro variables e.g. slope of yield curve, output gap etc. (see e.g. Carling et al. (2004) and Du¢ e et al. (2007)). Some of the covariates, e.g. …rm’s total debt, sales and macro economic indices, are stochastic and their future values can not be observed at current time when the prediction is being made. Assume that we model Y given X using a suitable GLMM and the unobserved components of _X with missing future values are modelled with a suitable time-series model. Then, the remaining problem is to predict Y (or S) and to provide a measure of uncertainty associated with the prediction.
In the literature of credit risk modelling, the issue of stochastic covariates is handled by the so called doubly-stochastic models using the framework of survival analysis (Du¢ e et al., 2007; Pesaran et al., 2006). However, those works do not give proper attention to the uncertainties caused by the stochastic covariates nor do they distinguish the problem of estimation from the problem of prediction. Thus the predictive methods presented in this paper may also be applied to those early works with a view to improve the predictive performances of their models.
Given a prediction problem in hand, one can either try to …nd a frequentist point prediction, e.g. the best linear unbiased predictor (BLUP), and associated prediction error or try to produce a likelihood prediction (Bjørnstad, 1990) or follow the Bayesian approach. The …rst approach does not have a common analytical framework and the existence of the BLUP is not guaranteed, in general. The Bayesian approach is, in principle, rather straightforward although the choice of a particular prior as well as the concept of the prior distribution may be criticized. The likelihood principle (Berger and Wolpert, 1988) provides a uni…ed principle and an analytical framework to deal with any statistical inference including the prediction of future and unobserved values. This paper explores the likelihood prediction in the context of GLMM.
The contributions of this paper are as follows. It o¤ers a short overview of the likelihood pre-diction through a series of standard prepre-diction problems. The examples show that the likelihood prediction can be implemented in a straightforward way and its solutions often coincide with already known best frequentist prediction, where such a best prediction exists. The paper also gives the likelihood prediction in more complicated problems such as error in variable generalized linear models and GLMM where a best frequentist prediction such as BLUP is not available. Through an example with a Poisson error-in-variable model it is shown, through simulation, that the likelihood prediction does a better job than the already existing solutions. The paper also outlines an analytical guideline to implement the likelihood prediction with GLMM under covariate uncertainty.
The rest of the paper is organized as follows. Section 2 brie‡y introduces the principles of likelihood prediction through two classical examples. Section 3 extends the likelihood prediction
for GLMM with covariate uncertainty. Section 4 presents three examples of the likelihood prediction under covariate uncertainties. Section 5 o¤ers a comparative discussion on the several proper predictive likelihoods that have been proposed in the literature. Section 6 concludes.
2
Likelihood prediction
An elegant survey on the methods of likelihood prediction is given in Bjørnstad (1990). Often, the prediction statement is summarized in terms of probability inequality which is called the prediction interval. A review of the di¤erent methods of producing non-Bayesian prediction interval is presented in Patel (1989). To illustrate the likelihood prediction we take a classic example (see Example 1) that was presented in Pearson (1920), with a reference to Laplace (1774) as the originator, and also discussed by many others including Hinkley (1979), Bjørnstad (1990) and Pawitan (2001).
Example 1. An event has occurred p times out of p + q = n trials, where we have no apriori knowledge of the frequency of the events in the total population of occurrences. What is the probability of its occurring r times in a further r + s = m trials?
Example 1 can be translated in terms of the notation system given in Section 1 as: Y = (Y1; Y2; ; Yn) are iid Bernoulli distributed with E (Yi) = ; Y = (Y1; :::; Ym) ; Yi?Yj 8i&j;
Pn
i=1yi = p; S = Pmj=1yj = r and the interest is to predict r given p, n and m: Example 1
quali…es as a fundamental statistical problem which was solved in Laplace (1774) with some di¢ culty (see Pearson, 1920; Stigler, 1986) using the Bayesian approach. The Bayesian solution to the problem is straightforward and with a ‡at prior for the posterior predictive distribution of r is given as (see Bjørnstad(1990))
p (rjp; n) = m r n p m+n r+p n + 1 n + m + 1; r = 0; 1; :::; m (1) Due to the unavailability of the concept of prior distribution, a non-Bayesian solution is not easy to formulate. If were known, the distribution of r would be Binomial with mean m : Hence a non-Bayesian mean predictor of r would be E (rj ; m) = m : Thus, a naive prediction (NP) of r is given as er = mpn where is replaced by its maximum likelihood (ML) estimate obtained from the observed data. Though, b = np is the maximum likelihood estimator of ; er is not a maximum likelihood predictor. In fact, classical likelihood theory does not allow its application as a predictive criterion (Hinkley, 1979). A likelihoodist sees the above problem as the one dealing with two unknowns, and r where r is of inferential interest and is considered as a nuisance parameter. The above line of thinking leads the likelihoodists to construct a joint likelihood function (Bjørnstad, 1990) of and r as
L (r; jp; m; n) = L (rjm; n; p; ) L ( jp; m; n) = m r n p p+r(1 )n+m p r
Alhough L (r; jp; m; n) is justi…ed as a likelihood for prediction, the likelihood principle does not state clearly what one should do with and how the information about r contained in L (r; jp; m; n) should be extracted (Berger and Wolpert, 1989). At this point the likelihoodists introduce the method of pro…le likelihood (Pawitan, 2001) which essentially maximizes the
likelihood with respect to a subset of parameters treating the remaining parameters as constants (known). For Example 1, we have the following pro…le likelihood.
Lp(rjp; m; n) = supL (r; jp; m; n) ) Lp(rjp; m; n) / m r n p (p + r) p+r(m + n p r)m+n p r
The likelihoodists treat Lp di¤erently from the formal (or estimative) likelihood in the sense
that Lp is often normalized to mimic a Bayesian posterior density for r. Such a normalization
is justi…ed since r; unlike the …xed parameters , has a probability distribution. Using Stirling’s approximation to Lp(rjp; m; n) it can be shown that
Lp(rjp; m; n) / rp (rjp; n)
b 1 b
(2)
where, p (rjp; n) is the Bayesian posterior predictive density of r under a ‡at prior and b = m+np+r
is obtained from maximizing L (r; jp; m; n) w.r.t. : A critical drawback of Lp(rjp; m; n) is that
it replaces the nuisance parameter with its MLE thereby introducing an additional uncertainty in the predictive distribution which in turn calls for some adjustment. We also see that a multiplicative adjustment term of
r
b 1 b makes L(1)p (rjp; m; n) = p (rjp; n) where L(1)p =
r
b 1 b Lp is the pro…le adjusted predictive likelihood:
Further note that the adjustment term has the form r
b 1 b / I 1=2
=b where I =b is the
observed Fisher’s information of obtained from log (L (r; jp; m; n)) i.e. I = @2log(L(r; jp;m;n))@ 2 .
In matter of fact, the adjustment can always make L(1)p (zjy) / p (zjy) up to an order O n 1
(Davison, 1986). Thus we treat L(1)p as equivalent to the Bayesian posterior prediction (PP)
with a ‡at prior.
The equivalence of the predictive likelihood and the posterior predictive density with ‡at prior is easy to understand. The Bayesian posterior with ‡at prior is mathematically equivalent to the (estimative) likelihood function and herefore if there exist any predictive likelihood, then the latter should be equivalent to the posterior predictive distribution with a ‡at prior.
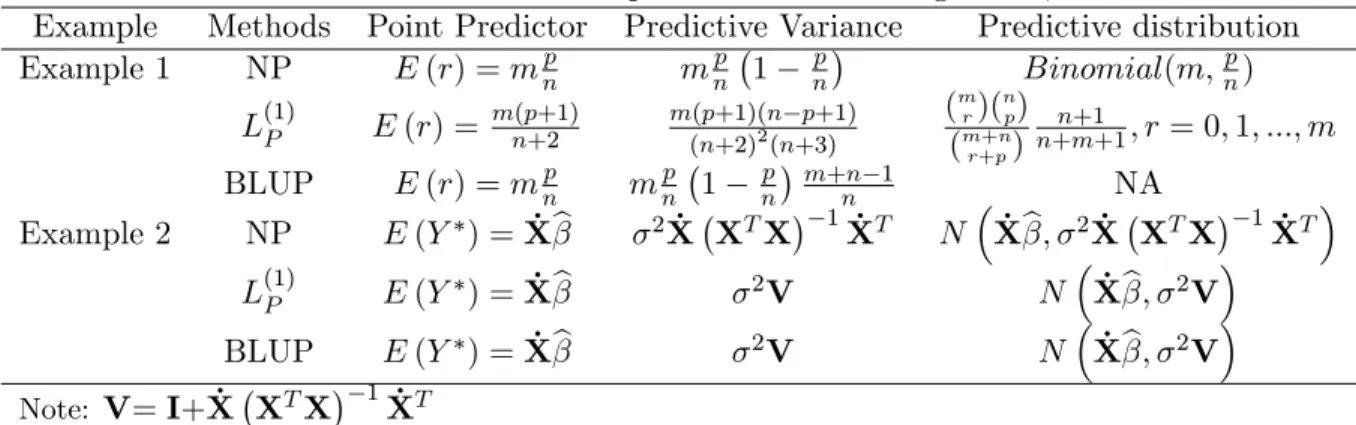
Predictive statistics for Example 1 and Example 2, below, are given in Table 1. For m = 1, L(1)p (or PP) gives E (rjp; m = 1; n) = P (r = 1jp; m = 1; n) = n+2p+1 which is di¤erent from the
NP which iser = np (see Table 1): Thus the di¤erence between NP and PP matters in cases with small n and extreme observed p:
Example 1 is a nice example of statistical prediction with independently and identically distributed (iid) variables. Next we illustrate the problem for a situation with non-identical distribution by using an example of a linear regression model.
Example 2: Assume a regression model, yi = + xi+ "i where, "i iid
N 0; 2 with being
known: We observe the paired sequence fyi; xig ; also xj are known but we do not observe
yj. The problem here is to predict those unobserved yj’s which are observable in the future.
In Example 2, we have observed data, y = fyig and X = fxig, unobserved future values
y = (y1; y2; :::; ym)T, known future covariates, _X = fxjg and nuisance parameters = ( ; ) :
A naive prediction of yj is given as yej = b + bxj where, b and b are the ordinary least square
estimates (also the MLEs in this case) of and obtained from the observed data. A naive variance estimator for yj is given as V ar eyj = V ar (b) + x2
jV ar b + 2xjCov b; b which
does not account for the uncertainty in yj itself. A reasonable measure of uncertainty in eyj is easily computed in this case and is given by V ar yej = 2 1 + _xj XTX
1
_
xTj where _xj is
the jth row of the design matrix, _X: yej is known as the best (having minimum mean squared prediction error) linear unbiased predictor (BLUP).
In cases where is unknown it is replaced by its unbiased estimate, i.e. e2 = n 21 Pni=1 yi b bxi 2
: The pro…le adjusted predictive likelihood for Example 2 is given as
L(1)P (Y jy; ) / exp 1 2 2 yF XFb T yF XFb j 2 XTFXF 1 j 12 ) L(1)P (Y jy; ) / exp 1 2 y Xb_ T 2 I+ _X XTX 1X_T 1 y Xb_ (3)
where, yFT = yT; y T is the full response vector, b is the MLE of = ( ; )T based on the full data, XT
F = XT; _XT and b = b; b T
is the MLE based on the observed data. The detailed mathematical derivation of (3) is given by Eaton and Sudderth (1998).
The predictive likelihood in (3) is the kernel of a multivariate normal distribution, i.e. L(1)P (y jy; ) N(N n) Xb;_ 2V where, V = I + _X XTX
1 _
XT: Hence, in this exam-ple the naive prediction coincides with the mean of the predictive likelihood1. The predictive statistics for Example 2 are presented in Table 1:
Table 1 Predictive statistics for Examples 1 and 2 according to NP, LP and BLUP Example Methods Point Predictor Predictive Variance Predictive distribution Example 1 NP E (r) = mnp mnp 1 pn Binomial(m;np) L(1)P E (r) = m(p+1)n+2 m(p+1)(n p+1) (n+2)2(n+3) (m r)( n p) (m+n r+p) n+1 n+m+1; r = 0; 1; :::; m BLUP E (r) = mnp mnp 1 np m+n 1n NA Example 2 NP E (Y ) = _Xb 2X X_ TX 1X_T N Xb;_ 2X X_ TX 1X_T L(1)P E (Y ) = _Xb 2V N Xb;_ 2V BLUP E (Y ) = _Xb 2V N Xb;_ 2V Note: V= I+ _X XTX 1X_T
Example 2 is still a simple one. To introduce more di¢ cult situations, we next present prediction with generalized generalized linear mixed models.
1
If 2 is unknown, the above mathematical derivation becomes very tedious therefore, we skip the latter case. Interested readers are referred to Bjørnstad (1990) for further results .
3
Prediction with GLMM
For observed Y and X; a generalized linear mixed model can be presented through the following …ve assumptions: i) Y = fyiktg ; i = 1; 2; :::; nkt; k = 1; 2; :::; K; t = 1; 2; :::; T ; is observed
independently at a given value of the covariate X = fxiktg ; and a given realization of the random
e¤ect ukt, ii) xiktand uktin‡uence the distribution of yiktvia a linear function ikt= xikt + ukt
which is called the linear predictor, iii) conditional on ukt, ki = E(ykijuki) satis…es g( ) =
for some function g which is called a link function, iv) conditional on ut= (ut1; ut2; :::; utK)T,
the distribution of yikt belongs to the exponential family of distributions and v) ut follows a
marginal distribution, h(u): Often, ut is assumed to have an independent multivariate normal
distribution i.e. utv NK(0; D) :
An example of GLMM can be given from a spatial data example, e.g. the analysis of Pittsburgh air particulate matter (PM) data (Lee et. al, 2006; section 8.6.3). Assume that yikt
represent the ithmeasure (replication) on PM at the kthsite on the tthday. The covariate matrix, X; includes seasonal indicators and the measures on daily weather conditions. The random e¤ects, ut; represent random site e¤ect which can be explained as the daily random cite-speci…c
‡uctuations, where a non-diagonal D implies that the observations from the di¤erent sites are correlated. Unlike the analysis in Lee et al. (2006), the aim in this application is to predict future PM, Y = ykt0 ; or some function of it, S = s (Y ) where t0 > T but the number of sites
(K) is …xed. Further assume that the design matrix, associated with y , can be partitioned as _
X = X_Cj _XS where _XC is currently known, e.g. the seasonal indicator, and _XS is currently
unknown, e.g. the precipitation, wind speed etc., and can only be observed in the future. The above prediction problem …ts well under the framework of unobservable variables, nui-sance variable and parameters’likelihood presented in Berger and Wolpert (1988; sections 3.5.2 and 3.5.3). In this case = Y ; _XS is the unobserved variable, with Y being of interest, the random e¤ects u is the nuisance variable and any parameter in the distributions of Y; and u is a nuisance parameter. For further derivation of the predictive criteria we can use the "nuisance variables likelihood principles" (Berger and Wolpert, 1988).
3.1 Derivation of the predictive likelihood for GLMM
In general, with GLMM, we have observed data, X = (XC; XS) where XC consists of
non-stochastic and XSconsists of stochastic covriates and y = fyiktg (i = 1; 2; :::; nkt; k = 1; 2; :::; K; t =
1; 2; :::; T ); future covariates _X =nX_jkt0;C; _Xjkt0;S
o
(t02 (1; 2; :::; max (t0; T ))) of which _X jkt0;C
is currently known, future response, y =nyjkt0
o
, which we want to predict and ut and ut0 are
the random e¤ects which are independently distributed as N (0; D) where D is an unknown but …xed positive de…nitive matrix. Denote = ( ; ; vech (D)) and the parameter vector in the distribution of _XS as = ( 1; :::; F). Assuming no overlap between and ; i.e. \ = ? ,
the joint likelihood function for this case is given by
L ( ; u; ; jy; X; XC) = f y; ; u; _XSj ; ;X; _XC (4)
= f y; y jX; _X ; u; f (XS; XSj ) f (ujD) (5)
The principle of marginal likelihood (Berger and Wolpert, 1988) says that any nuisance variable should be integrated out from the likelihood at the …rst hand. Without loss of generality we can
denote the clusters (k dimension) in observed data with 1 to K and any cluster appears in the predictive space but not in observed data with (k + 1), (k + 2) and so on up to K0 and do the same for t which goes up to T0. Therefore, the joint likelihood of ; ; is given by
L ( ; ; jY ) = Z Z 1 1 max(T;TY 0) t=1 f y; y jX; _X ; u; f XS; _XSjX; _XC; f (utjD) d (ut) (6) The integration in (6) is generally analytically intractable even for the observed data likelihood (Lee et al. 2006). For the GLMM, equation (6) can be presented in matrix notations as
L ( ; ; jY ) = 0 @Z Z 1 1 max(T;T )Y t=1 exp " yF;t tT 1Tb ( t) + 1Tc yF;t; # f (ut) d (ut) 1 A L _XS; (7) where yF;tT= yTt; ytT is the vector of observed and unobserved responses, = f iktg is the vector of canonical parameters such that with canonical link t = t = XF;t + Ztut where
XF = XTt; _XtT T is the design matrix associated with for the data set at t (quarter) and Zt
is the design matrix associated with ut= u1t; u2t; :::; uK0t T, b () is called the cumulant function
and it is a function in "S" convention i.e. b ( 1; 2) = (b ( 1) ; b ( 2)), is the dispersion parameter of the conditional mean model and L X_S; = f XS; _XSjXC; _XC; . For binomial and
Poisson GLMM, = 1:
Applying Laplace approximation to (7) the joint likelihood is simpli…ed , after ignoring terms having zero expectation (see Breslow and Clayton, 1993; section 2.1), as
L ( ; ; jy) jI+D 1ZWZTj 12exp y
T F 1Tb ( ) 1 2tr D 1uTu 1Tc (y F; ) ju=eu L X_S; (8) where W is the GLM weight matrix (McCullagh and Nelder, 1989) and ue = futgT0 K0 is the
maxima of the integrand function in (7) w.r.t. u: For the detailed derivation of (8) readers are referred to Breslow and Clayton (1993) and Wand (2002).
The remaining task is to eliminate the nuisance parameter ; and _XS from the model. Since _XS has probability distribution it can either be integrated out or pro…led out while and can only be pro…led out. Since, adjusted pro…le likelihood is same as integrating the nuisance parameter out using Laplace approximation, we can pro…le out ! = ; ; _XS altogether from (8). Thus we obtain the pro…le adjusted predictive likelihood for Z as
L(1)P y jy; X; _XC = LP y jy; X; _XC jI (b! ) j 1=2 (9)
where, LP y jy; X; _XC = sup !
n
l !; y jy; X; _XC o with l = log L !; y jy; X; _XC and I (b! ) = fIvw(!b )g with Ivw(!b ) = @!@2l
v@!w j!=b! is the observed information matrix for
! with …xed y . Although equation (9) looks simple, its exact analytical derivation may be challenging, depending on (8). After L(1)P has been computed one can predict Z from (9) in the following two ways (Bjørnstad, 1996)
Also base any statistical inference on the normalized L(1)P (y jy) and
b) ML prediction: predictby that maximizes L(1)P (y jy) ; for continuous Y; and treat L(1)P (y jy) as a likelihood function to make inference on y :
Bjørnstad (1996) prefers the mean prediction over the ML prediction considering the short-comings of ML for the correlated data e.g. b and y are not, in general, invariant under one–to–one parameter transformation. Since L(1)P is the approximate Bayesian posterior predic-tive density with ‡at prior, we may use the available Bayesian MCMC procedures (Gelman et al., 2004) to facilitate the computation of ^y as the posterior mode or the posterior mean:
The prediction problem and its approximate likelihood solution presented in (4)–(8) are quite general. The above technique is also applicable to the prediction of credit defaults under the modeling framework of Carling et al. (2004) and Alam (2008). For further simpli…cation of predictive density (9) we require speci…c model for Y and XS: In the following section some
special cases and their respective simpli…cations of (9) are presented.
4
Examples of likelihood prediction under covariate uncertainty
Prediction problems with GLM and GLMM appear in may applications and they are dealt with a variety of ways, some of which are mentioned in Section 1. We pick some examples from the existing literature and give their solutions via the predictive likelihood approach. The examples are not purposively selected; they were the only articles on prediction with GLM and GLMM under uncertainty in the response or the covariates found in the existing literature. Example 3 is related to survey sampling and arises because of an error-in-variable super population model as presented in Bolfarine (1991).
Example 3 Assume a …nite population denoted by P = (1; 2; :::; N) ; where N is known and we draw a random sample of size n from P. We denote the sample observations by y = fyigni=1
and the unobserved part of the population by y =nyjoN
j=n+1: After observing the sample,
the target is to predict the …nite population total, i.e. T =Piyi+Pjyj and to provide a
measure of uncertainty about the prediction: However, the yi’s are not directly observable,
instead we have to use some instrument to measure yi which gives the observation Xi such
that Xi = yi+ i where i is a random error which is independent of yi:
We assume that yi’s are realizations of Yi from a super-population following a normal
dis-tribution with some constant mean and variance. We also assume that i’s follow the normal
distribution with mean 0 and a constant variance: Under these assumptions a naive predictor of T is eT = N X; where X = 1nPni=1Xi and the variance of eT readily found with the NP becomes
BLUP (Bofarine, 1991).
The above assumptions imply that XijYi = yi v N yi; 2 . Let, = ( ; ; ) and =
(y1; :::; yN) ; X = (X1; X2; :::; Xn) ; X = Xn+1; :::; XN with T =
P
iyi +Pjyj being of
interest. For simplicity, we assume and are known2. The above normality gives the following likelihood
L ; ;X = n Y i=1 (f (Xijyi; ) f (yij )) N Y j=n+1 f Xjjyj; f yjj 2
See Bolfarine (1991) and Buzas and Stefanski (1996) for further discussion on the problems induces by unknown and
) L ; = n Y i=1 (f (Xijyi; ) f (yij )) N Y j=n+1 Z Xj f Xjjyj; f yjj dXj = n Y i=1 (f (Xijyi; ) f (yij )) N Y i=n+1 f (yij ) ) L ; _ exp 2 4 1 2 8 < : n X i=1 yi Xi 2 + n X i=1 yi 2 + N X j=n+1 yj 2 9 = ; 3 5
Denoting, Y = N1 Pni=1yi+PNj=n+1yi we have
L(1)P ( jX; ; )_ exp 2 4 1 2 8 < : n X i=1 yi Xi 2 + n X i=1 yi Y !2 + N X j=n+1 yj Y !2 9 = ; 3 5 (10) Di¤erentiating (10) w.r.t. yi and setting them to zero gives Pni=1yi =Pni=1Xi. Again doing
the same for yj we have PNj=n+1yj = NnnPni=1Xi. Adding the above two results we obtain
b
T = Nn Pni=1Xi = N X: The above bT is an unbiased estimator for T and its variance can be
calculated as V ar Tb T = V ar N Xs N X i=1 Yi ! = N1 f f 2+N f 2
where, f = Nn: From equation (??) we see that L ; is proportional to the Bayesian posterior
with ‡at prior. The Laplace approximation applied to L ; in order to obtain L(1)P ( jX; ; )
is exact since the log-posterior is a quadratic function. Thus the Bayesian solutions presented in Bolfarine (1991) are identical to the predictive likelihood solutions. The above bT is also the BLUP (Bolfarine, 1991).
Example 3 deals with measurement uncertainty in the response but not in the covariates. A theoretical example of dealing with uncertainties both in the Y and the X space under the linear model’s framework is also presented in Bolfarine (1991). Next, Example 4 gives a prediction problem with GLM under covariate uncertainty. We consider a Poisson GLM with one covariate which is measured with error. This example is originally presented in Huwang and Hwang (2002) but their method of solution was di¤erent.
Example 4: Consider a Poisson model, YijUi v Poisson ( i), log ( i) = i = 0+ 1Ui and
Xi = Ui+ i 8i = 1; 2; :::; n. We also assume that Ui v N u; 2u ; i v N 0; 2 and
Ui ? j 8i; j: Our target is to predict Yn+1 = yn+1 when Xi, i = 1; 2; :::n + 1; and yi
,i = 1; 2; :::; n, are observed but Ui’s are not observable.
From the virtue of the normality and independence of U and we have Vi = (Ui; Xi)T =
N2(12 u; ) where, 12 is a 2 1 column vector of 1’s and = 2
u 2u 2
u 2u+ 2
. Denote, = 0; 1; u; 2u; 2 and = (Yn+1; U1; :::Un+1). Using the independence assumption we can
construct the following joint likelihood L ; = f yn+1j ; Un+1; Xn+1 f (Un+1; Xn+1j ) n Y i=1 f (yij ; Ui; Xi) f (Ui; Xij ) (11)
The second term in the right-hand-side of equation (11) is the pdf of a bivariate normal distri-bution. Therefore, the joint distribution of f (Ui; Xij ) in the likelihood can be factored as
f (Ui; Xij ) = f (UijXi ) f (Xij )
De…ning, E (UijXi) = 0+ 1Xi and 2 = V ar (UijXi) where, 0 = (1 1) u; 1=
2 u 2 u+ 2 and 2 = 2 u 1 2 u 2
u+ 2 . Now, using the usual tricks for bivariate normal distribution (see Berger
and Wolpert (1988), pp–41.4) it can be shown that X = (X1; X2; :::Xn) is ancillary for 0; 1;
and U . Hence, f (Xij ) carries no information about the parameters needed for prediction and
it can therefore be ignored in the construction of the predictive likelihood. Thus, the joint likelihood (11) reduces to L ; / exp yFT 1Tb ( ) c (yF) 1 n+1exp " 1 2 2 n+1 X i=1 (ui 0 1Xi)2 # ) L ; / exp yTF 0 1Tb 0 c (yF) 1 0n+1 exp " 1 2 02 n+1 X i=1 u02i # (12) where yTF = y1; :::; yn; yn+1 ; 0 = 00+ 01xi+ u 0 i; 0 0 = 0+ 1 0; 0 1 = 1 1; 0 = 1 and
u0i = 1(ui 0 1Xi) : Note that the equation (12) is the joint likelihood of a Poisson-Normal
mixed model. Thus we conclude that the prediction problem under the measurement error in GLM reduces to the prediction problem with its GLMM analogue. However, an exact analytical solution of the problem is not possible. In absence of an exact analytical solution we may obtain L(1)P through Bayesian posterior simulation.
As a competing approach, Huwang and Hwang (2002) suggested a pseudo likelihood (P sL) method for the prediction with Poisson error-in-variable model. We consider P sL as the bench-mark to compare with L(1)P . In order to compare the performance of L(1)P with the P sL, we conduct a simulation study with 0 = 1 = 1, u = 0; 2u = 0:25 and 2 = 0:1 and 0:25. We consider the sample sizes to be n = 30; 50; and 100 and predict one out of sample re-sponse (yn+1) based on the observed data and Xn+1: The choice of the parameter value and
sample size matches Huwang and Hwang (2002). The computation of the L(1)P is carried out through Bayesian posterior simulation implemented in OpenBugs (Spigelhalter, 2007). A ‡at prior, U nif orm(0; 100) for 0 and N (0; 10000) for 0
0 and
0
1 was used for the Bayesian model.
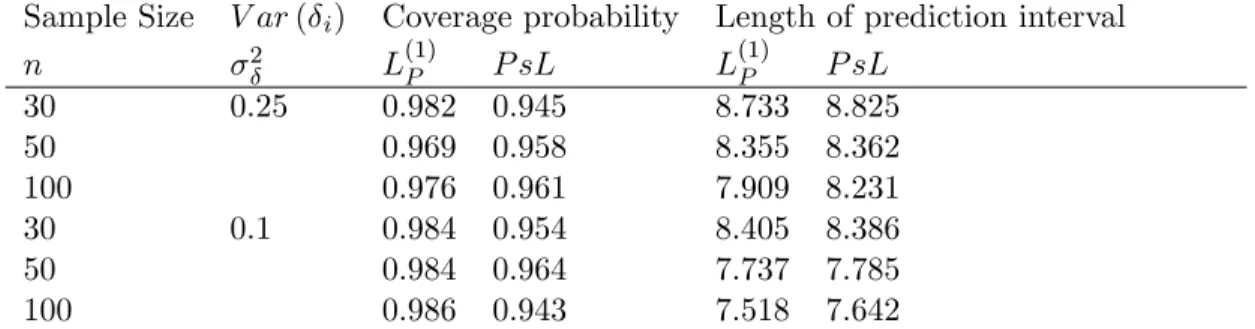
We compare the performances of L(1)P and P sL in terms of the coverage interval and the average length of prediction intervals for a nominal level, 0:95. We use 1000 Monte-Carlo replication to
obtain the results which are presented in Table 2.
Table 2 Coverage Probabilities and the average length of prediction intervals for the Poisson error-in-variable prediction (Example 4) with nominal probability 0.95. Sample Size V ar ( i) Coverage probability Length of prediction interval
n 2 L(1)P P sL L(1)P P sL 30 0.25 0.982 0.945 8.733 8.825 50 0.969 0.958 8.355 8.362 100 0.976 0.961 7.909 8.231 30 0.1 0.984 0.954 8.405 8.386 50 0.984 0.964 7.737 7.785 100 0.986 0.943 7.518 7.642
Note: The results of theP sLare quoted from Huwang and Hwang (2002)
Though the coverage probability for L(1)p exceeds the nominal level by a big margin (Table 2), it
may not be a problem of L(1)P ; rather it may be due to discrete predictive distribution for which an exact 95% prediction interval may not be possible to construct. However, L(1)p guarantees
that the coverage probability is not less than the nominal level while keeping the average length of the prediction interval shorter than P sL: The average length of the L(1)P decreases at a rate faster than P sL as the sample size increase.
In the simulation, 2u and 2 are quite small and therefore a naive prediction implemented through a simple Poisson GLM of y on X does not perform bad. For example, with n = 30; 2u = 0:25 and 2 = 0:25 a 95% prediction interval of a simple GLM gives 94% coverage probability. However, as we increase the variance parameters to 2u = 1:25 and 2 = 1:25 and set 0 = 0:5 and 1 = 1:5 with n = 30; the simulation results for 95% prediction interval in L(1)P still having a 98% coverage probability whereas a naive GLM prediction interval covers the true future values only in 77% cases.
The …nal example of prediction with GLMM under covariate uncertainty is a hypothetical model for credit risk prediction.
Example 5: Let us assume that a portfolio of loans consists of nkt loans in industry k, k =
1; 2; :::; K at time t, t = 1; 2; :::; T: The event that the ithloan in industry k is default at time t is given by yikt which takes the value 1 if the loan defaults and 0 otherwise. Further,
assume that the default probability is modeled as a binomial GLMM. In predicting a default event at time t + 1; the information path at t is observed while some of the future covariates are unknown at the time. For simplicity we assume that there are p+1 covariates and only the value of the last covariate, _Xjk(T +1)(p+1)is unknown at time T although the covariate, Xikt(p+1); is known to follow an AR (1) process.
For simplicity we set p = 3 and assume that the random time e¤ects in cluster k at each time t is distributed as ukt v N 0; 2k , ukt ? uk0t08k 6= k0 & t 6= t0. Denote, the future
_
Xjk(T +1)(p+1) = x and we want to predict E yjk(t+1) = jk(t+1): A naive approach would suggest predicting x from the historical data on X and then predict jk(t+1) as if x were known and that the other model parameters also were known and equal to the MLE obtained from the observed data up to time T . However, for the likelihood principle, the joint likelihood,
considering all the uncertainties, is given as l ( ; y ; jy; x) =
Z
exp yFT 1Tdiag fb ( )g f (u) f (x jx) f (x) dudx
) l ( ; y ; jy; x) = Z exp " X t X k X i
yikt ikt b ( ikt) !# 1 q 2 2 k exp u 2 kt 2 2k f (x jx; ) f (xj ) dudx
where ikt = 0 + 1x1ikt+ 2x2ikt + ukt and represents the parameter vector required to
model X. Assuming, X2ikt varies only over t an AR(1) precess on X is de…ned as Xt+1 =
+ Xt+ et; j j < 1 and et v iid N 0; 2e giving = ; ; 2e : The assumptions lead to a
simpli…cation of the joint likelihood l ( ; y ; jy; x) = Z exp " X t X k X i
yikt ikt b ( ikt) !# 1 q 2 2k exp u 2 kt 2 2k : f xT +1jxT; f (x1j ) T +1Y t=2 f (xtjxt 1; ) dudx (13)
Thus, in order to estimate parameters we only need to maximize the second line of (13). However, under likelihood principle we consider the full likelihood (13) for the prediction of x while in a formal time series prediction (forecasting) one would predict x only on the basis of the the second line in (13).
5
Motivations of
L
(1)PWe provide likelihood solution of the selected examples through pro…le adjusted predictive like-lihood, L(1)P : However, L(1)P is not the the only choice to carry out likelihood prediction. Initially L(1)P was motivated through its approximate equivalence of Bayesian posterior with ‡at prior (Davison, 1986). In this section we show that, apart from the Bayesian justi…cation, L(1)P does have other attractive explanations.
Bjørnstad (1990) surveyed 14 di¤erent types of predictive likelihoods. Many of them are equivalent but not all of them comply with the likelihood principle. Bjørnstad (1996) presented a de…nition of the proper predictive likelihood based on the likelihood principle. A predictive likelihood L (y jY ) is said to be proper if, given two experiments E1 and E2, L (y; y jE1) /
L (y; y jE2) implies L (y jy; E1) / L (y jy; E2) : According to the above de…nition, only 5 out 14
predictive likelihoods surveyed in Bjørnstad (1990) qualify as the proper predictive likelihoods. Denoting b as the MLE of based on observed data only and b as the MLE of based on both observed and unobserved data the proper predictive likelihoods are given as
1. Le = L y jy; = by where, . Le is called the estimative likelihood.
3. L(1)P = L y jy; = b jI b j 1=2 where, I = @2log(L (z;y))
@ @ T j =b which is called
pro…le adjusted predictive likelihood. 4. L(2)P = L(1)P @b
@b which is a transformation invariant version of L (1) P :
5. L(3)P = sup nsupL (y;y )
y ff (y jy)g
o
Bjørnstad (1996) did not o¤er any discussion as to whether all of the above 5 predictive like-lihoods are equally as good. However, a careful inspection of the above 5 predictive likelike-lihoods reveals that all of them are based on the joint likelihood and they di¤er only in the way they pro…le the nuisance parameters out of the joint likelihood. Like the naive approach, Le does
not take into account the fact that the parameter by is estimated. Hence, Le undermines the
uncertainty associated with the prediction. LP can be recognized as the …rst order Taylor’s
ap-proximation to the joint likelihood around = b while the second order Taylor’s approximation to log(L (y; y )) around b gives
L (y; z) L zjy; = b exp b TI b b
Assuming normality of b i.e. g b j = N ; I b 1 we have
L (y; y )
L y jy; = b exp b T I b b
g b j g b j
) L (y; y ) L y jy; = bz jI b j 1=2g b j (14)
From (14), we see that
L (y; y ) L(1)P g b j
where L(1)P contains information only on y and g b j contains all the information on in addition to partial information on y . Therefore, the amount of information on y contained in g b j is likely to be small compared to that contained in L(1)P and may be negligible. Under the above, assumption, L(1)P is also the partial likelihood of y . Again, L (y; y ) = f (y; y j ) and f y; y ; bj = f (y; y j ) implies that L(1)P is the approximate conditional distribution of y and
y given = b i.e., L(1)P f y; y j = b . Thus, L(1)P does not have to be motivated through the Bayesian argument rather it has its own frequentist interpretation which is missing for the other proper predictive likelihoods. L(2)P is applicable only if b can be expressed as a function of b which is not possible while we need to use numerical method to obtain the maximum likelihood estimator. L(3)P is also a …rst order Taylor’s approximation around a di¤erent estimate of than by and b :
6
Concluding discussion
This paper demonstrate that the likelihood principle gives a uni…ed analytic framework for predictive inference. For a particular problem in hand, one might be able to …nd a technique e.g. BLUP for linear models, which enjoy some nice frequentist properties. However, a generalization of those techniques may be challenging. In contrast, pro…le predictive likelihood method provides a general and uni…ed principle and method. The exact computation of the pro…le likelihood may be problematic. Moreover, the lack of computational procedures for pro…le predictive likelihood is also a hindrance in implementation. We leave the last two issues for possible future work.
Though there are many predictive likelihoods in the literature we prefer pro…le adjusted pre-dictive likelihood, L(1)P ; for the following reasons. First, it has nice frequentist explanation (see section 5) and second, due to its equivalence of Bayesian posterior distribution (Davison, 1986), the computation of it can be carried out by using existing Bayesian computational procedures such as by using WinBugs. For a Poisson error-in-variable GLM (example 4), we carry out pre-dictive inference through Bayesian posterior simulation by using OpenBugs. Simulation results show that L(1)P performs better than the pseudo likelihood approach and the naive approach.
References
[1] Alam, M. and Carling, K. (2008), Computationally feasible estimation of the covariance structure in Generalized Linear Mixed Models (GLMM), Journal of Statistical Computation and Simulation, 78(12), 1227-1237.
[2] Alam, M. (2008), An e¢ cient estimation of the generalized linear mixed models with cor-related random e¤ects, in P. Brito (edt.), Proceedings of COMPSTAT’2008 (Vol. II: Con-tributed Papers), 853-861, Physica-Verlag, Heidelberg.
[3] Berger, J. O. and Wolpert, R. L. (1988), The Likelihood Principle, The IMS Lecture Notes-monograph Series 6, IMS, Hayward.
[4] Bjørnstad, J. F. and Sommervoll, D. E. (2001), Modelling binary panel data with non-response, Discussion Papers No. 297, Statistics Norway, Research Department.
[5] Bjørnstad J. F. (1996), On the generalization of the likelihood function and the likelihood principle, Journal of the American Statistical Association, 91(434), 791-806.
[6] Bjørnstad J. F. (1990), Predictive likelihood: a review (with discussion), Statistical Science, 5(1), 242-256.
[7] Bolfarine, H. (1991), Finite population prediction under error-in-variables subpopulation models, The Canadian Journal of Statistics, 19(2), 191–207.
[8] Breslow, N. E. and Clayton, D. G. (1993), Approximate inference in generalized linear mixed models, Journal of the American Statistical Association, 88, 9-25.
[9] Buzas, J. S. and Stefanski, L. A. (1996), Instrumental variable estimation in generalized linear measurement error models, Journal of the American Statistical Association, 91(435), 999-1006.
[10] Carling, K., Rönnegård, L. and Roszbach, K. (2004), Is …rm interdependence within in-dustries important for portfolio credit risk?, Sverige Riksbank Working Paper Series No. 168.
[11] Davison, A. C. (1986), Approximate predictive likelihood, Biometrika, 73(2), 323-332. [12] Du¢ e, D., Saita, L. and Wang, K. (2007), Multi-period corporate default prediction with
stochastic covariates, Journal of Financial Economics, 83, 635-665.
[13] Eaton, M. L. and Sudderth, W. D. (1998), A new predictive distribution for normal multi-variate linear models, Sankhy¯a: The Indian Journal of Statistics (A), 60(3), 363-382. [14] Gelman, A., Carlin, J. B., Stern. H. S. and Rubin, D. B. (2004), Bayesian Data Analysis,
Chapman and Hall/CRC.
[15] Hinkley, D. V. (1979), Predictive likelihood, The Annals of Statistics, 7(4), 718-728. [16] Honoré, B. E. and Kyriazidou, E. (2000), Panel data discrete choice models with lagged
dependent variables, Econometrica, 68, 839-874.
[17] Huwang, L. and Hwang, J. T. G. (2002), Prediction and con…dence intervals for nonlinear measurement error models without identi…ability information, Statistics and Probability Letters, 58, 355–362.
[18] Laplace, P. S. (1774), Mémoire sur la probabilité des causes par les évènemens, par M. de la Place, in Mémoires de Mathématique et dePhysique, Présentés à l’Académie Royale des Sciences, par divers Savans & lûs dans ses Assemblées T. vi., 621-656 (Memories on the probability of causes of events, English translation by S. M. Stigler (1986), Statistical Science, 1(3), 364-378).
[19] Lee. Y., Nelder. J. A. and Pawitan, Y. (2006), Generalized Linear Models with Random E¤ ects: Uni…ed Analysis via H-likelihood, Chapman and Hall/CRC.
[20] Lauritzen, S. L. (1974), Su¢ ciency prediction and extreme models, Scandinavian Journal of Statistics, 1, 128-134.
[21] Patel, J. K. (1989), Prediction intervals - a review, Communications in Statistics: Theory and Methods, 18(7), 2393-2465.
[22] Pawitan, Y. (2001), In All Likelihood: Statistical Modelling and Inference Using Likelihood, Oxford University Press.
[23] Pearson, K. (1920), The fundamental problem of practical statistics, Biometrika, 13(1), 1-16.
[24] Pesaran, M. H., Scheurman, T., Treutler, B.-J. and Weiner, S. M. (2006), Macroeconomic dynamics and credit risk: a global perspective, Journal of Money Credit and Banking, 38, 1211-1262.
[25] Slud, E. and Kedem, B. (1994), Partial likelihood analysis of logistic regression and autore-gression, Statistica Sinica, 4, 89-106.
[26] Spiegelhalter, D., Thomas, A., Best., N. and Lunn, D. (2007), OpenBUGS User Manual (Version 3.0.2), URL:http://mathstat.helsinki.…/openbugs/Manuals/Manual.html (last ac-cessed June 09, 2010).
[27] Startz, R. (2008), Binomial autoregressive moving average models with an application to US recessions, Journal of Business and Economic Statistics, 26, 1–8.
[28] Stigler, S. M. (1986), Laplace’s 1774 memoir on inverse probability, Statistical Science, 1(3), 359-378.
[29] Wand, M. P. (2002), Vector di¤erential calculus in statistics, The American Statistician, 56(1), 1-8.