ANALYSIS OF THE IMPACT OF SOCIO-ECONOMIC DEVELOPMENT
ON ROAD SAFETY BASED ON THE EXAMPLE OF BALTIC SEA
REGION COUNTRIES
Kazimierz Jamroz
Gdansk University of Technology, Faculty of Civil and Environmental Engineering, Department of Highway and Transportation Engineering
11/12 Narutowicza, Gdansk, Poland
Phone: +48 583471147 E-mail: kjamroz@pg.gda.pl
Co-authors: Aleksandra Romanowska, Marcin Budzyński, Gdansk University of Technology, Faculty of Civil and Environmental Engineering, Department of Highway and Transportation Engineering, Gdansk, Poland
ABSTRACT
The Baltic Sea Region (BSR) is made up of countries that feature different levels of socio-economic development. This has persisted over the years making the socio-economic gap between Eastern and Central Europe countries (EEC) and Western Europe and Scandinavian countries (WEC) fairly big. While it has diminished as a result of the political transformations, the differences are still there. They can be seen in many areas, including road safety.
The objective of the article is to describe road safety over the last 25 years in BSR countries, analyse the effects of political and economic change and identify those factors of socio-economic development that have the strongest impact on a country’s road safety at the strategic level. Road safety is assessed using a risk-based method and societal risk is measured with the demographic road fatality rate between 1990 and 2014. The countries’ road safety has been classified on a scale of five risk levels with risk divided into acceptable, tolerated and unacceptable. Building on this, three groups of countries could be identified: Western European and Scandinavian countries (WEC), Central and Eastern European countries (EEC) and Russia separately (RUS), featuring low, moderate and high risk, respectively. It was observed that the particular country groups have a similar socio-economic situation and similar trends in how the measures change.
With a detailed analysis it was possible to identify the key factors that trigger long-term road safety changes. It was established that once a certain level of socio-economic development is exceeded, the road fatality rate drops. This goes hand in hand with the country’s increasing wealth and the related improvements to transport infrastructure, education and health care and less corruption. Analysis showed that in 1990 the baseline for the countries’ socio-economic development was strongly varied. It was observed that WEC countries saw a systematic change of risk versus other measures compared to a more dynamic yet less regular decreases in the EEC. The political transformation and European Union membership were the key turning points for the EEC leading to an accelerated rate of fatality reduction. Russia’s progress, however, has been much slower with less dynamism or regularity. The results will be used to develop predictive models of fatalities and analyse the conditions for implementation of Vision Zero in particular groups of countries.
1.
INTRODUCTION
Over the years growing motorization has put more emphasis on road safety. Today, road accidents are one of the most frequent causes of death worldwide (WHO, 2015). Having reached their record high road deaths, the majority of European countries have seen a systematic improvement of road safety. While this has been helped by new safety policies (e.g. Vision Zero), social and economic change has also been a major indirect contributor to better road safety. As countries grow richer, they are more likely to increase spending on health and education and the public is more aware of the risks of road traffic. As a result, risk is reduced as are the consequences of road accidents. This, however, raises some questions: how has road safety been changing in these countries over the last 25 years and what are the key factors that help the countries change their road safety levels?
The objective of the article is to evaluate road safety over the last 25 years in the Baltic Sea Region (BSR) countries and identify those factors of socio-economic development that have the strongest impact on a country’s road safety at the strategic level and analyse how they have been changing. The region is made up of countries that feature different levels of development, ranging from highly developed Western Europe and Scandinavian countries (Germany, Finland, Sweden, Denmark) to former Eastern bloc countries (Poland, Lithuania, Latvia, Estonia, Russia). The latter have seen major political and economic changes over the last 30 years. This has helped all these countries, except Russia, to join the European Union. As a region, the BSR is a vital part of Europe. It is home to some of the world’s most competitive economies and generates more than 30% of Europe’s GDP. Eastern and Central European countries (EEC) and Western European and Scandinavian countries (WEC) have been separated by a long-standing economic and social gap. While it has diminished as a result of the political transformation, the differences continue to influence different spheres of life, including road safety.
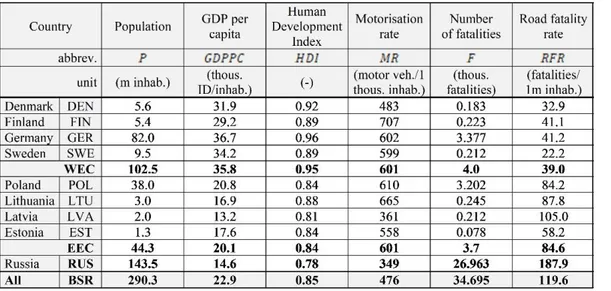
Table 1: Characteristics of Baltic Sea Region countries, 2014 .
It is clear from the countries’ selected social, economic and safety indicators (Table 1) that there is a marked difference between road safety in the highly developed WEC countries and the other countries (Sweden in particular) when it comes to their very low road fatality rates (BITRE, 2016; Johansson, 2009; Pihlak & Antov, 2004). Russia is on the other end of the spectrum with much higher road accident fatality rates. The other indicators also highlight major differences between the country groups under analysis. In particular, the WEC’s level of socio-economic development measured with gross domestic product per capita (GDPPC) and the human development index (HDI) significantly
exceeds that of the EEC and Russia. The level of motorization measured with motorization rate (MR) shows a different way to identify three groups of countries: countries with a high rate of motorization (Finland and Lithuania), countries with a medium rate of motorization (Poland, Germany, Sweden and Estonia) and countries with a low rate of motorization (Denmark, Latvia and Russia). As we can see, there is no single decisive factor of road safety in a country. It would be interesting to understand which of the socio-economic development factors have the strongest effect on a country’s level of road safety.
2.
BACKGROUND
At the strategic level a country’s level of safety depends on a number of factors. They are social, economic, spatial, cultural, transport, infrastructural and others. Previous research (Jamroz, 2012, 2015; Jamroz & Smolarek, 2013) suggests that economic and social factors play a major role. Economic growth involves an accumulation of national wealth and is related to what is a measurable sphere of the economy. The term “socio-economic development” means a process in which low national income economies transition to become modern economies. Social development is a process which offers people more choices that eventually lead them to enjoy long and healthy lives, gain knowledge and maintain a decent standard of living (UNDP, 1990). Socio-economic development, on the other hand, means that the economy and society of a country benefit from qualitative, quantitative and structural changes that they go through that enable an expansion of capabilities of people that enable them to lead the kind of lives they value and have reasons to value (UNDP, 2012). There are a number of socio-economic development measures such as (Jamroz, 2011):
economic: Gross Domestic Product per capita (GDPPC),
social: Population Density (DP), Percentage of Urban Population (PUP), Life Expectancy Index (LEI), Education Development Index (EDI), Corruption Perception Index (CPI), Alcohol Consumption per capita (ACPC), Motorisation Rate (MR), Percentage of Motor Vehicles (PMV), Usage of Safety Belts (USB),
integrated (socio-economic): Human Development Index (HDI) as a summary measure of average achievements in key dimensions of human development: a long and healthy life (LEI), being knowledgeable (EDI) and having a decent standard of living (GDP).
Safety including that of road transport users is one of the aspects that determine a country’s quality of life for its citizens and communities. The measures of socio-economic development are important stimulants to the development of safe vehicles, safe road infrastructure and medical rescue. They also help increase road user awareness of the risks involved in road traffic. As a consequence, road users can help shape the level of road safety.
A review of research reports shows a number of comparisons between changing safety levels on continents, in countries and regions (Akaateba, 2012; BITRE, 2016; Hermans, Brijs, Wets, & Vanhoof, 2009; WHO, 2015) using a variety of approaches from simple comparisons to identifying sets of main road traffic safety factors at a country’s strategic level (Akaateba, 2012; BITRE, 2014; Jamroz, 2012; Jamroz & Smolarek, 2013; Pihlak & Antov, 2004). Measured with GDP or GDP per capita, economic development is frequently quoted as having a strong impact on strategic level road safety. There is extensive literature (Bishai, Quresh, James, & Ghaffar, 2006; Brüde & Elvik, 2015; Jamroz, 2012; Koornstra, 2007; Kopits & Cropper, 2005; Page, 2001; Yannis, Papadimitriou, & Folla, 2014) which confirms that once fatal road accidents reach a peak and the economy keeps improving in the long-term road safety improves as well. The turning point’s particular GDP per capita varies from source to source and can range from $7,000 to $22,000 (Bishai et al., 2006; Jamroz, 2012; Kopits & Cropper, 2005). The rate of motorization features a similar trend – once fatalities reach a record high number, road safety improves despite a continuing growth of motorization (Brüde & Elvik, 2015; Page, 2001).
Socio-economic development can also be measured with the level of education, health care and quality of life. There are examples in the literature of the effects of health care (Ghee, Astrop, Silcock, & Jacobs, 1997) and economic activity (D’elia & Newstead, 2013; Żukowska, 2012) on road safety. Cultural differences also matter when it comes to safety, e.g. in the case of wearing seat belts (Cohen & Einav, 2003; Jamroz, 2013; Zambon, Fedeli, Visentin, & et al., 2007), alcohol consumption (Arranz & Gil, 2009; Bishai et al., 2006) or corruption (Oleinik, 2016; Teik Hua, Noland, & Evans, 2010). A country’s level of road safety is also determined by factors related to its spatial, infrastructural, technological and transport policies (Jamroz, 2011, 2012). Country strategic level analyses usually use variables related to the road network (length and density) and network structure (share of specific road types with emphasis on fast traffic roads) (Jamroz, 2010, 2012; La Torre, Domenichini, Corsi, & Fanfani, 2014).
3.
ASSESSMENT OF ROAD SAFETY IN BSR COUNTRIES
3.1. Method
Safety assessment is one of the key elements of road transport safety management. With risk management methods as the basis, a country’s safety assessment may be determined using strategic societal risk. Strategic risk is a type of systemic risk which covers the entire system of road transport. By analysing and assessing strategic societal risk international organisations, governments, local authorities and other organisations involved in an area’s safety management (road authorities, police, rescue services, health service) may take decisions on how best to change the high-risk elements of the road safety system and how to ensure that safety budgets are spent as efficiently as possible (McMichael, 1997; Rumar, 1988).
Two measures were applied to assess strategic societal risk levels: number of fatalities F as a general measure and the demographic road accident fatality rate (road fatality rate dependent on demography) RFR, as a normalised measure. The following is the relation between the measures:
where: RFRi,j is the road accident fatality rate in relation to demography, Fi,j is the total number of road
accident fatalities, Pi,j is the total population in the country under analysis i within a year j.
To ensure an objective road safety assessment, strategic societal risk classification was used as proposed in the work (Jamroz & Smolarek, 2013). To assess strategic societal risk over a year of analysis on a country’s road network, selected risk measures must be calculated (based on historical data) or estimated (using prognostic models). The next step is to establish the risk level according to the classification and check whether the road network’s specific risk is acceptable when compared against the agreed risk acceptability criteria. Quantitative criteria were applied to make the assessment. The idea for this approach is to determine the system’s risk boundaries, take steps to reduce the risk or stop the operation of the system. To assess strategic societal risk level, the risk level classification, risk acceptability rules and risk boundary selection were adapted. Because hypothetically strategic risk changes over time, it was assumed that the cut-off values of strategic risk change and depend on the level of socio-economic development and the distribution of RFR for the agreed GDPPC.
The RFR(P),b is calculated using a function dependent on the country’s level of socio-economic
development (measured with GDPPC) and miles travelled (measured with the average distance covered by vehicles per capita VTKPC). This relation is described using the power-exponential function (formula 2) whose parameters were selected with the multi-dimensional non-linear regression
method. The function was developed using a data set from 13 selected countries worldwide (that have had model characteristics for the last 50 years).
(2)
In order to determine the boundary functions between the areas (classes) of risk, the base RFR(P),b andRFR(P) quantile distributions were used (using parameters CV - the coefficient of variation, α - the
shape parameter, Γ – parameters of gamma distribution, p – level of probability). Formula 3 was used for the calculation.
The purpose of risk evaluation is to establish the analysed risk’s class of risk acceptability. A determination must be made of which risk bands include the evaluated risk. Similar to the EuroRAP road risk assessment programme, five risk classes were adopted as well as the corresponding strategic risk areas from A to E. The following is the classification:
acceptable risk: class A (very low – negligible) and class B (low – widely accepted but under control)
tolerated risk: class C (average – ALARP area), class D (high – tolerated under special conditions or over a short period of time),
unacceptable risk: class E (very high – unacceptable requires urgent action). Figure 2 shows the boundaries between the risk classes.
3.2. Results and discussion
The work included a comparative analysis. Its results are shown in Fig. 1 with time series of how both safety measures change (number of fatalities F and demographic road rate fatality rate RFR) in the particular countries between 1990 – 2014. Based on the number of fatalities F it was found that Russia played the biggest role followed by Germany and Poland. The other countries have recorded very low fatalities. In 2014 the BSR had a population of 290,000,000 with 34,700 people killed in road accidents (Table 1). Russia represents almost 50% of the region’s population and in 2014 the country recorded nearly 78% of the analysed countries’ road deaths. The EEC represents 15% of the population with nearly 11% of road deaths. The WEC accounts for 35% of the population and more than 11% of all road deaths. There is a clear relation between a country’s fatalities and its population. While the number of fatalities F should be considered when developing a global or continental road safety policy, it cannot be taken into account when assessing and comparing safety levels between countries. This kind of comparison does nothing to explain the reasons for the different safety levels. In all of the analysed countries fatalities were found to have dropped during the 25 years of analysis. In Russia these changes are highly differentiated. In the other countries fatalities are decreasing systematically.
Using the demographic road fatality rate RFR, substantial differences were found between levels of normalised strategic risk in the particular countries. In 2014 per 1 million population (Table 1) in Russia there were 188 road deaths, compared to the EEC’s average of 85 (from 58 in Estonia to 105 in Latvia) and an average of 30 people in the WEC (from 22 in Sweden to 41 in Germany and in Finland). What this shows is that the fatality risk in the EEC is almost double the risk of the WEC and more than double in Russia compared to the EEC and almost five times more than the rate in the WEC.
In all of the analysed countries the demographic road fatality rate has dropped significantly over the period of analysis. While the WEC’s reduction in RFR was systematic each year, the EEC and Russia showed a more varied RFR reduction.
Figure 1: Comparison of trends in number of road fatalities (a) and road fatality rate (b) in BSR countries, 1990-2014. Fig. 2 shows the road safety assessment in the analysed countries made with a classification of
societal risk. The results suggest that relevant to the countries’ level of socio-economic development
(measured with GDPPC), all WEC and EEC countries fall within the acceptable risk class while Russia’s risk is classified as tolerated risk.
Figure 2: Road safety assessment and classification of BSR countries.
The WEC states have moved from class C to A (Sweden, Finland and Denmark) and the lower boundary of B (Germany). The countries of the EEC have moved from D or E to B (Lithuania, Latvia and Poland) and even the upper limit of A (Estonia). They have made a leap of 3-4 classes within 25 years. RUS has been mostly on level D. Despite a similar road safety level in the early 1990s, Russia has made much less progress than the EEC positioning itself in the upper limit of C, which is almost 2 classes below the EEC group. Because risk areas change as GDPPC increases, the countries under analysis and in particular Russia must develop and continue their road safety policies.
4.
ANALYSIS OF FACTORS AFFECTING ROAD SAFETY
4.1. Data and method
As already mentioned, road safety depends on a number of factors such as political, social, economic, infrastructural, mobility, etc. Because not all of them can be quantified, i.e. politics, the analysis was divided into two groups to look separately at the effects of political and system factors and social and economic factors on road safety.
To assess the effects of political and system changes on a country’s road safety, the DRFR indicator was used. It illustrates the pace of demographic road fatality rate decline and is calculated using Formula (4).
The DRFR (fatalities/1m inhab./year) (F/M/y for short) is calculated as the difference between RFRp
(in the first year of the analysis) and RFRk (in the last year of the analysis) divided by the length of the
period of analysis (in years).
Earlier research was used to preselect the most relevant socio-economic factors that affect road safety. The research involved a statistical analysis of some fifty countries designed to select factors with the strongest contribution to RFR changes (Jamroz, 2015). For the selected model of the relation between RFR and the set of factors, arc elasticity rates were calculated which suggest that RFR changes were caused mainly by:
up: GDPPC (in the range < 15.47 thou. ID/mk), DRP, VTKPC, ACPC and PMV, down: LEI, GDPPC (V > 15.47 thou. ID/mk), DP, DME, PUP, CPI and PAL.
Building on this, data was collected for nine BSR countries for the years 1990-2014. The data was sourced from generally available databases and covers measures of economic (GDP, GDPPC), spatial (Percentage of Arable Land PAL),social (Human Development Index HDI, Education Index EDI, Life Expectancy Index LEI, unemployment rate UR), cultural (use of seat belts USB, corruption index CPI, alcohol consumption index ACPC), transport infrastructure (density of motorways and express roads DME) and motorization development (motorization rate MR, miles travelled VTKPC). The data was then used to identify and assess the effects of selected socio-economic factors on the individual countries’ road safety levels.
4.2. Results of analysis and discussion
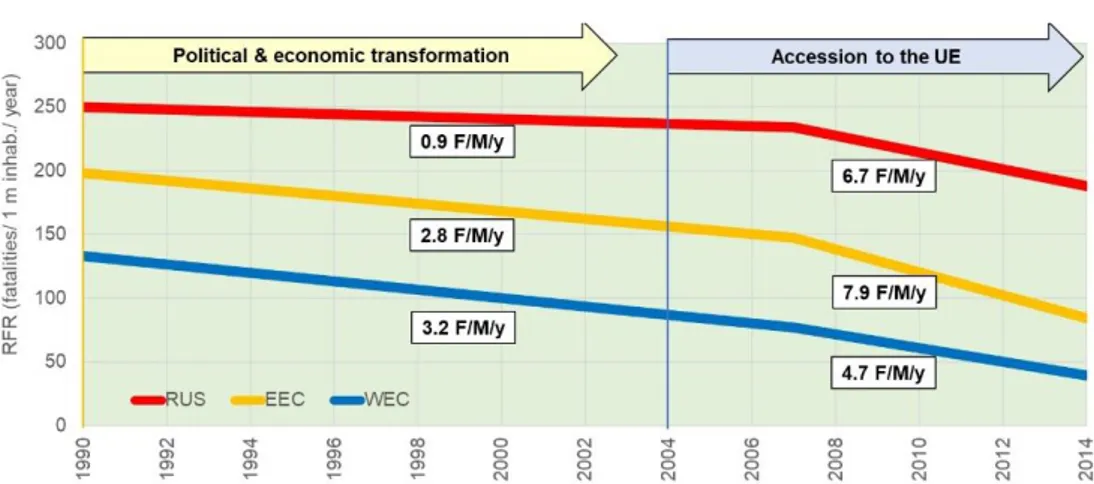
In the last 25 years BSR countries have undergone important political and system changes. Between 1989 and 1991 the EEC went through a change of political system (a change from communism to capitalism). There was change in Russia too (new structure, reduced area and population). In 2004 EEC countries joined the EU. The analysis looks at two characteristic periods: transformation of the political system (1990 – 2007) in the EEC and RUS and effective steps taken after the EEC joined the EU (2007 – 2014). Using formula (4) the pace of fatality decline DRFR was calculated for the groups of countries over the periods of analysis. Analysis of the results (Fig. 3) shows a marked difference in 1990 between road safety in highly developed WEC countries and the post-communist EEC and RUS. As the EEC went through the political transformation, the increase in fatalities reached a breaking point (e.g. in Poland in 1991) and the fatality decline pace was similar to that in the WEC (DRFR = 2.8 F/M/y). The EEC accession to the European Union almost doubled the pace of fatality decline (DRFR = 7.9 F/M/y) compared to the WEC.
Figure 3: Charts of the changing RFR and DRFR for the three analysed BSR country groups.
The analyses show that after the initial transition stage (of about 3 years), the pace of fatality decline almost tripled to reach almost twice the rate of the WEC. This has had an indirect effect on the significant pace of Russia’s fatality decline, being a neighbour of the EEC group. The EEC’s accession to the European Union has benefitted safety for many reasons, i.e. access to structural funds which are designed to support the social and economic development of the regions of EU countries (in particular the development of road infrastructure), having to bring the national requirements to the European Union’s rigorous road safety norms and standards (Directive 2008/196/EC), access to international research programmes and projects, research infrastructure and modern technologies, better quality of life following the adoption of EU standards for safety and environmental protection, positive procedures, schemes and solutions made available by the EU which help with progress in improving road safety (if properly used), having to deliver the EU’s transport strategies and road safety programmes, annual pressure on member states through the publication of rankings and analysis of the progress made towards the targets set out in national road safety programmes, carried out by the ERSO and other EU organisations. As we can see, political and system changes are vital to triggering positive changes for a country’s road safety.
To answer the article’s first question, an analysis was carried out of how the most significant
socio-economic factors affect road safety in the countries. To that end a historical data analysis was used.
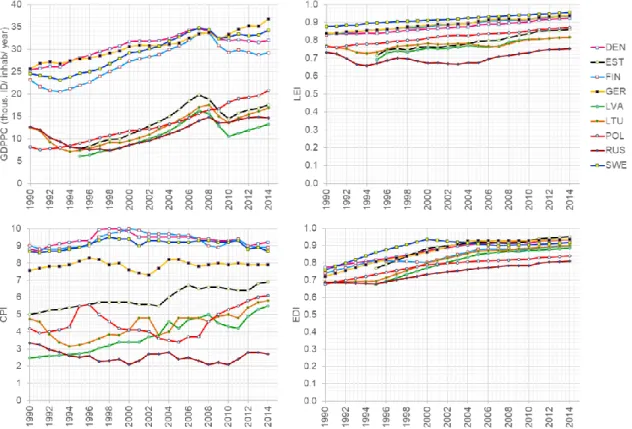
Its partial results are given in Fig. 4 as time series of how four selected indicators have changed, i.e. GDPPC, LEI,CPI and EDI which are the individual countries’ safety measures in the years 1990-2014. In the analysed period of 25 years some of the indicators grew systematically (GDPPC, LEI, CPI, EDI), some remained the same in some countries and changed in others (ACPC, CPI),
The classification of safety levels in the particular countries (point 3.2) and the factors of socio-economic development (Fig. 4) point to a clear divergence between the countries: WEC countries achieve the highest gross domestic product per capita in the region and have high levels of education (EDI), health care (LEI) and low levels of corruption (CPI); EEC countries are behind the developed WEC countries and a GDPPC 1.5 to 2.8 times lower; these countries feature a dynamic increase in economic development, education (EDI), life expectancy (LEI), and motorization (MR). Russia, which stands out from the rest of the BSR countries, reaches the lowest level of education, the lowest economic and social development, the highest level of corruption (CPI) and one of the highest levels of alcohol consumption per capita (ACPC).
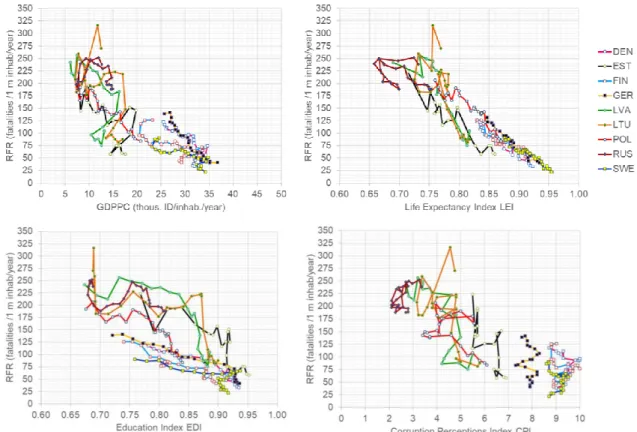
In addition, the effects of selected socio-economic factors were analysed (GDPPC, LEI, EDI, MR, CPI, ACPC, USB) for their effect on road safety measured with the RFR demographic road fatality
rate. The charts in Fig. 5 illustrate how the has been changing in relation to four selected factors (GDPPC, LEI, EDI, CPI).
Figure 4: Changes in the level of selected indicators of socio-economic development in BSR countries, 1990-2014.
GDPPC – all BSR countries in the analysed period saw a marked economic growth measured with gross domestic product per capita; economic growth (after the breaking point is reached) has a major influence on fatalities F and the road fatality rate RFR; the higher the GDPPC, the lower the RFR. The strongest reduction in RFR for EEC and RUS occurred after the breaking point was exceeded (GDPPC > 10 thou. ID/ inhabitant).
MR – while all BSR countries in the analysed period saw a clear increase in motorization measured with MR, the rates are quite different (MR is the highest in Finland and Germany, the lowest in Russia and Latvia); just as with GDPPC an increase in motorization (safer cars, modern safety systems) helps to reduce fatalities F and the road fatality rate RFR. The strongest reduction in RFR for EEC and RUS occurred after the breaking point was exceeded (MR > 200 veh./ inhabitant).
LEI, EDI – in all BSR countries in the analysed period health care is systematically improving, measured with LEI as is the system of education measured with EDI; the levels, however, are differentiated with a higher level in WEC and lower in EEC and RUS; the analyses have confirmed that as health care and education develop, the road fatality rate RFR decreases and road transport safety increases; this can be seen clearly when LEI > 0.7, and EDI > 0.75.
CPI – corruption level measured with CPI (the higher the index, the lower the corruption level) in BSR countries is strongly differentiated; in WEC countries the CPI remains at a stable and high level (CPI > 8.5), in the EEC the rate increases systematically (and reached CPI = 5.5-7.0); in Russia, however, it continues to be very low (CPI = 2.0–3.0). The analyses have confirmed that as corruption drops (CPI > 3.0) the road fatality rate RFR goes down as well and the safety of the road transport system improves.
USB – while in all BSR countries in the analysed period seat belt usage is growing measured with USB, in 1990 in WEC the rate was USB > 80% and in the other countries it was several times lower (USB = 20-50%); today, however, the differences are less striking (USB = 70-95%); the analyses suggest that seat belts, if used commonly, reduce RFR. This can be seen clearly when USB > 60%. ACPC – alcohol consumption measured with ACPC is fairly high yet differentiated. In the analysed period Russia’s and Lithuania’s ACPC was increasing and exceeded 14 l/inhabitant/year, while the other countries have a fairly stable rate at 9.0-12.0 l/inhabitant/year.
Figure 5: Road Fatality Rate in Baltic Sea Region countries compared to socio-economic indicators, 1990-2014 (source: own elaboration).
5.
CONCLUSION
It is clear that socio-economic development has an effect on countries’ road safety. In the initial period governments focus their attention and spending on economic development while actions designed to improve the quality of life, including road transport safety, take a less prominent role. Transport users make their contribution to their country’s economic growth by risking their lives and health when using road traffic. Once a certain level of economic development is exceeded (formerly more than 15 thou. ID/inhabitant, today more than 5 thou. ID/ inhabitant), the trends take a different turn and a relation is formed between economic growth and growing awareness and perception of road safety. Developing countries learn from developed countries and spend more on improving road safety, introduce new solutions and regulations which help to reduce road transport’s fatality rates.
The analysis of road safety and the analysis of the relations between road safety indicators and selected indicators of socio-economic development in BSR countries offer a number of conclusions. The diversity of the countries came to the fore. They can be divided into three characteristic groups, depending on the level of socio-economic development and the dynamics of change over the last 25
years. While the baseline of socio-economic development and road safety in 1990 was different for the different countries, their growth has been systematic and road safety has been improving. At present, road safety in WEC and EEC is at the level of acceptable risk (class A and B) and at tolerated risk level in Russia (class C). All the analysed countries experience a downward fatality rate trend and have exceeded the breaking point. Despite that, the analysis clearly shows the relation between socio-economic indicators and the level of road safety. Political transformations come to the fore in developing countries, especially those involving a change of political system.
The analyses have confirmed that the important socio-economic factors include: economic level measured with gross domestic product per capita GDPPC, system of health promotion measured with LEI, system of education EDI, level of motorization measured with MR, seat belt usage measured with USB and corruption level measured with CPI. The initial analyses have not produced clear evidence of the effects of alcohol consumption on the road fatality rate in the analysed countries.
The data and analyses will be used to develop predictive fatality models for the individual countries based on the key factors and to analyse the conditions for Vision Zero implementation in the groups of countries.
REFERENCES
Akaateba, M. A. (2012). Comparing road safety performance of selected EU and African countries using a Composite Road Safety Performance Index. J. Nat. Sci. Res., Vol. 2(8), pp. 31–46.
Arranz, J. M., & Gil, A. I. (2009). Traffic accidents, deaths and alcohol consumption. Appl. Econ., Vol. 41(20), pp. 2583–2595.
Bishai, D., Quresh, A., James, P., & Ghaffar, A. (2006). National road casualties and economic development. Health Econ., Vol. 15(1), pp. 65–81.
BITRE. (2014). Road safety: Modelling a global phenomenon. Report 141, Canberra, Australia. BITRE. (2016). International road safety comparisons 2014. Canberra, Australia.
Brüde, U., & Elvik, R. (2015). The turning point in the number of traffic fatalities: Two hypotheses about changes in underlying trends. Accid. Anal. Prev., Vol. 74, pp. 60–68.
Cohen, A., & Einav, L. (2003). The effect of mandatory seat belt laws on driving behaviour and traffic fatalities. Rev. Econ. Stat., Vol. 85(4), pp. 828–843.
D’elia, A., & Newstead, S. (2013). The relationship between socio-economic factors and road safety in Western Australia. Curtin-Monash Accident Research Centre.
Ghee, C., Astrop, A., Silcock, D., & Jacobs, G. (1997). Socio-economic aspects of road accidents in developing countries. TRL Report 247, England.
Hermans, E., Brijs, T., Wets, G., & Vanhoof, K. (2009). Benchmarking road safety: Lessons to learn from a data envelopment analysis. Accid. Anal. Prev., 41(1), 174–182.
Jamroz, K. (2010). Strategic risk measures in road traffic. J. Konbin, Vol. 13(1).
Jamroz, K. (2011). Metoda zarządzania ryzykiem w inżynierii drogowej. Gdansk University of Technology, Gdansk, Poland.
Jamroz, K. (2012). The impact of road network structure and mobility on the national traffic fatality rate. Procedia - Soc. Behav. Sci., Vol. 54, pp. 1370–1377.
Jamroz, K. (2013). Macro model of seat belt use by car occupants. Transp. Probl., 8(4), pp. 103–114. Jamroz, K. (2015). Country Safety Performance Function and the factors affecting it. Proc. Eur. Saf. Reliab. Conf. (ESREL), pp. 101–108.
Jamroz, K., & Smolarek, L. (2013). Road safety management tools for country strategic level. 16th Road Saf. Four Cont. Conf., China.
Johansson, R. (2009). Vision Zero – Implementing a policy for traffic safety. Saf. Sci., Vol. 47(6), 826–831.
Koornstra, M. J. (2007). Prediction of traffic fatalities and prospects for mobility becoming sustainable-safe. Sadhana - Acad. Proc. Eng. Sci., Vol. 32(4), pp. 365–395.
Kopits, E., & Cropper, M. (2005). Traffic fatalities and economic growth. Accid. Anal. Prev., Vol. 37(1), pp. 169–178.
La Torre, F., Domenichini, L., Corsi, F., & Fanfani, F. (2014). Transferability of the Highway Safety Manual freeway model to the Italian motorway network. Transp. Res. Rec., Vol. 2435, pp. 61–71. McMichael, A. J. (1997). Transport and Health: Assessing the Risks. London Sch. Hyg. Trop. Med. 5th Annu. Public Heal. Forum, pp. 9–26.
Oleinik, A. (2016). Corruption on the road: A case study of Russian traffic police. IATSS Res., Vol. 40(1), pp. 19–25.
Page, Y. (2001). A statistical model to compare road mortality in OECD countries. Accid. Anal. Prev., Vol. 33(3), pp. 371–385.
Pihlak, I., & Antov, D. (2004). A comparison of road safety in the Baltic Sea Region. Proc.17th ICTCT.
Rumar, K. (1988). Collective risk but individual safety. Ergonomics, Vol. 31(4), pp. 507–518.
Teik Hua, P., Noland, R. B., & Evans, A. W. (2010). The direct and indirect effects of corruption on motor vehicle crash deaths. Accid. Anal. Prev., Vol. 42(6), pp. 1934–1942.
UNDP. (1990). Human Development Report 1990. New York, Oxford. UNDP. (2012). Human Development Report 2012.
WHO. (2015). Global Status Report on Road Safety 2015.
Yannis, G., Papadimitriou, E., & Folla, K. (2014). Effect of GDP changes on road traffic fatalities. Saf. Sci., Vol. 63, pp. 42–49.
Zambon, F., Fedeli, U., Visentin, C. et al. (2007). Evidence-based policy on road safety: the effect of the demerit points system on seat belt use and health outcomes. J. Epidemiol. Community Health, Vol. 61, pp. 877–81.
Żukowska, J. (2012). Road safety analysis in Poland using time-series modelling techniques. J. Polish Saf. Reliab. Assoc., Vol. 3(1), pp. 109–112.