The influence of roll acceleration
motion dose on travel sickness:
Study on a tilting train
Reprint from the 33rd Meeting of the UK Group on Human
Response to Vibration, hosted by the Health & Safety Executive,
Buxton, Derbyshire, England, September 16 18, 1998.
Johan Förstberg, VTI
Evert Andersson, Royal Institute of Technology, Stockholm
Torbjörn Ledin, University Hospital, Linköping
O')
O':
O')
Fl <-91m
x 0 >-h H h :CU mSwedish National Road and
VTI särtryck 314 - 1999
The influence of roll acceleration
motion close on travel sickness:
Study on a tilting train
Reprint from the 33rd Meeting of the UK Group on Human
Response to Vibration, hosted by the Health & Safety Executive,
Buxton, Derbyshire, England, September 16 18, 1998.
Johan Förstberg, VTI
Evert Andersson, Royal Institute of Technology, Stockholm
Torbjörn Ledin, University HospitaI,Linköping
Swagiisii
and
The influence of roll acceleration motion dose on travel sickness:
Study on a tilting train
Johan Förstberg1 MSc LicEng, Evert Andersson2 Prof, Torbjörn Ledin3 MD PhD, Assoc Prof. Railway Systems1, Swedish Nat. Road and Transport Research Inst., SE-581 95 Linköping, Sweden.
Railway Technologyz, Royal Institute of Technology, SE-lOO 44 Stockholm, Sweden. Dept ENT3, University Hospital, SE-581 85 Linköping, Sweden.
E-mail: johan.forstberg©vti.se
Background: Low frequency translational accelerations can provoke motion sickness in land vehicles, trains, ships and aircraft. Tilting trains and banking aircraft introduce roll motions,
which may provoke motion sickness.
Hypothesis: Roll acceleration can contribute considerably to nauseogenicity when the
low-frequency lateral and vertical accelerations are small in amplitude. The ISO 2631-1 weighting
filter (wf) for calculation of motion dose for prediction of motion sickness from vertical acceleration may also be extended to use for roll accelerations.
Methods: Some seventy healthy volunteers (mean age 25 years, 45 % females) were employed. They were tested in a tilting high speed train with three different tilt control strategies during three days. Different degrees of tilt compensation was used, which means that subjects felt more or less lateral acceleration on the curves but also different, roll velocity and roll acceleration. The test ride lasted about three hours, two times 180 km long. Four
times per test ride the subjects answered a questionnaire concerning vegetative symptoms,
fatigue, sleepiness and nausea. Discomfort were measured in symptoms of motion sickness (SMS), which is defined as: dizziness, nausea or not feeling well. The train motion environment was monitored and recorded during the test rides. Motion doses for prediction of motion sickness, were calculated with vertical and also with lateral and roll accelerations over the different length of the test track. Over a part of the test track, about 5 min long, where speed and curvature were about the same, a frequency analysis was performed. Corresponding motion doses were calculated from these PSD-spectra.
Results: A 55% degree of tilt compensation of the lateral acceleration (in the track plane) instead of the normal 70%, reduced the incidence of SMS (SMS/) by about 30 - 50%. No decrement of subjective ride comfort or working ability were recorded with 55 % compensation. Females reported SMS rates three - four times higher than males. SMS! correlates fairly well with motion dose of roll acceleration (r2 = 0.43) but not significantly with vertical or lateral motion doses. Motion doses calculated from the PSD-spectra gives similar resuhs.
Conclusions: SMS! does not correlate to any greater extent with vertical and lateral motion
dose, but instead correlates better with a motion dose of roll acceleration in railway tilting environments. This implies that vehicle ride (land or air) should minimise roll acceleration in order to minimise provocation of motion sickness.
Key words: Ride comfort, motion sickness, high speed tilting trains.
Presented at the United Kingdom Group Meeting on Human Response to Vibration held in Buxton, Derbyshire, England, 16-18 September 1998.
1
Introduction
Occurrence of motion sickness in susceptible individuals is sometimes a problem with almost all transport modes: ships, car, buses, airplanes, etc. Normally trains have a very low provocation level but trains equipped with a tilting system have raised this level. The tilting system rolls the car body inward in a curve and thus reduces the lateral acceleration felt by the passenger. Therefore a tilting train may negotiate curves typically 25-30% faster than normally trains.
The possible sensory conflict (Reason, 1978) that may be involved in provoking this kind of motion sickness, may be that either the roll motion involved is at discord with the corresponding lateral acceleration or the visual input inside the car body is at discord with the motion clues.
Concerning vertical motions, a predictive method for vomiting incidence has been accepted (Griffin, 1990; ISO, 1997; Lawther & Griffin, 1987; McCauIey, Royal, & Wylie, 1976) for calculation of motion dose with a corresponding weighting filter wf with maximum band-pass (BP) in the frequency range of 0.1 - 0.3 Hz. (Golding, Finch, & Stott, 1997; Golding, Markey, & Stott, 1995) has showed that longitudinal and possibly also lateral accelerations has greater nauseogenicity than vertical accelerations and also that the corresponding weighting filter should be somewhat little bit broader than the normal wf filter. Roll acceleration has been show by experiment at TNO, The Netherlands (Wertheim, Wientjets, Bles, & Bos, 1995) to be able to provoke motion discomfort and also that a low level vertical acceleration added to the roll acceleration may enhance the nauseogenicity.
The motion pattern in a train is characterized by random motions, more or less periodic accelerations (hunting) and quasi-static accelerations caused by the horizontal alignment. Both the random and the periodic motions have frequencies above 1 Hz and may cause ride discomfort but, is of minor interest for provoking motion sickness. Instead the geometry of the track causes low frequency lateral and vertical accelerations, as well as roll and yaw motions. Of special importance are transitions curves where the radius changes and thus changes the quasi-static level of lateral acceleration.
Regarding railways, passenger ride comfort and discomfort on curves have attracted much research (Andersson & Nilstam, 1984; Harborough, 1986; Kufver, 1997; Sperling & Betzhold, 1956; Suzuki, 1996), but concerning motion sickness a good understanding of the problem is still needed (Förstberg & Ledin, 1996; Ohno, 1996; Ueno et al., 1986). The full 100 % compensation has been found to be provocative for motion sickness in the APT (Advanced Passenger Train) test in 1984 (Chappel, 1986) and a recommendation for a tilt compensation of 2/3 (67%) were given by (Harborough, 1986).
To investigate the incidence of motion sickness symptoms and the extent to which different compensation strategies influence the occurrence of such discomfort, full scale tests were conducted with the Swedish tilting train X2000 in November 1994 and June 1995. Altogether six different compensation conditions were tested and the results were reported in (Förstberg, 1996) and
(Förstberg, Andersson, & Ledin, 1998). This paper concludes the evaluation so far from the test in June 1995 with the three conditions A, G and F.
2 Test subjects and methods
Test subjects: Healthy volunteers were chosen, partly for their high subjective sensitivity to motion sickness. The experiment was conducted in June 1995 using fully 70 subjects and about half of them were females. Mean age was about 25 years. Mean self-rated sensitivity for motion sickness1 was 3.6 for females and 2.6 for males. They were mostly students from Linköping University aged of 20 to 30 years, but also included some employees of the Swedish National Road and Transport Research Institute and Linköping University Hospital.
The test subjects were instructed to try to read or work during the test ride. They were also instructed to ride either towards or backwards during all test runs, which meant that they had to change seat and direction before the return trip. They were able to see each other and in some cases able to talk to each other. About three quarters of the test subjects occupied window seats. No one became so nauseated so that it influenced other subjects.
Track characteristics: The test runs were conducted on track with large number of curves between Järna (about 47 km south-west of Stockholm) and Linköping (about 225 km south of Stockholm. The test track is about 180 km long, with permitted speeds of 180 - 200 km/h for about 85% of the track length. Curve radii varied mostly within the range of 1000 - 1250 m. A section between Linköping and
Norrköping has some curves with radii of 440 - 800 m, with speeds limited to 125 - 145 km/h. The test
track was divided into two segments at the station of Katrineholm, thereby allowing evaluation of the results in four sections (test parts). The stations of Norrköping and Katrineholm were passed at low speed.
Tilt system and test train: A tilt system is designed to lower the centrifugal forces (lateral acceleration) experienced by the passenger, by tilting the car body inwards on curves. The design is intended to enhance ride comfort and has, in principle, no effects on safety or track forces. On curves, a tilting train may travel at speeds typically 25 - 30% faster than a normal non-tilting train, if no other comfort or safety limits are violated (Andersson & Nilstam, 1984; Andersson, von Bahr, & Nilstam, 1995). The test train used in this experiment was an X2000 train, consisting of a power car and five passenger cars. The test subjects were seated in cars 1, 2 and 4. Measurement equipment was located in the bistro
car, see Figure 1.
1 Sensitivity to motion sickness, rated on a scale from 1 ( no sensitivity) to 7 (very high sensitivity).
Test train configuration
Towards Linköping
Towards Järna
:
_,
>
APower car I ICar No. 1 I | Car No. 2| par No. 3 I I Car No. 4 | [Car No. SB
lSt class
lSt class
Bistro
2nd class
Driving
trailer
Figure 1 Test train configuration. Test subjects were seated in cars 1,2 and 4.
Tested compensation strategies: Three different tilt compensation strategies were tested in June 1995, see Table 1. Earlier, four different conditions had been tested with a generally positive outcome for low tilt compensations (Förstberg, 1996). The independent parameters for the tilt system were, degree of tilt compensation, limitation of tilt speed and/or acceleration. These limitations were aimed not to interfere with the tilt motion necessary to tilt the car body in time but to reduce tilt motions caused by track irregularities.
Table 1 Variation of parameters used in the tilt system during the experiment (June 1995). Test Speed' Tilt Car body Car body tilt Typical max. lateral __
conditions
comp
tilt speed limit
acceleration limit acceleration in car body"
[%]
[%]
[o/s]
[0/52]
[m/sz]
A
+ 25
70
4
no limit
0.6
F"
+ 25
55
4
4
0.8
GF
+ 25
55
2.3
no limit
0.8
Remarks: * Conditions A D were tested in earlier experiments. Condition E was planned but never realised with limited car body tilt acceleration and 70 % compensation.
i Compared with normal non-tilting trains. ii Typical maximum values.
iii The tilt acceleration was not limited by the tilt steering system. Due to inertia of the car body and stiftness of the2 suspension and dampers, the maximum car body angular acceleration is estimated to be about 10 °/s .
The design during this experiment was that of a Latin square. This means that the test subjects were seated in the same car during the whole test and the different test conditions were rotated.
Evaluation: Before the test ride, the subjects answered a questionnaire concerning age, sex, rated subjective sensitivity to motion sickness, and well-being. Each test ride lasted about 3 hours. After each quarter of the test ride (about 45 min), the subjects answered another questionnaire concerning activity, ride comfort, comfort disturbances due to high levels of accelerations, jerks (rate of change of acceleration), jolts, ability to work/read and vegetative symptoms such as drowsiness, pallor, salivation, fatigue, sleepiness, dizziness and nausea. They also scored their well-being2 on a five-degree scale, both at the beginning of the journey and after each test part. The physical parameters of the train ride
2 The scale used was: I feel alright, I do not feel quite well, I feel rather unwell, I feel bad, I feel very bad.
were recorded for analysis of possible relations between accelerations (linear and angular) in the train, and symptoms of motion sickness.
In the evaluation of motions of the train, the concept of motion dose3 from (Griffin, 1990; Lawther & Griffin, 1987) has been used. Also their rating of well-being, Illness Fiating4 (IR), has been adopted in this experiment. The weighting function (wf) (ISO, 1997) for calculating motion dose has been slightly modified and replaced with a BP filter 0.08 0.35 Hz, see Figure 2. The difference is very small and lies within the tolerance error marginal. This filter has been used for all calculations on motion dose from vertical, lateral and roll accelerations from time signals.
Comparison between Wf weighting filter and a BP filter 0.08 - 0.35 Hz
1 Weightingfilter Wf ==- -- -- BP 0.08 - 0.35 Hz 0,1 C .9 Ei 5.3i E ( 0,01 0,001 0,01 0,1 1 10 Frequency [Hz]
Figure 2
Comparison between ISO 2631 weighting filter Wf and used BP filter 0. 08 - 0. 35 Hz.
Incidence of motion sickness symptoms (SMSI): The definition of motion sickness symptoms (SMS) is that the subjects reported one of the following symptoms: dizziness, nausea or something other than I feel alright at the end of each test part, provided that the subject did feel alright at the beginning of each test run. SMSI is then calculated as the sum of reported SMS from all subjects and over all test parts, divided by the total sum of subjects and test parts.
3 Motion Sickness Dose Value. MSDVZ:
0.5
MSDVZ= [ ai]. (Och] [m/s1 5], where aWAt) is frequency-weighted acceleration by the w. Time for integrating of the integral is between 20min and 6 hours.
Percentage of persons who may vomit = Km - MSDVZ [%] and Km = 1/3 for a mixed population of unadapted male and female adults (ISO 1997, Griffin 1990).
4 I/lness Rating: 0 = I felt all right, 1 = I felt slight/y unwell, 2 = / felt quite ill, 3 = ! felt absolute/y dreadful.
IR = 1/50 * MSDVZ. (Lawther and Griffin 1987, Griffin 1990).
Frequency analysis: Power spectral density (PSD) analysis has been estimated on approximate 5 min time history taken from a part of the test track between Katrineholm and Norrköping where the allowed
speed is 180 km/h and densely curved with minimum curve radius is about 1000 rn. The time signal
has been low pass filtered at 5 Hz and then resampled from 200 Hz to 25 Hz. The frequency analysis
used a Hanning window and a 1024 point transform, resulting in a frequency spacing of 12.5/512 =
0,0244 Hz.
PSD-spectra from the test run no 11 (return trip, first day) have been omitted because the train was braking and therefore generating other motions.
3 Results
3.1 Symptoms of motion sickness
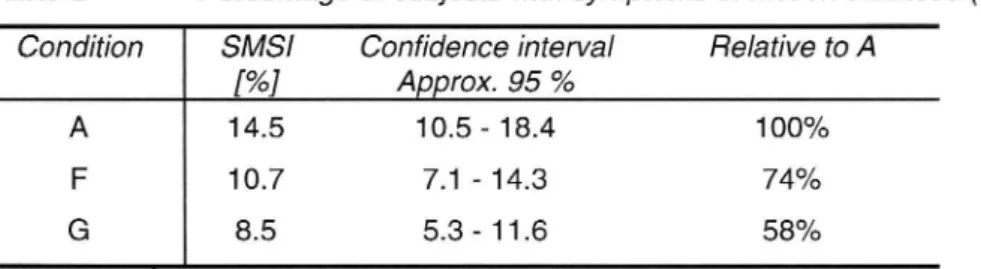
In the experiment, the two tested conditions with 55% compensation (F and G) showed a lower incidence of symptoms of motion sickness (SMS/) than condition A, but only the condition G was significantly lower at the 5% level. The reduction of SMSI was 25 - 40% compared with condition A. See Table 2.
Table 2 Percentage of subjects with symptoms of motion sickness (SMSI).
Condition
SMSI
Confidence interval
Relative to A
[%] Approx. 95 %
14.5
10.5 - 18.4
100%
F
10.7
7.1 - 14.3
74%
8.5
5.3 - 11.6
58%
Remark: A X2 - analysis shows that the differences between the number of test subjects experiencing SMS in conditions A, F and G is significant on the 10 % level (78 = 4.94, df = 2, p 5 0.08) but the difference between A and G is significant
on the 5 % level ( 2 = 4.73, df = 1, p 5 0.029).
3.2 Differences in gender and riding forwards or backwards
Females were found to score about two to three times as high as the males on the items of nausea, I
don't feel well and SMS/. Females also show a large variation in SMS/ with the direction of travel. They
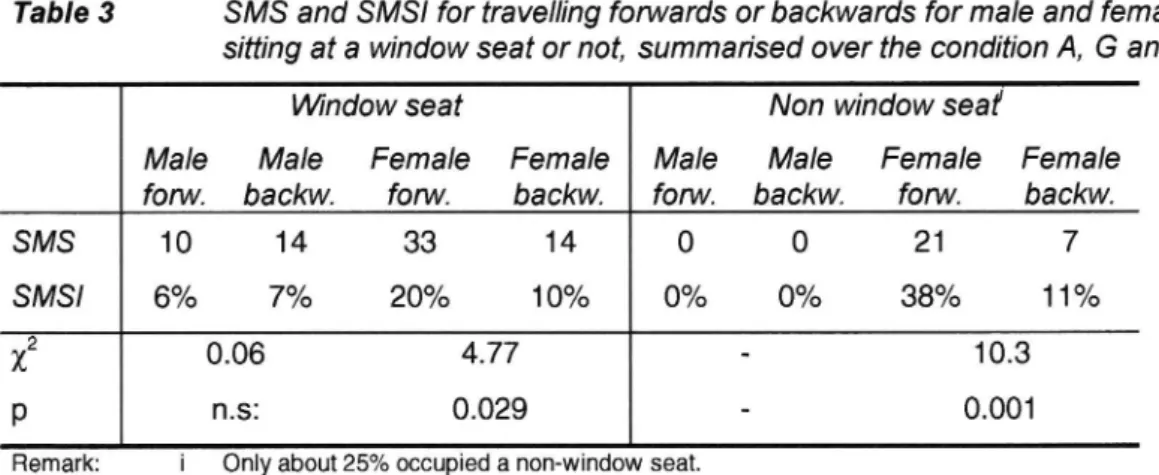
scored significantly less SMSI when riding backwards, see Table 3. For men, there was very little difference. Being seated at a window or not may affect women but not men regarding SMS/. This indicates that the vision field (able to look fixedly at the horizon) has a large influence on motion sickness (especially for females).
Table 3 SMS and SMS/ for travelling fon/vards or backwards for male and female subjects sitting at a window seat or not, summarised over the condition A, G and F.
Vl ndow seat
Non window seat
Male
Male
Female
Female
Male
Male
Female
Female
forw.
backw.
forw.
backw.
forw.
backw.
fon/v.
backw.
SMS
10
14
33
14
0
0
21
7
SMSI
6%
7%
20%
1 0%
0%
0%
38%
1 1 %
x2
0.06
4.77
-
10.3
p
n.s:
0.029
-
0.001
Remark: i Only about 25% occupied a non-window seat.
forw. = forwards, backw. = backwards, n.s. = not significant
3.3
Regression and frequency analysis
To analyse the influence of vertical, lateral and roll accelerations on symptoms of motion sickness, a
regression analysis was performed. This analysis shows that the lateral and vertical accelerations do
not significantly contribute to the explanation of SMSI. If these two factors are included, they will
appear with a negative sign, which is physically impossible. A linear regression model suggests an
influence of roll acceleration motion dose on SMSI for the total population with a statistical
significance of F(1,34) : 25.24, p < 0.001 and the coefficient of determination r2 = 0.43, see Figure 3.
A 95 % confidence interval for regression coefficients (total population) is 0.22 < roll < 0.49 and -0.15
< const. < 0.0.
In uence from roll acceleration motion dose on SMSI
50% Evaluated ]per test part
. SMSI (Female)
45% - x SMSI (Total) ' '
ö A SMSI (Male)
& 40% "_ Linear (male) =
8 Linear (female) . . Female
% 35% "_ Linear (total)
V = 058" ' 0,12
% R2 = 0,31 : / ; 30% = . / g 25% 2 . / x x x Total population.g 20%
'
/
=
. y= 0,35x- 0,07
cE>
' 0
x
%
x x /
R2 = 0,44
....8 15% / . / /X E x n | 0X ac % 100/ _ )» . a Male& o AK |'/8'?g£ xxAiAä A A/y=0v15X'O-03
a') l x M 2 =
° " x__________1M x
p% =£åH A A. = få. .se. .1: AA
0,20 0,30 0,40 0,50 0,60 0,70 0,80
Motion dose roll acceleration [rad/S15]
Figure 3 Regression curves from roll acceleration motion dose on SMSI for female, male and total population.
The regression analysis for female and male subjects show that females have a greater sensitivity
than the total population, and males less sensitivity, but for males r2 is rather weak.
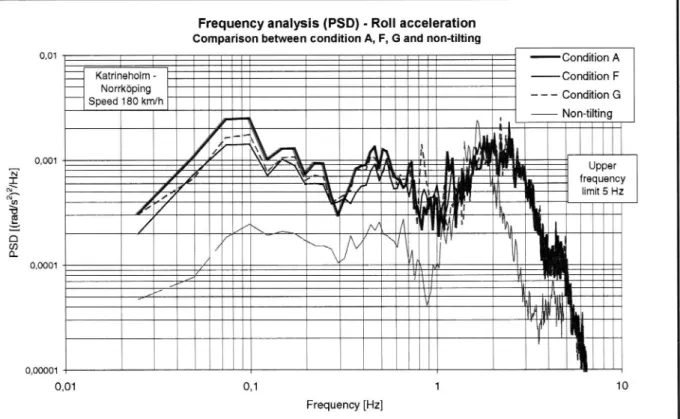
Frequency analysis for roll acceleration show that the conditions A has about double the intensity in
the interesting range from 0.08 - 0.2 Hz and about 50% higher between 0.2 - 0.5 Hz, see figure 4.
The figure 5 shows a corresponding analysis from lateral acceleration. Here the condition A has
about the half the intensity up to 0.1 Hz, reflecting the lower quasi-static accelerations on circular
curves than the other two conditions. For vertical accelerations where are almost no difference
between the three conditions (not shown here).
Frequency analysis (PSD) - Roll acceleration
Comparison between condition A, F, G and non-tilting
0,01 Condition A Katrineholm - Condition F Norrköping _ _ _ _ _ Speed 180 km/h Condition G Non-tilting 0,001 .... Upper N ; frequency =, Iimit 5 Hz U) E
e
E
(I) 0. 0,0001 0,000010,01
0 1
1
10
Frequency [Hz]Frequency analysis (PSD) - Lateral acceleration
Comparison between condition A, F and G 10 Condition A --- Condition G Condition F
"£
g 0,1
5
(I) O. 0,01 0,001 0,01 0,1 1 10 Frequency [Hz]Figure 5 PSD-spectra for lateral acceleration for the different conditions A, G and F
The interesting point is to calculate r.m.s.-values using the weighting function w and the
PSD-spectra. Table 4 shows these r.m.s.-values and there relative order compare to condition A.
R. m. s. -values for vertical, lateral and roll acceleration calculated from PSD spectra
Table 4
, using the weighting lter wf.
R. m. 8. - values calculated from Relative to PSD-spectra condition A Cond. A Cond. F Cond. G Cond. F Cond. G
Vert acc. [m/sz]
0,079
0,077
0,077
98%
98%
Lat acc. [m/sz] 0,145 0,191 0,198 132% 137%
Roll acc. [rad/82]
0,0180
0,0163
0,0151
91%
84%
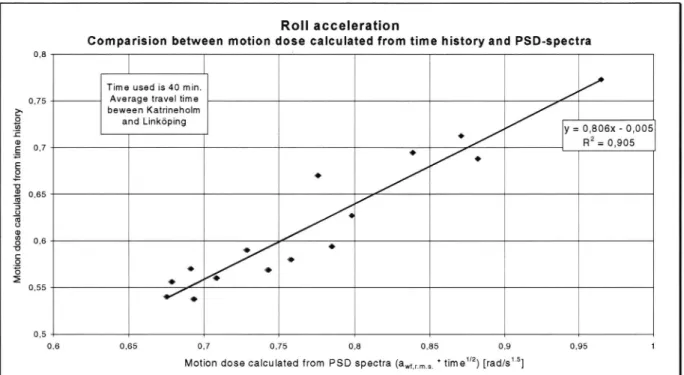
Since motion dose also can be calculated from the r.m.s. - values as motion dose = r(awf,,ms) * t 2 , it
is easy to compare these two methods, see Figure 6. The regression coefficient is not 1 but just
about 0.8 which indicates an overestimation from the 5 min part to the whole test section of 40 min.
In these 40 min where is a station passing at low speed and some straight sections what will not
contribute to the motion dose. The r2 - value is high (0.90) and relation is significant (F(1,13) : 127, p
Roll acceleration
Comparision between motion dose calculated from time history and PSD-spectra
0,8 '
Time used is 40 min. /
0,75 Average travel time /
a. beween Katrineholm / 2 and Linköping _ %> 0/ y- 0,2806x-0,005 E 0.7 . H = 0,905
g
9 0/ '
rå) / E 0,65 85
/
3 "8 0,6 . . 8 0 "g 0 2 0,55 0 / ' /. 0,5 0,6 0,65 0,7 0,75 0,8 0,85 0,9 0,95Motion dose calculated from PSD spectra (awmms. * time1 2) [rad/31 s]
Figure 6 Comparison between motion doses calculated from time history (40 min) and PSD
Next step is then to make a regression analysis between these calculated r.m.s. - values and the
observed motion discomfort (SMSI), see Figure 7 and compare it with earlier regression (Figure 3).
spectra estimated from about 5 min duration on a curved track.
The outcome is that they are similar and have about the same r2- values.
In uence from roll acceleration on motion related discomfort (SMSI)
r.m.s. - values, wf weighted. Test 10, 12-15
50%
l
I
I Discomfort Total o .
45%
. Discomfort (Male)_
(
p p)
A
A
&. 40% __ A Discomfort (Female) 5 Female
5 ? - -Linear (Male) y = 34,43x - 0,31
% 35% Linear (Total pop.) / H2 = 0,23
"' Linear Female
& 30%
(
.)
/
c / A % ' A / A Total population "?> 25% , y = 27,51x - 0,298
/
.
/'
Fl2 0 50
._= _ _ ,% 20%
/ a
a
1/
e l
'
5
//
.
/ &
l
' o Male% 15/0
&
_
/ y=20,65x-O,27
% 107
/
/
Hz = 0,40
> ° / E = /4 a) l o 0 / 4»S%
.
//
/ / 00/0 = = 3 0,012 0,013 0,014 0,015 0,016 0,017 0,018 0,019 0,02 0,021Roll acceleration (awfms) w, weighted [rad/$2]
Figure 7 Regression analysis between r.m.s.-values of roll acceleration weighted by wf and
symptoms of motion sickness (SMSI).
10
Trials have been done with improve the fit between weighted r.m.s.-values and SMSI, by testing
other weighting filters, for example band pass filters from 0.04-O.5 and 0.04-1.0 Hz but they do not
improve r2 - values.
Another point is to prove if roll acceleration or roll velocity is the main cause of motion discomfort in
this case. But unfortunately roll velocity and roll acceleration are concurrent factors and for the most
of the tested conditions they are highly correlated. But for the conditions F with a limitation of tilt
acceleration, a difference exist and therefore a possibility of testing if there are any difference, see
Figure 8.
Influence from roll acceleration and roll speed on motion discomfort (SMSI)
30% l I l ]
I Roll acc. Roll acceleration
y = 24,27x - 0,23 25% A Roll Speed R2 = 0,70 l A
20%
/
/
15% / Roll speed' /Q/
74/-cm;
10% r.7/4
Sy mp to ms of mo ti on si ck ne ss i. (S MS I) [% ] S%0% 0,01 0,011 0,012 0,013 0,014 0,015 0,016 0,017 0,018 0,019 0,02
r.m.s.-values of w, weighted roll acceleration and roll speed [rad/s], [rad/$2]
Figure 8 Comparison between the influence from roll acceleration and roll velocity on symptoms of motion sickness (SMSI).
lt looks like that roll acceleration has a greater influence of motion discomfort than the roll velocity but
the number of points is to few to make a strong conclusion.
4 Discussion
The mechanisms of motion sickness are not well known. The most popular hypothesis is the sensory
conflict theory (Benson, 1988; Oman, 1988; Reason, 1978; Reason & Brand, 1975), while others
have advocated that the motion sickness response is a protective function for the integrity of the
body (Treisman, 1977). It seems clear that the vestibular organs are a neceSsary part of the reaction
(Money, 1991).
& Griffin (1987) suggested the concept of a cumulative motion dose for the evaluation and prediction of
motion sickness at sea.
Horizontal accelerations (longitudinal and lateral) have recently been shown to be about twice as provocative as vertical accelerations5 (Golding et al., 1997; Golding et al., 1995). About roll acceleration (McCauIey et al., 1976) found no evidence that roll or pitch motion combined with a vertical acceleration altered the nauseogenicity of vertical accelerations. They used fairly high levels of vertical accelerations resulting in a motion sickness incidence (MSI, vomiting incidence (VI) in a 2 h test) of 30 - 50%. At TNO (Wertheim et al., 1995) have conducted several experiments to prove that roll and pitch alone can be nauseogenic and showed that a small amplitude of vertical acceleration amplifies nauseogenicity of the roll/pitch motion.
In this study, the vertical and lateral accelerations are concurrent factors with roll acceleration instead of independent factors. The regression analysis show that roll acceleration is the main cause of this discomfort. Also roll velocity and roll acceleration are highly correlated. From the performed tests and evaluations, it is difficult to separate their combined influence but it seems that roll acceleration motion
dose has the greatest influence on SMSI.
Motion-dose values calculated from PSD-spectra on a representative part of the test section will give result in accordance with motion doses but PSD-spectra will offer a way of better understanding the difference between the tested conditions.
Conditions F and G both employed a 55 % degree of compensation, with the difference that condition F had a limitation on tilt acceleration and G had a limitation on tilt speed. Despite the fact that roll acceleration motion dose correlates well with SMSI, the condition G indicates a lower SMSI than condition F, although not statistical significant. A limitation of the tilt acceleration means that the tilt acceleration has to have a longer duration in order to achieve the necessary tilt speed. lf the tilt motion cannot start before the transition curves is detected this means also that the tilt speed has to be increased in order to complete the tilt motion in time. The roll acceleration motion dose can in this case be increased, in spite of a limitation of tilt acceleration because of the needed higher tilt speed.
Conclusion
This study has evaluated SMSI experienced by healthy subjects in a high-speed train utilising active tilting of the car body to reduce lateral acceleration during curving. The subjects have found the average ride comfort in all test conditions to be good. By using a lower degree of compensation (55%) instead of the normal (70%), a reduction of up to 25 - 40 % in the number of test persons reporting SMSI was found. Inadequate compensation levels may create ride discomfort due to by high lateral
5 Golding suggests that longitudinal acceleration is twice as provocative as vertical acceleration for a person sitting upright. The Km in the motion dose formula is then changed to 1.41*Km. Lateral acceleration is about as provocative as longitudinal acceleration.
acceleration levels and a high rate of change of lateral acceleration. The female subjects reported two to three times as many symptoms as the males. SMS/ values, evaluated over a suitable length of time or track, seems to be approximately proportional to motion dose of roll acceleration.
The absolute levels of SMSI found are probably not directly transferable to a normal population of train passengers, because of the selection of subjects (sensitivity, age etc.). However it is likely that lower compensation and limited tilt speed also are favourable in a more normal population of passengers. Future research
Future research should analyse the influence of lateral and vertical accelerations, in addition to roll speed and roII acceleration, on motion sickness. All ride comfort aspects as well as discomfort caused by motion sickness, must be regarded. This should make it possible to minimise complaints of discomfort and thereby enhance ride comfort and ability to work on future high-speed tilting trains.
5 Definitions
Tilt angle, tilt speed, tilt acceleration is the corresponding angle / speed / acceleration with which the tilt system rotates the car body with respect to the track plane.
Roll angle, roll speed and roll acceleration is the corresponding angle / speed / acceleration with which the car body rotates with respect to the horizontal plane.
6 Acknowledgements
This project is financed by the Swedish State Railways (SJ), Adtranz Sweden, the Swedish Transport and Communications Research Board (KFB) and the Swedish National Road and Transport Research Institute (VTI). The test runs were financed by SJ and supported by Adtranz Sweden.
7 References
Andersson, E., & Nilstam, N. (1984). The development of advanced high speed vehicles in Sweden. Proceedings of the Institution of Mechanical Engineers, Part D, 198(15), 229-237.
Andersson, E., von Bahr, H., & Nilstam, N. G. (1995). Allowing higher speed on existing tracks -Design considerations of train X2000 for Swedish state Railways (SJ). Proceedings of the Institution of Mechanical Engineers. Part F: Journal of Rail and Rapid Transit, 209(2), 93 104. Benson, A. J. (1988, ). Motion sickness. Aviation Medicine, 318-338.
Chappel, T. (1986). Passenger comfort test (APT) of April 1984: Planning and conduct (BRR TR DOS 036). Derby: British Rail Research.
Förstberg, J. (1996). Motion-related comfort levels in trains: A study on human response to different tilt control strategies for a high speed train. (Licentiate Thesis TRITA-FKT report 1996:41 (Also publised as VTI Särtryck 274 -1997, Linköping:VT|)). Stockholm: KTH.
Förstberg, J., Andersson, E., & Ledin, T. (1998). Influence of different conditions for tilt compensation on symptoms of motion sickness in tilting trains. Brain Research Bulletin, (accepted).
Förstberg, J., & Ledin, T. (1996). Discomfort caused by low-frequency motions: A literature survey of hypotheses and possible causes of motion sickness (VTI Meddelande 802A . (Also published as TRITA-FKT report 1996:39, Stockholm: KTH)). Linköping: VTI.
Golding, J. F., Finch, M. I., & Stott, J. R. R. (1997). Frequency effect of 0,35 - 1.0 Hz horizontal translational oscillation on motion sickness and the somatogravic illusion. Aviation, Space and Environmental Medicine, 68(5), 396-402.
Golding, J. F., Markey, H. M., & Stott, J. R. R. (1995). The effects of motion direction, body axis, and posture on motion sickness induced by low frequency linear oscillation. Aviation, space, and environmental medicine., 66(1 1), 1046-1051 .
Griffin, M. J. (1990). Handbook of Human Vibration. (Vol. human). London: Academic Press.
Harborough, P. R. (1986). Passenger comfort during high speed curving. Summary report (BRR TR
DOS 018). Derby: British Rail Research.
ISO. (1997). Mechanical vibration and shock - Evaluation of human exposure to Whole body vibrations - Part 1: General requirements (ISO 2631-1.2:1997 (E)). Geneve: ISO.
Kufver, B. (1997). Variables and criteria for evaluation of vehicles reactions caused by railway alignment. (KTH-FKT Report 1997:29 (Also published as VTI notat 43-1997, Linköping (Sweden): VTI) ). Stockholm: KTH.
Lawther, A., & Griffin, M. J. (1987). Prediction of the incidence of motion sickness from the magnitude, frequency, and duration of vertical oscillation. Journal of Acoustical Society of America, 82,
957-966.
McCauley, M. E., Royal, J. W., & Wylie, C. D. (1976). Motion sickness incidence: Exploratory studies of habituation, pitch and roll, and the refinement of a mathematical model (Technical Report, No 1733-2, AD-A024 709). Goleta (California): Human Factors Research lnc.
Money, K. E. (1991). Signs and symptoms of motion sickness and its basic nature., Motion sickness: Significance in aerospace operations and prophy/axis. (Vol. AGARD Lecture series 175, ). Neuilly sur Seine: AGARD.
Ohno, H. (1996). What aspect is neededfor a better understanding of tilt sickness? Quarterly report of
RTR/. 37:1, 9-13.
Oman, C. M. (1988). Motion sickness: a synthesis and evaluation of sensory conflict theory. Canadian Journal of Physiology and Pharmacology, 68, 294-303.
Reason, J. T. (1978). Motion sickness adaption: a neural mismatch model. Journal of the Royal Society of Medicine, 71, 819-829.
Reason, J. T., & Brand, J. J. (1975). Motion sickness. London: Academic Press Inc (London) Ltd. Sperling, E., & Betzhold, C. (1956). Beitrag zur Beurteilung des Fahrkomforts in Scheinenfahrzeugen.
Glasers Anna/en, 80, 314-320.
Suzuki, H. (1996). Recent research and developments in the field of riding comfort evaluation. Quarter/y report of RTR/, 37, 4 8.
Treisman, M. (1977). Motion sickness: An evolutionary hypothesis. Science, 197, 493-495.
Ueno, M., Ogawa, T., Nakagiri, S., Arisawa, T., Mino, Y., Oyama, K., Kodera, R., Taniguchi, T., Kanazawa, S., Ohta, T., & Aoyama, H. (1986). Studies on motion sickness caused by high curve speed railway vehicles. Japanese Journal of Industrial Health, 28, 266-274.
Wertheim, A. H., Wientjets, C. J. E., Bles, W., & Bos, J. E. (1995). Motion sickness studies in the TNO-TM Ship Motion Simulator (SMS) (TNO report TNO-TM 1995 A-57). Soesterberg, Netherlands: TNO Human Factors Research Institute.