Regression analysis of wildfire suppression
R. Hansen
Swedish Civil Contingencies Agency (MSB), Sweden
Abstract
One of the most important aims of forest fire research is how to better control forest fires. One way to attain this aim is to develop better decision tools for estimating how much water is required for extinguishing a fire with a specific set of conditions. There has in the past generally been little research conducted with respect to water requirements when suppressing a wildfire. A number of experiments were conducted in the early ‘70s where a spray rig with a nozzle arrangement was used in order to apply water uniformly across a fuel bed. Two studies regarding the required duration of water application related to fires in buildings were conducted in the past. Both studies were based upon statistical data from fire brigades; the duration of water application was determined as a function of the fire area. This paper encompasses an analysis of more than 64,000 wildfires occurring in Sweden between 1996 and 2009. The values calculated from the obtained formulations with regression analysis were found to be in good agreement in the following cases: The amount of water as a function of the extinguishing time, the extinguishing time as a function of the fire area; and the fire area as a function of the flame height. It was observed that the derived equations from the analysis in the above cases could provide an accurate computation. These relationships could be of considerable use when developing decision tools for wildfire suppression, optimizing the use of resources during the suppression activities.
Keywords: wildfire suppression, regression analysis, extinguishing time, water amount, fire area
1
Introduction
The development of decision tools is an essential activity in the fire and rescue sector, for example for wildfire suppression. One of the desired and needed tools would be the estimation of how much water is required for extinguishing a
wildfire. Little research has been conducted with respect to water requirements for wildfire suppression. Stechishen [1] and Stechishen and Little [2] used a spray rig to water uniformly across a fuel bed, developing equations relating the penetration depth of the water into the fuel bed required to extinguish the fire to fire intensity. Loane and Gould [5] used experimental data from aerial drops on fires in various fuels, small-scale laboratory experiments and field studies to develop equations to calculate the depth of water required for fire suppression as a function of fire intensity. Douglas [6] estimated a minimum water flow requirement per metre of fireline as 10-20 litres/minute for surface fires in south eastern Australian pine forests. Andrews and Rothermel [7] and Alexander [8] used flame length and fireline intensity to determine the appropriate fire suppression activities. Alexander stated that suppression using pressurized water would be an appropriate action for fireline intensities up to 2000 kW/m. Calculating the total amount of water required for extinguishing a wildfire, the duration of water application has to be accounted for and multiplied by the water application rate. Thomas [3] and Baldwin [4] presented studies regarding the required duration of water application related to fires in buildings. The studies were based upon statistical data from fire departments and fire brigades, the study by Thomas was based on 48 fires and the study by Baldwin was based on 134 fires. In both studies the duration of water application – in order to bring the fire under control - was determined as a function of the fire area. Thomas [3] presented the equation:
5 . 0
197
fire controlA
t
=
⋅
(1)where tcontrol is the duration of water application for controlling the fire (s) and
Afire is the fire area (m2). Note that eqn. (1) is valid for fire areas over 200 m2.
Baldwin [4] presented the following equation:
559 . 0
100
fire controlA
t
=
⋅
(2)Note that eqn. (2) is valid for fire areas over 20 m2. Factors such as the level of experience of the firefighter, applied nozzle technique etc., will have a major impact on the amount of water used on a wildfire as suggested by Baldwin [4]. Accounting for operational aspects in detail would be a very complex issue and difficult to quantify and determine in a satisfactorily manner. Thus a statistical approach is suggested in order to account for the operational aspects. The following analysis is aimed at establishing similar relationships for wildfires with respect to the application of water, the duration of water application and influencing parameters such as the flame height, fire area etc.
2
Statistical material
All the 290 municipalities in Sweden are required by law to document all incidents that require the intervention of the municipal fire and rescue service –
all wildfires in Sweden are fought by the municipal fire and rescue service. Before 1996 every municipality had their own type of report when documenting these incidents and in order to get a better picture of the overall situation in the nation, to improve the quality of the reports etc. it was decided that a pre-defined form should be introduced and used nationwide. The form was introduced and started to be used in 1996. Today the form consists of a total of ten pages, starting with a general part (time of alarm, time of arrival to the scene etc.) and then continuing with additional parts that are filled out depending on what type of incident that has occurred. The data is filled out digitally by the incident commander and sent to the responsible agency – the Swedish Civil Contingencies Agency. The Swedish Civil Contingencies Agency has built a database containing approximately 1.7 million entries. During the study the following parameters were extracted from the database for the years 1996-2009:
- Time of arrival at the scene of the fire. - Time when water was first applied on the fire.
- Date and time when the fire was extinguished/under control. This time actually marks the end of active fire suppression activities of the municipal fire service. It will vary from fire to fire, in some cases the activities will end before the mop up of the fire has been concluded – the responsibility of the mop up operations is handed over to the landowner – and in other cases the activities will end when the fire is completely extinguished and the mop up operations are concluded. - Maximum flame height (this parameter was introduced in 2005 and is
thus lacking for the period 1996-2004).
- Amount of water used during the extinguishing operations. - Total fire area.
A total of 64,913 wildfires that occurred during the period 1996-2009 were investigated. One should bear in mind that parameters such as flame height and fire area are only estimated and not measured exactly, thus there may be some uncertainties with respect to exactness of the data.
3
Method
During the analysis a number of potential relationships were investigated where the following work was conducted:
- A t-test was conducted in order to test what independent variables that affected the dependent variable.
- A least squares fit was conducted in order to produce a potential association between the variables that were pointed out during the t-test. - A correlation analysis was conducted in order to investigate the strength
of association between the two quantitative variables.
- A regression analysis was conducted in order to use the relationship from the correlation analysis to predict the value of one of the variables given a value of the other variable. Analyzing residual plots to
- An F-test was conducted in order to analyze whether the R2
-value was random or not.
Before starting the analysis all wildfires with incomplete data were excluded in the ensuing analysis. Due to the very large number of wildfires and sets of data, it was decided to simplify the process by using a single output value for each individual input parameter value (for example a single fire area for all fires that required 100 m³ of water during the extinguishment, a single fire area for all fires that required 150 m³ etc.). When studying the values for the wildfires it was found that a few outlier values affected the mean values greatly, thus it was decided to exclude the 20 lowest values and highest values for each independent value in order to reduce the influence of the outlier values and provide robust results. The mean value of each independent value was thereafter calculated. Fires that lasted for more than 24 hours were excluded in the analysis that dealt with the extinguishing times or application rates, as active extinguishing operations during Swedish wildfires will generally not be conducted during nighttime and thus no water would be applied during nighttime. Regarding the amount of water used during extinguishing operations all values that were smaller than 100 were excluded in the ensuing analysis as it was unclear whether the incident commander filling out the form had in these cases listed the value in litre or cubic meter. Also, all water amounts that ended with the number 1 were excluded from the analysis as it was suspected that the number one could in many cases actually be the letter “l” as in litre.
The following variables were investigated in the analysis: - The amount of water used.
- The extinguishing time. - The water application rate. - The total fire area. - The flame height.
The extinguishing time was set equal to the time interval from when water was first applied on the fire and until the fire is extinguished/under control.
The software that was used during the analysis was the Microsoft Excel add-in: Analysis ToolPak, containing data analysis tools for statistical and technical analysis.
4
Results
4.1 The amount of water as a function of the extinguishing time
An initial t-test indicated that the relationship between the independent variable: the extinguishing time and the dependent variable: the amount of water is likely not due to random chance.
A total of 6,689 wildfires were included in the analysis. The variables were
investigated within the following intervals:
- The extinguishing time: 60 s ≤
t
≤ 8700 sA least squares fit resulted in the following potential equation:
317
.
0
001
.
0
10
2
10
4
10
2
⋅
15⋅
4−
⋅
11⋅
3+
⋅
7⋅
2+
⋅
+
=
−t
−t
−t
t
V
water (3) The correlation coefficient -r
- was calculated to: 0.967The Pearson correlation coefficient (p-value) was calculated to: 4.67·10-6 (
α
=
0.05), thus the correlation is statistically significant.The regression coefficient -
β
- was calculated to: 0.820The coefficient of determination -
R
2 - of eqn. (3) was found to be: 0.958 F-test: the null hypothesis is rejected asF
>
F
crit and the R2
-value is not random.
The scatterplot of the residuals appeared as random points centered at zero up to approximately 4500 s and then there seems to be a distinct linearly increasing trend. It was decided to divide the data into two intervals (60 s ≤
t
≤ 4500 s and 4500 s <t
≤ 8700 s). Resulting in the following equations:152
.
0
0014
.
0
⋅
+
=
t
V
water 60 s ≤t
≤ 4500 s (4)01
.
8
001
.
0
10
2
⋅
7⋅
2−
⋅
+
=
−t
t
V
water 4500 s <t
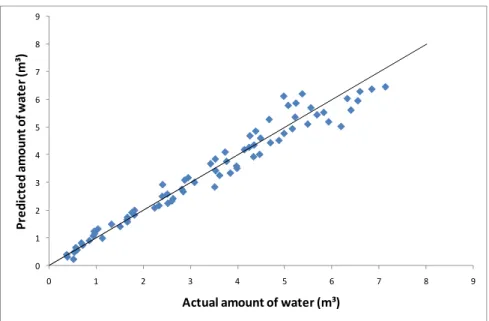
≤ 8700 s (5)The coefficient of determination of eqn. (4) was found to be: 0.959. The correlation coefficient was calculated to: 0.980 and the regression coefficient was calculated to: 0.976. The values are large enough to say that the presented eqn. (4) fits the data well. The coefficient of determination of eqn. (5) was found to be: 0.729. The correlation coefficient was calculated to: 0.843 and the regression coefficient was calculated to: 0.979.
0 1 2 3 4 5 6 7 8 9 0 1 2 3 4 5 6 7 8 9 P re d ic te d a m o u n t o f w a te r (m ³)
Actual amount of water (m³)
Figure 1: Comparison of regression model results with statistical data for amount of water, 60 s <
t
≤ 4500 s.In figure 1 it can be seen that there are relatively small deviations of the predicted values from the actual values. Thus the presented equation fits the data well. 0 2 4 6 8 10 12 14 16 18 0 2 4 6 8 10 12 14 16 18 P re d ic te d a m o u n t o f w a te r (m ³)
Figure 2: Comparison of regression model results with statistical data for amount of water, 4500 s <
t
≤ 8700 s.In figure 2 it can be seen that there are relatively small deviations of the predicted values from the actual values. Thus the presented equation fits the data well.
4.2 The extinguishing time as a function of the total fire area
An initial t-test indicated that the relationship between the independent variable: the fire area and the dependent variable: the extinguishing time is likely not due to random chance.
A total of 27,082 wildfires were included in the analysis. The variables were investigated within the following intervals:
- The fire area: 1 m2 ≤
A
fire ≤ 180,000 m2- The extinguishing time: 1080 s ≤
t
≤ 18,240 s A least squares fit resulted in the following potential equation:180 . 0
1550
A
firet
=
⋅
(6)The correlation coefficient was calculated to: 0.863
The Pearson correlation coefficient (p-value) was calculated to: 0.0003 (
α
=
0.05), thus the correlation is statistically significant.The regression coefficient was calculated to: 0.863
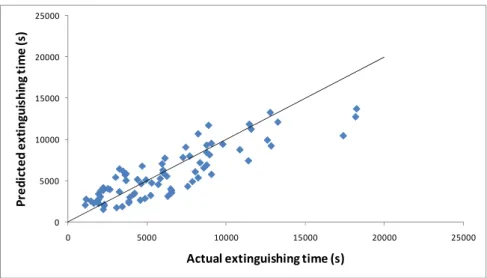
The coefficient of determination of eqn. (6) was found to be: 0.670 The null hypothesis is rejected as
F
>
F
crit and the R2
-value is not random. The scatterplot of the residuals appeared as random points centered at zero and thus the proposed eqn. (6) fitted the data well.
0 5000 10000 15000 20000 25000 0 5000 10000 15000 20000 25000 P re d ic te d e x ti n g u is h in g t im e ( s)
Actual extinguishing time (s)
Figure 3: Comparison of regression model results with statistical data for extinguishing time.
In figure 3 it can be seen that there are moderate deviations of the predicted values from the actual values. Thus the presented equation fits the data fairly well.
4.3 The application rate
An initial t-test indicated that the relationship between the independent variables: the fire area and the flame height the dependent variable: the application rate is likely due to random chance. Thus no further analysis was conducted with respect to this dependent variable.
4.4 The total fire area as a function of the flame height
An initial t-test indicated that the relationship between the independent variable: the flame height and the dependent variable: the total fire area is likely not due to random chance.
A total of 11,355 wildfires were included in the analysis. The variables were investigated within the following intervals:
- The fire area: 400 m2 ≤
A
fire ≤ 9,500 m2- The flame height: 0.1 m ≤
H
f ≤ 10 m A least squares fit resulted in the following potential equation:6151 . 0
3000
f fireH
A
=
⋅
(7)The correlation coefficient was calculated to: 0.978
The Pearson correlation coefficient (p-value) was calculated to: 4.85·10-5 (
α
=
0.05), thus the correlation is statistically significant.The regression coefficient was calculated to: 0.996
The coefficient of determination of eqn. (7) was found to be: 0.780 The null hypothesis is rejected as
F
>
F
crit and the R2
-value is not random. The scatterplot of the residuals appeared as linearly increasing points up to approximately 2 m and then there seems to be a distinct decreasing trend. It was decided to divide the data into two intervals (0.1 m ≤
H
f < 2 m and 2 m ≤f
H
≤ 10 m). Resulting in the following equations:971 . 0
4310
f fireH
A
=
⋅
0.1 m ≤H
f< 2 m (8)16000
3700
286
⋅
2−
⋅
+
=
f f fireH
H
A
2 m ≤H
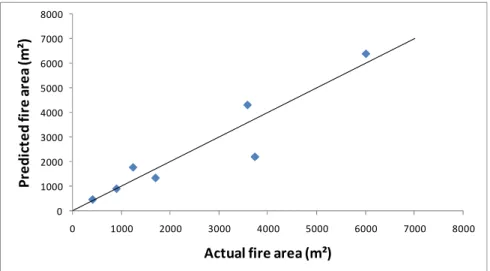
f ≤ 10 m (9) The coefficient of determination of eqn. (8) was found to be: 0.900. The correlation coefficient was calculated to: 0.934 and the regression coefficient was calculated to: 0.990. The coefficient of determination of eqn. (9) was found to be: 0.940. The correlation coefficient was calculated to: 0.969 and the regression coefficient was calculated to: 0.998. The values are large enough to say that the presented eqn. (8) and (9) fits the data well.0 1000 2000 3000 4000 5000 6000 7000 8000 0 1000 2000 3000 4000 5000 6000 7000 8000 P re d ic te d f ir e a re a ( m ²)
Actual fire area (m²)
Figure 4: Comparison of regression model results with statistical data for total fire area, 0.1 m ≤
H
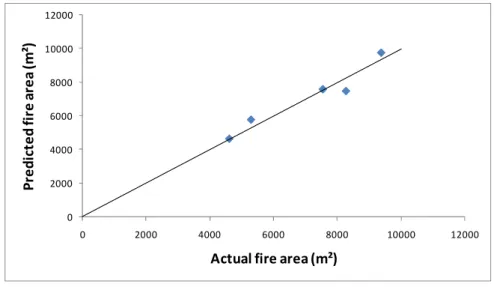
f < 2 m.0 2000 4000 6000 8000 10000 12000 0 2000 4000 6000 8000 10000 12000 P re d ict e d f ir e a re a ( m ²)
Actual fire area (m²)
Figure 5: Comparison of regression model results with statistical data for total fire area, 2 m ≤
H
f ≤ 10 m.In figure 4 and 5 it can be seen that there are small deviations of the predicted values from the actual values. Thus the presented equations fit the data well.
5
Discussion
The amount of water as a function of the extinguishing time showed a strong correlation. The correlation shows a linearly increasing amount of water for an increasing extinguishing time up to an extinguishing time of 4500 s. It could be that the initial phase of the wildfire is distinguished by a certain build-up of a hose system that may differ in size between a smaller fire and a larger fire, but still the water application rate does not differ markedly. For extinguishing times longer than 4500 s, the increase is somewhat larger and thus the application rate seems to start to increase at this stage. This could possibly be explained by reinforcements arriving and increasing the manpower and the capability.
The extinguishing time as a function of the total fire area showed a fairly strong correlation. The correlation shows initially a rapidly increasing extinguishing time for the smaller fire areas and an almost linearly increase for the larger fire areas. This is most likely due to that even for smaller wildfires a certain degree of hose lay and build-up of equipment will have to take place and thus the extinguishing time will – in proportion to the fire area – be larger for smaller fires than for larger fires.
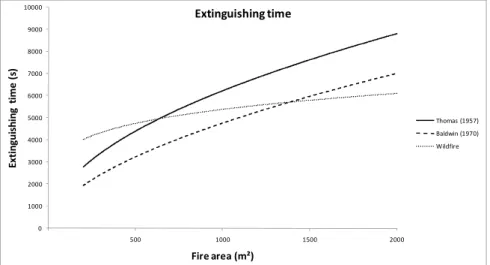
In figure 6 a comparison is made between the eqn. (1) of Thomas [3], eqn. (2) of Baldwin [4] and eqn. (6). It is interesting to see that the result of eqn. (6) is higher for smaller fire areas and leveling off for larger fire areas, whereas the equations of Thomas and Baldwin increases more for larger fire areas. A possible explanation could be that the initial build-up of a hose system etc. is more time consuming for a wildfire than for a residential fire with respect to the fire area. This could be due to difficult terrain, lack of roads etc. The leveling off of eqn. (6) could be that the active fire area does not increase at the same rate as the total fire area does after an initial accelerating phase, whereas for residential fires – due to for example the nature of the enclosure – the size of the active fire area is often equal to the total fire area.
The total fire area as a function of the flame height showed a strong correlation. The correlation shows initially a rapidly increasing total fire area but levels off for higher flame heights. The leveling off could be that the fire area will eventually – after an initial accelerating phase – start to level off and will not increase as much as before despite a larger flame heights.
0 1000 2000 3000 4000 5000 6000 7000 8000 9000 10000 500 1000 1500 2000 E x ti n g u is h in g t im e ( s) Fire area (m²) Extinguishing time Thomas (1957) Baldwin (1970) Wildfire
Figure 6: The extinguishing time as a function of the fire area. The variables in the statistical material are limited in numbers and a more extensive analysis would require the inclusion of more variables in the database.
6
Conclusions
In this study, regression analysis which is a statistical technique used for the investigation of relationships between variables was performed for wildfire suppression.
The values calculated from the obtained formulations with regression analysis were found to be in good agreement in the following cases: The amount of water
as a function of the extinguishing time; the extinguishing time as a function of the fire area; and the fire area as a function of the flame height.
It was observed that the derived equations from the analysis in the above cases could provide an accurate computation. The equation for the amount of water as a function of the extinguishing time could be of use when forecasting the need for water during an ongoing wildfire and the equation for the extinguishing time as a function of the fire area could be of use as the duration of water application has to be accounted for and multiplied by the water application rate in order to receive the total amount of water required for extinguishing a wildfire.
In a future study it is recommended that fuel variables are included as well as the fuel will most likely effect the amount of water used and the extinguishing time as different fuel configurations will lead to differences in the water penetration depth etc. Also a further analysis of the wildfires lasting more than 24 hours is also recommended, as these fires are generally very large in size, amount of water and extinguishing time, and would thus extend the validity of the formulations. If possible the control times of the wildfires should be used instead of the time to extinguishment as this would give values that are more appropriate for the initial critical phase.
7
References
[1] Stechishen E., Measurement of the effectiveness of water as a fire
suppressant, Forest Fire Research Institute Information report FF-X-23,
Ottawa, 1970
[2] Stechishen E. & Little E.C., Water application depths required for
extinguishement of low intensity fires in forest fuels, Forest Fire Research Institute Information report FF-X-29, Ottawa, 1971
[3] Thomas P.H., A note on the extinguishment of very large fires, Fire Research Station, Borehamwood Fire Research Note #245, Borehamwood, 1957
[4] Baldwin R., The use of water in the extinguishment of fires by brigades, Fire Research Station, Borehamwood Fire Research Note #803, Borehamwood, 1970
[5] Loane I.T. & Gould J.S., Project Aquarius, Aerial Suppression of
Bushfires, National Bushfire Research Unit, CSIRO Division of Forest
Research, Canberra, 1986
[6] Douglas D.R., Initial attack standards, Research working group no 6, Newsletter no 4, July 1973
[7] Andrews P.L. & Rothermel R.C., Charts for interpreting wildland fire
behaviour characteristics, USDA Forest Service, Intermountain Forest and
Range Experiment Station General Technical Report INT-131, Ogden, 1982
[8] Alexander M.E., Fire behaviour as a factor in forest and rural fire
suppression, New Zealand Fire Service Commission & The National Rural
Fire Authority Forest research bulletin no 197 Forest and rural fire scientific and technical series report no 5, Wellington, 2000