INFLUENCE OF QUENCH RATE ON THE
HARDNESS OBTAINED AFTER
ARTIFICIAL AGEING OF AN Al-Si-Mg
ALLOY
Federico Fracasso
THESIS WORK 2010
MATERIALS AND MANUFACTURING –
CASTING
INFLUENCE OF QUENCH RATE ON THE
HARDNESS OBTAINED AFTER
ARTIFICIAL AGEING OF AN Al-Si-Mg
ALLOY
Federico Fracasso
This thesis work is performed at Jönköping Institute of Technology within the
subject area Materials and Manufacturing - Casting.
The author is responsible for the given opinions, conclusions and results.
Supervisor: Emma Sjölander, Salem Seifeddine
Credit points: 15 points (C-level)
Date:
Abstract
The influence of quench rate on the microstructure and hardness of an AlSiMg alloy was investigated. The alloy had a predefined SDAS of about 25 μm, which was obtained by gradient solidification. The alloy was heat treated by a T6 treatment, which consists in three different steps: solution heat treatment, quenching and artificial ageing. In the solution heat treatment, two different temperature were used. Five different quench medias were used, in order to obtain different quench rate. Besides the quench rate, the influence of ageing time on hardness and microstructure was investigated. Two different ageing temperatures (170 °C and 210 °C) and nine different ageing times (from 5 min to 220 hours) were used.
An increase in quench rate until 3 °C/s leads to a high increase on hardness. Increasing quench rate above 3 °C/s, little increases in hardness were detected. A little increase in hardness was detected by increasing the solution treatment temperature. Time to peak aged condition is not influenced by the quench rate in case of quench in water; in case of lower quench rate, longer time to peak were detected. For the same quench condition, an increase in ageing temperature leads to a little decrease in hardness, with a high decrease in time to peak aged condition. Quench rate influences the amount of Si and Mg inside the dendrites for low quench rates. The morphology of intermetallic phases is influenced only by the solution treatment temperature. The results were compared to other works present in literature.
Key Words
Table of Contents
1
Introduction ... 3
1.1BACKGROUND ... 3
1.2PURPOSE AND AIMS ... 4
2
Theoretical background ... 5
2.1CAST ALUMINIUM ALLOY ... 5
2.1.1 General information ... 5
2.1.2 Designation ... 6
2.1.3 Commercial Aluminium Alloys ... 7
2.1.4 Influence of alloying elements ... 8
2.2HEAT TREATMENT ... 11 2.2.1 General information ... 11 2.2.2 Solution treatment ... 13 2.2.3 Quenching ... 14 2.2.4 Ageing treatment ... 14 2.3QUENCH ... 17 2.4HARDNESS ... 20 2.4.1 General information ... 20 2.4.2 Brinell Hardness ... 21 2.4.3 Vickers hardness ... 22 2.3.4 Rockwell hardness ... 23 2.5MICROSTRUCTURE ANALYSIS ... 23 2.5.1 Generation of X-rays ... 24
2.5.2 Wavelength Dispersive Spectroscopy (WDS) ... 25
2.5.3 Energy Dispersive Spectroscopy (EDS) ... 25
3
Implementation ... 26
3.1SAMPLES PREPARATION AND GRADIENT RE-SOLIDIFICATION ... 26
3.2FURNACE TEMPERATURE AND HEATING RATE ... 27
3.3QUENCH RATE ... 29
3.4HEAT TREATMENT ... 33
3.4.1 Solution heat treatment ... 33
3.4.2 Quench ... 34
3.4.3 Ageing treatment ... 35
3.5HARDNESS MEASUREMENTS ... 37
3.6MATRIX AND PARTICLES ANALYSIS ... 38
4
Results ... 40
4.1HARDNESS RESULTS ... 40
4.2MATRIX ANALYSIS ... 43
4.3PARTICLES ANALYSIS... 46
4.4INFLUENCE OF QUENCH RATE ON PEAK HARDNESS VALUES ... 48
5
Conclusions ... 53
6
Acknowledgements ... 53
7
References ... 54
1 Introduction
1.1 Background
The environmental problems are becoming more important in the last years and they are surely connected to the higher use of combustibles quantities. It is so necessary to reduce the vehicles weight, in order to reduce fuel consumption. About aircraft, both for military and civil use, weight reduction is very important, because lighter planes lead to fuel reduction and obviously more transportable load with the same engine power. To reduce the aircraft weight many different solution were adopted, like the use of aluminium alloys, composites and titanium alloy for parts which have to resist high temperature. In the automotive many different solution were adopted and a massive use of aluminium alloys is one of these. More and more often wrought and cast aluminium alloys are used in automotive body framing, chassis, engine and many other components. These parts were earlier produced by using steel or iron, but use of aluminium alloys leads to lighter parts, although sometimes they are more complex or bigger. In force of higher castability of aluminium alloys, it is possible to produce an unique part which implements the functions usually done by other parts; in this way it is possible to reduce the number of components, which leads to economic advantages. In comparison to steel or iron, aluminium alloys have lower mechanical properties, as strength, hardness and heat resistance. So, especially for the critical component, it is necessary to find the way to obtain alloys of specific mechanical characteristics, in order to achieve a progressive substitution of steel and iron parts. Nevertheless, aluminium alloys show a better thermal conductivity and this property allows to use these alloy in application where heat removal is necessary, for example in block engine.
One of the mechanical properties which has to be considered is hardness and the aim of this work was to check the influence of some metallurgical parameters on this property. The alloy type used, Al-7Si-0.4Mg, is usually used in automotive parts, like wheels or engine parts, in marine application or in aircraft, due to the presence of Mg, which favours the corrosion resistance [1,2]. The final properties of an alloy aren’t due only to its chemical composition, but also to its metallurgical history. It is
possible to use a lot of different treatments to change the properties of an alloy. Thus find the optimal treatment has a fundamental importance, in order to achieve the desired properties
1.2 Purpose and aims
The aim of this work was to check the influence of quench rate on the hardness obtained after artificial ageing. The work is composed by two different parts: at the beginning different quench media were used in order to obtain different quench rate; after the quench, different times and temperatures were used in order to check the influence of the artificial ageing treatment. In this way it was possible to find the correlation between quench rate, ageing times and hardness. Microscopic analysis were conducted in order to check the influence of the quench rate on the final microstructure.
2 Theoretical background
2.1 Cast aluminium alloy
2.1.1 General information
With increasing demand in vehicle weight reduction for fuel efficiency and emission control, aluminium alloys and in particular high integrity shaped cast aluminium components have drawn great attention in automotive applications due to their excellent castability, corrosion resistance, and especially their high strength to weight ratio [3-5]. Aluminium alloys have a density that is about one third of steel; in recent time, this property is a big advantage in automotive applications, where lighter cars are requested to reduce environmental problems connected to fuel consumption. In the automotive market, where even lighter components are request, this is an obvious advantage. It is possible to substitute heavy components made by using iron or steel with lighter components in aluminium. Another advantage of aluminium alloys is the possibility to obtain a lot of different mechanical properties, by very few changes in chemical composition or in the heat treatment.
Within the aluminium alloy, there is a special category of alloys which require special attention, the cast aluminium alloy. These kinds of alloy are used in many different markets, firstly in transport (automotive, aircraft, trains, boats). The principal advantages of the cast aluminium alloy are low melting temperature, low solubility of gases (except hydrogen), good fluidity and good surface finishes. Good fluidity has a special importance because it allows to obtain very complex parts; good surface finish allows to reduce to minimum the finish operations and thus this leads to cost reductions. High solidification shrinkage is one of the disadvantage, so very accurate foundry practices have to be employed to avoid problems during the cast.
2.1.2 Designation
There are different systems for designate cast aluminium alloy and they depend on the countries. In Europe, Euronorm UNI EN 1676 and UNI EN 1706 [6] regulate the designation of this kind of alloy. In these designation, type and chemical composition have to be indicate. As reported below, initials EN indicate European Norm, letter A indicates Aluminium, the following letter indicates alloy type (M = master alloy, C = casting, B = for remelt); the following numbers indicate chemical composition, starting from the principal elements and proceeding with the secondary alloy elements (for some examples see Table 2.1).
EN AY XXXXX Z
Table 2.1. European Aluminium Casting Alloy Designation [6]
21XXX = Al Cu 46XXX = Al Si9 Cu 41XXX = Al Si Mg Ti 47XXX = Al Si (Cu) 42XXX =Al Si7 Mg 48XXX = Al Si Cu Ni Mg 43XXX = Al Si10Mg 51XXX = Al Mg 44XXX = Al Si 71XXX = Al Zn Mg 45XXX = Al Si5 Cu
The norm indicates also the metallurgical condition of the alloy; this is represented by the letter Z in the designation reported above (see Table 2.2).
Table 2.2. European Designation for the metallurgical condition [6] S = sand cast L = lost foam K = permanent mold F = from foundry
D = die casting O = annealed
The other system for designate the cast aluminium alloy is the American one, which is maybe the most used. The Aluminium Association system uses a designation by four numbers, the first one of those indicates the principal elements and the second ones indicate the other elements in the alloy. The last one numbers, positioned after a dot, indicates the alloy type (0 for casting, 1 and 2 ingot). The principal types of alloys are summarized in Table 2.3.
Table 2.3. American Aluminium Casting Alloys Designation [1]
It is very difficult find a correlation between American and European designation systems, because many alloys are not designated in both the designation systems.
2.1.3 Commercial Aluminium Alloys
Within cast aluminium alloys, 3XX.X series alloys are the most used, in force of their exceptional range of properties. In this series, as reported in Table 2.3, there are Al – Si – Mg and Al – Si – Cu – Mg alloys. Within these alloys, typical examples are A356 and A354 alloys. The Cu and Mg additions allow to obtain particular mechanical properties, as it is reported in the Section 2.1.4. Considerations reported below are relative to heat treated alloys: results could be different in case of as-cast condition.
Aluminium – Silicon – Copper alloys show high strength and high machinability, but low castability, low ductility and low corrosion resistance. Cu particles break the superficial oxide film, which is formed automatically when the alloy is exposed in atmospheric ambient [2]. Mg addition leads to better resistance against corrosion attack from air and water. Mg addition leads also to higher strength, due to the precipitation of Mg2Si particles during ageing treatment. Some works in literature [7]
report an increase of 78 MPa (from 337 to 415 MPa) on the yield strength when Mg is added to an Al-Si-Cu alloy (for peak ageing at 150 °C); the elongation decreases less than 1%. A typical application of the Al – Si – Cu – Mg alloys is in the automotive. For example, A390 (Al–17Si–4Cu–0.55Mg) alloy is used in cylinder block where high strength and high corrosion resistance are requested. A332 (Al–12Si–1Cu–1Mg– 2Ni) alloy is used for piston in internal combustion engine. In this case, Cu lead to high strength, Mg provides to corrosion resistance and strength and Ni allows to resist to high temperature.
Aluminium – Silicon – Magnesium alloys show lower strength than Al – Si – Cu – Mg alloys [8], because of absence of copper in the chemical composition. Although Mg addition has a lower effect on strength than Cu addition, it provides high strength value. It was demonstrated [9] that yield strength is correlated to Mg wt.% in two different ways: for Mg concentration up to around 0.5 wt.% the increase in yield strength is linear, for higher Mg concentrations, the increase is reduced. It is possible to explain this thinking to the iron phases stability: at high Mg levels, the π – Fe (Al9FeMg3Si5) phases are stable [10-12] and this leads to lower Mg percentage usable
for precipitation hardening. Nevertheless these alloys show higher corrosion resistance than Al-Si-Cu alloys, so it is possible to use them in marine applications or in very corrosive environments. Automotive (wheels and engine) and aircraft components are other application in which this kind of alloys are used.
2.1.4 Influence of alloying elements
Pure aluminium is not useful for industrial purposes, because it has poor mechanical properties. So usually various elements are added to pure aluminium, to enhance strength, ductility or any other mechanical characteristic. Mechanical properties are usually enhanced by adding alloying elements and using heat treatments. If fact elements additions are more useful if an heat treatment follow the casting, in order to generate hardening precipitates. Sometimes the effect of elements additions is showed also after casting.
There are many chemical elements that it is possible to add to pure aluminium, and each of those provides different results. The principal and most effective elements are Silicon, Copper, Magnesium, Iron and Strontium. Usually Si is always present in the principal commercial alloys, so, after a brief introduction about Si effects, it will be considered the effects of the others alloying elements on Al-Si alloys.
Silicon
Silicon additions provides higher castability and, more generally, better casting characteristics. Higher amount of silicon leads to higher fluidity and thus to easier cast conditions. As reported in literature [5,14], increases in the silicon content increase modulus of elasticity and decrease elongation. Other characteristics of Silicon addition are lower hot tearing and higher brittleness. Looking to the phase diagram (Figure 2.1), it is possible to notice three different kind of Al-Si alloy: hypoeutectic, eutectic or hypereutectic. In standardized commercial cast aluminium-silicon alloys Si content is in the range of 5 to 23 wt%, but usually the common Si percentage varies from 7% to 13 %. These kind of alloys are called hypoeutectic and their structure are formed of Al dendrites and eutectic. In case of hypereutectic alloys (Si content higher than 13%), the structure is formed by primary Si crystals and eutectic. Content of silicon particles in the alloy depends on solidification rate and thus from the casting process. The shape of eutectic Si particles is influenced from heat treatment and chemical modification: solution heat treatment spheroidizes silicon particles and fragments long silicon fibres; Sr modification reduces the size and aspect ratio of silicon particles by as much as 50% to 100% [5].
Copper
The major advantages of copper addition are increases in strength and hardness, both in as-cast condition and after heat treatment. Usually a percentage between the range 0.5 – 4 % is added to the alloy, because in this range the alloy shows a better behaviour during casting and better properties after heat treatment. Addition of Cu leads to high strength and high machinability, but it reduces corrosion resistance and ductility. The most important phase formed in Al-Si-Cu alloys is θ phase (Al2Cu); its
shape, in as cast condition, depends on solidification rate and Sr modification: high solidification rate leads to eutectic Al2Cu phase, while Sr modification increase the
than eutectic Al2Cu phase because the first ones don’t fragment, as the second ones,
but it dissolves by diffusion and spheroidization; this lead to a longer solution time.
Magnesium
Mg addition leads to higher corrosion resistance, good machinability and good properties like anodizing, painting and polishing, but it reduces castability. The role of magnesium in aluminium-silicon alloys is to precipitate β” phase (Mg2Si). By adding
Mg, it is possible to achieve the aim of making the aluminium alloy age – hardenable, increasing yield strength, tensile strength and hardness, but this addition might influence the microstructure and particularly the type and shape of brittle phases, decreasing ductility and toughness [9]. Mechanical properties are also influenced by heat treatment conditions: from the point of view of tensile strength and ductility, solution temperature has a greater effect than time on Al-Si-Mg alloys, while for yield strength, changes in time or temperature have almost the same effects [16,17]. Mg effect on mechanical properties is different as function also from the content of other alloying elements, like Fe, as reported before (Section 2.1.3).
Iron
Iron can be see as alloying element or as impurity at the same time. α-Al8Fe2Si,
β-Al5FeSi and π-Al9FeMg3Si5 are the principal Fe phases which can be formed. These
phases increase strength, especially at high temperature, but they reduce ductility because they have a script-like shape and this leads to local stress concentration, where it is possible crack initiations [5,12]. Nature, type, and amount of Fe-rich phases present in an Al-Si-Mg alloy (after solution heat treatment) depends on Mg content: for low Mg content (up to 0.4 wt.%), principal Fe – phase is β-Al5FeSi,
while for higher Mg content the majority Fe – phase π-Al9FeMg3Si5 [12]. The amount
of different phases can be modified by heat treatment. For example, in as cast A356 alloy, π-Al9FeMg3Si5 is the dominant phase; after solution treatment, with the
dissolution of Mg to the matrix, an higher content of β-Al5FeSi is present [11]. During
the casting process, iron can form slag with chromium, manganese or other elements, if they’re present.
Strontium
Sr addition leads to modifications of the eutectic structure, changing the shape of eutectic Si phases from plates to fibrous. The main advantage of the structure change is the higher ductility of the material. Silicon particles could be a starter for cracks inside the material, if they are present as large brittle flakes. Combination of Sr addition and solution treatment leads to reductions of heat treatment schedules, costs and energy consumption [16,17]. Sr modifies eutectic Si particles morphology from plates to fibrous, which is easier to fragment and spheroidize during solution heat treatment; this leads to a shorter treatment time. Other elements can be added to aluminium alloy to modify the eutectic structure, such as sodium, calcium and antimony, but everyone has some problem; for example sodium is the most powerful modifier, but it react with the material and it vaporizes during modification treatment.
2.2 Heat treatment
2.2.1 General information
The term “heat treatment” indicates a sequence of controlled heating and cooling, which leads to microstructure modifications, and thus to changes in the properties, of a material. In many cases, heat treatment is necessary to achieve optimal properties, which allows to use a material for industrial purposes. The objectives of the heat treatments are very different: increase in strength, increase in hardness, relieve residual stress, increase ductility an many others. Aluminium alloys are very versatile, because they can be used in many different heat treatments, as function of their chemical composition and of required mechanical properties. The main heat treatments were standardized by some norms, such as American Association, as reported below [2]:
• O, annealed
• T4, solution heat treated and quenched
• T5, artificially aged from the as-cast condition
• T6, solution heat treated, quenched, and artificially aged • T7, solution heat treated, quenched, and overaged
As it is possible to see, there are many differences between the various heat treatment. Thinking to how many variables there are for each treatment (time and temperature, firstly) and how many different chemical compositions of aluminium alloys exist, it is possible to understand why heat treatable aluminium alloys are so important: it is possible to obtain a lot of different final properties, only by changing the composition or the heat treatment parameters. To be heat treatable an aluminium alloy must have a solubility of its alloying elements which is a function of the temperature (Figure 2.2.). In fact, main heat treatments are based on the precipitation of second phases, during changes in temperature.
Figure 2.2. Elements solubility as a function of the temperature [13]
For example, Si in Al has a limited solubility (Figure 2.2) and so it is possible obtain a Si precipitate in Al matrix after an sufficiently rapid cooling. Some elements change the solubility zone of other elements, in terms of temperature or percentage(Figure 2.3a).
Figure 2.3. Equilibrium solubility of Mg in solid solution when both Mg and Si are present (a) [18] and Al-Mg2Si phase diagram (b) [19]
In some cases, such as for ternary alloys, it is possible to represent the solubility of the second phase as a function of the temperature (Figure 2.3b). Chemical composition is not the only parameter that influenced the final properties. In order to use in the right way the limited solubility of some elements, it is necessary to establish some rules about heating and cooling rates. In fact, if a material is cooled too slow from the solution treatment temperature, solute atoms can move inside the structure and form coarse precipitates which are not useful for strength increase. In this case, when the material is at the solution treatment temperature, it is necessary to quench it, to block the atoms in the position that they occupied before. In this way, it is possible to obtain a super-saturated solution, which it will be modified subsequently by other heat treatments. One of the most utilized heat treatment is T6 treatment. It consists in three different steps: solution, quenching and artificial ageing.
2.2.2 Solution treatment
The first step consists in an increase in temperature, in order to dissolve and disperse uniformly in the matrix the phases formed during the solidification, as β-Mg2Si,
π-Al9FeMg3Si5 and β-Al5FeSi (also θ-Al2Cu and Q-Al5Cu2Mg8Si6, in case of presence
of Cu). β-Mg2Si and θ-Al2Cu are easy to dissolve, while π-Al9FeMg3Si5 is harder to
dissolve, in force of the limited diffusivity of Fe in Al [11,20]. The solution temperature depends on the treated alloy: it is important that the solution treatment treatment temperature is lower than that one on which alloy begins to melt. For example, in an binary alloy, the maximum temperature for the solution treatment is the solidus temperature. However, many times, in an alloy there are more than only two elements; so it is important to check the chemical composition before start the treatment. In this way it is possible check if there are some low melting phases, which can melt during the solution treatment.
The required time has to be enough to arrive at an entirely homogeneous structure. The time depends on several parameters, as chemical composition, temperature, structure coarseness, casting method and phases to dissolve. Diffusivity rules regulates the atom movements and it is a function of the temperature, the diffusivity constant, the solute concentration and the diffusing distance, given by the coarseness of the structure. As reported ahead, the diffusivity depends also from the temperature: higher temperature leads to higher diffusivity and so it is necessary a shorter time for
achieve the complete solution. Treatment time is also depending on casting method: sand castings require twice as long as permanent mold castings [15].
2.2.3 Quenching
The aim of the quench is to obtain a supersaturated solution. In order to obtain this kind of structure, the temperature has to decrease more or less rapidly, as function of the initial temperature, the chemical composition and the final microstructure which is required. Usually, this treatment follows the solution heat treatment: quench blocks the atoms in the positions that they have achieved during the solution treatment. This treatment avoids, or limits, precipitations of second phases or precipitates. These precipitates should be obtained during the ageing treatment, in order to achieve an higher increase in mechanical properties. In that case, in fact, it is possible to have a better control on the precipitate morphology. For more detail about the quench, see Section 2.3.
2.2.4 Ageing treatment
Many times the structure obtained after quench is not able to give useful mechanical properties for the industrial use. The material in as-quench condition can show higher properties than that one in as-cast condition, but sometimes they are not enough. The large thermal gradients that arise during the quench operation induce large thermal-stresses. The thermal stresses, if sufficient, will cause differential strains in the component (or residual stresses). These residual stresses typically remain after the age hardening treatment, as the ageing temperature is insufficient to allow stress relaxation [21]. The next step, in the T6 heat treatment, is then an artificial ageing treatment, which consist in an heating of the material until a certain temperature, usually between 90 °C and 230 °C. Doing this operation, the atoms mobility is increased; as reported in the diffusivity rule, increasing the temperature, the diffusivity increase and so the solute atoms can move in the material. The movement of atoms can cause the formation of GP zones (see below) which form hardening precipitates. These precipitates increase several mechanical properties such as yield strength and hardness. In case of an AlSiMg alloy, the principal precipitate is the β-Mg2Si phase. Other precipitates, as undissolved intermetallic phases, affect the
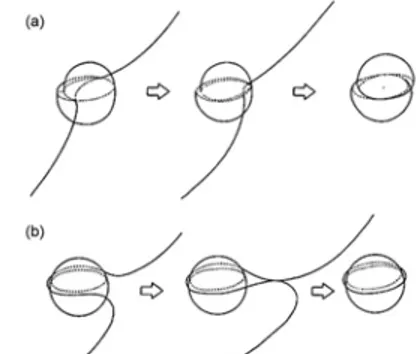
the possibility of movement of dislocations within the structure of the material. This movement can be slowed by the presence of particles, grain boundaries and work hardening. In case of heat treatable alloys the main strengthening mechanism is the use of alloying elements which allow the formation of secondary phases during heat treatment. To pass the precipitates and to continue their motion, the dislocation consume energy. This leads to an increase in the strength of the material because a greater effort must be applied in order to pass the precipitates. As it is possible to see in Figure 2.4, dislocations can pass the precipitate particles in two different ways, by shear (Friedel effect, Figure 2.4a) or by encirclement (Orowan mechanism, Figure 2.4b).
Figure 2.4. Dislocation movement: Friedel Effect (a) and Orowan mechanism (b) When the particle has big sizes, the dislocation passes the particle encircling it and continuing his way. Every time a dislocation has to pass a particle, it requires energy and so this request lead to an increase of strength. When the particles have smaller sizes, the dislocation passes them by a shear mechanism, because this requires less energy than the encirclement mechanism. As it is possible notice in Figure 2.5a, there is a specific size of the particle which leads to the maximum strength. So it is necessary find an optimal ageing treatment time, which allows to obtain this optimal size. Comparing Figures 2.5a and 2.5b, it is possible notice how the curve shape are quite the same: at the beginning the strength increases with increasing time, which causes an increase in particles sizes. When the peak value is reached, any further time spent in the ageing treatment will result only in a decrease in strength, because the particles will be coarser, decreasing their resistance to the dislocation movement.
Figure 2.5. Strength as a function of the radius of second phase particle (a) [22] and hardness as function of ageing temperature and time (b). [23]
In many alloys the equilibrium precipitates are not formed from the beginning, but a sequence of different precipitates are formed during the treatment. Usually the first step is the formation of Guiner-Preston zones [1]. GP zones are ordered solute-rich groups of atoms, coherent with the lattice structure and dispersed in the material. These groups of atoms usually have a size different from the lattice structure and they modify it, causing deformations in the lattice structure. Depending from atom type, GP zone can be bigger or smaller than lattice structure, and so they can cause respectively tension or compression efforts on the structure. GP zones are metastable and dissolve in presence of a more stable phase. With the proceeding of the treatment, the precipitates become more coarse and this situation furnishes the necessary condition to the GP zones to transform themselves in other precipitate. These new precipitates are the ones which allow to obtain the peak value in the mechanical properties. They are partially coherent with the matrix, so they can slow down the dislocation movements, also remaining connected to the matrix structure. If the treatment continues, these semi-coherent precipitates become incoherent. At this point, they decrease their opposition to dislocation movements and this leads to decreases in mechanical properties.
As reported before, another important factor in the artificial ageing treatment is the treatment temperature. Higher temperature leads to shorter treatment time, but the resulting properties could vary in relation to the alloy type. In some alloys, properties such as hardness remains quite constant and they are obtained in short time. In other alloys, the peak is reached in a short time, but the hardness values are lower than that
ones obtainable with a longer treatment at lower temperature. As reported in literature [24], at temperatures above 200 °C, the β” phase is substituted by the β’ phase, which gives a lower increase on mechanical properties as strength, because more incoherent. So it is necessary to find the combination time – temperature which allows to reach the peak value, seeing also the industrial production rhythm. Sometimes, in order to achieve economic treatment time, a value lower than the peak one is allowed.
2.3 Quench
After solution treatment, the material has to be quenched, in order to preserve the structure existing at high temperature. This condition is not favourable for the material, because it is in a disadvantageous energetic situation. The solute atoms are blocked in unfavourable positions, creating a saturated solution. A super-saturated solution is a solution in which there is a solute concentration higher than that one allowed at that temperature. Starting from solution temperature, the material is cooled more or less rapidly until the final temperature. The cooling rate depends on the final required mechanical properties and from the chemical composition. The main intention is to avoid formation of precipitates or second phases during cooling. These phases require different time to start their formation, as it is possible to notice in Figure 2.6. If the cooling rate is fast enough to avoid the formation of second phases, the final structure will be an unique solution made of uniformly solute atoms distributed inside the matrix.
As it is possible notice in Figure 2.6., the minimum precipitation time depends on the amount of solute atoms: the higher percentage of solute atoms the higher must the cooling rate be to avoid precipitate formation.
Figure 2.7. Modelled Temperature-Time-Yield Strength curves for A356 [25]
Usually, the higher nucleation rate occurs on a temperature range between 450 °C and 200 °C [26]. In this range, it should better to stay for a time as short as possible, in order to avoid precipitation, or to limit it as much as possible. Usually, for most alloys, in this range the average quench rate is calculated. It is possible to use different ways to calculate an average quench rate. In case of linear temperature decreasing (as for quench media like water), quench rate is the value of the slope of cooling curve. In case of non linear temperature decreasing (as for quench media like sand or insulation material), it is possible to calculate an average quench rate in mainly two different ways: dividing the temperature range 450 °C - 200 °C for the time necessary to cross this range, or calculating an integral average quench rate, using as integrand function a function which well fitted the quench rate values in the temperature range reported before.
It is possible to use many different quench media and each of those gives different final properties, because each of those leads to different quench rate. The main used quench media are water, oil, salt bath, air, insulation material and sand.
As it is possible to see in Figure 2.7, different quench rates lead to different final properties. This is because the cooling curves intersect in different ways the curves about the minimum time for precipitation and so different amount of precipitate are formed. As reported in many studies [22,26,27], it is possible to correlate some mechanical properties to the quench rate, individuating a parameter called “quench sensitivity”. Quench sensitivity is a measure of the susceptibility of an alloy to the nucleation and growth of non-hardening precipitates during the quench. As reported in many studies [22, 28], the quench sensitivity is higher for cast alloys than for wrought alloys. This behaviour is due to the higher percentage of element in solution and also it is due to the presence of eutectic Si particles, which influence the quench sensitivity in several ways. Reducing the quench rate, Si in excess inside the matrix moves by diffusion to eutectic Si particles. Mg concentration is reduced by the nucleation of β-Mg2Si phase on eutectic Si particles. Another effect of the eutectic Si
particles is the higher dislocation density, due to the difference in thermal expansion between Si and Al. This difference lead to the formation of nucleation sites for precipitates.
The quench sensitivity parameter allows to correlate mechanical properties, for example UTS and YS, to quench rate. By using the quench sensitivity analysis it is possible to find a continuous function, for example like this one [27]:
2
log ( )r log( )r
YS= ⋅A Q + ⋅B Q + (Eq. 1) C
which correlates the Quench Rate to the Yield Strength. The terms A, B and C are determined experimentally and they depends only from the alloy type and from the coarseness of the structure. The terms A and B give an indication about the quench sensitivity and higher values of this parameters indicate higher quench sensitivity. Many tests presented in literature show that the mechanical properties, such as UTS and YS, are directly dependent from the quench rate. This is true for a quench rates until a certain value, for example, for A356 alloy, transition point between YS and
quench rate is 4 °C/s [27]. Over this quench rate, mechanical properties can be almost independent from the quench rate, as reported in Figure 2.8.
Figure 2.8. Yield Strength of A356 cast aluminium alloy in as-cast and heat treatment conditions subjected to various quench rates [27]
Other parameters could be used in order to describe the effect of a quench, like the quench factor. This parameter is the result of the combination of cooling curves and Temperature-Time-Properties curves, also called Curves for their shape. These C-Curves are not easy to determine, and in literature only few cases are reported [29,30].
2.4 Hardness
2.4.1 General information
Hardness is a measurement of the resistance of a metal to a permanent plastic deformation. The hardness of a metal is measured compressing an indenter on its surface; the indenter, that is usually a sphere, a pyramid or a cone, is constituted by a material harder than the material on test; the materials commonly used for the indenters, for example, are tempered steel, tungsten carbide or diamond. The greatest part of the standardized hardness tests foresees the slow application of a established load, which compresses the indenter in perpendicular direction to the metal surface. The indenter is removed from the surface after a pre-arranged time, which is reported on the norms. Then value of hardness is calculated or directly read on the test
machine, which is based on the area of the imprint or on its depth. Principally there are three different methods for the hardness measurement: Brinell, Vickers and Rockwell. With each tests, the resulted hardness value depends on the form of the indenter and from the applied load. Hardness's values obtained with different methods or with different scales are not comparable among them; it is possible to compare only by conversion type charts, which are completely experimental and valid for single classes of materials. Besides, since the hardness of a metal depends on the facility with it plastically deforms, for single classes of materials it is possible to empirically determine some correlations between hardness and mechanical resistance, particularly yield strength and ultimate tensile strength. This type of correlation is very useful because hardness test is simpler than tension test, and it can practically be a no destructive test (the small indentation of the indenter is not be able to be harmful to the object final use). For these reasons, in the industry, the hardness test is often used, in order to have a estimation of the characteristics of resistance of a material, and to have a method of control of quality, particularly to verify the efficiency of the hardening treatment of the materials.
2.4.2 Brinell Hardness
Brinell hardness method is used in prevalence for soft material, like mild steels, brasses and light alloys. This test was ideated by the metallurgist Brinell and it consists of pressing a smoothed sphere of tempered steel or hard metal, having diameter "D", for a pre-arranged interval of time, with a established strength "F" (test load), against the surface of the piece in examination and then to measure the middle diameter "d" of the imprint after the test load removal. For a certain load, the hardness value results inversely proportional to the surface of the imprint left by the sphere on the piece. The diameter D of the sphere and the load F change as a function of the type of material. The equation which allows the calculation of Brinell hardness (HB) is the following [31]:
(
2 2)
2 F HB D D D d π ⋅ = ⋅ ⋅ − − (Eq. 2) It is obtained from the based equation HB = F / S, replacing the term S with another expression obtained by trigonometric calculation. This expression is correct if the load is expressed in Kgf. If the load is expressed in Newton, the expression reported beforehas to be multiply for 0.102, a correctional factor for convert the different units. For soft material, the load can be decreased to avoid that the sphere entirely penetrates in the material, breaking down it. According to the EN 10003-1 norm [31], test load is gradually applied and it reaches the maximum value between the 2 and the 8 seconds; the duration of permanence of the maximum load is specified between the 10 and the 15 seconds. The normal test requires a sphere having a the diameter of 10 mm. For particular tests smaller spheres can be used: those recommended have a diameter of 5 or 2,5 mm, however not inferior to 1 mm. The piece thickness must be at least 8 times the depth of the imprint. The diameter of the imprint d must be between a quarters and a half the diameter of the sphere D, otherwise the test is not valid. The distance between the centres of the imprint and the edges of the piece must not be smaller of 2,5 d and the distance among the centres of two near imprints smaller of 3 d. In this way it is possible to avoid the yielding of the material around the imprint and the mutual trouble of the other imprints. The general equation HB = F/S has a limited field of acceptability, because the obtained hardness values depend on the relationship among the test load F and the diameter D of the sphere. For the comparability of the results of the Brinell test it is necessary that the relationship among the diameter of the imprint d and the diameter of the sphere D is constant, thus that the penetration angle is constant. Theoretically the nominal value of the constant is 0.375, but usually little variations around the nominal value are allowed (from 0.24 to 0.60).
2.4.3 Vickers hardness
This method could be considered an improvement of Brinell test, because it has a broader scope and because the obtained value is independent from the test load. A diamond indenter having the form of a straight pyramid with square base with an angle to the vertex among the opposite faces specified (136°) penetrates within the sample surface. It is measured therefore the length of the diagonal of the imprint left on the surface after removal of the test load F. Vickers hardness is proportional to the quotient obtained dividing the test load for the area of the imprint to tilted faces, which it is supposed corresponds to a straight pyramid to square base that introduces the same angle to the vertex of the indenter. So, measuring the average diagonal of the indentation, it is possible to obtain the indentation surface. By mathematical calculations, it is possible to obtain the final expression for Vickers hardness:
2 2 F sin 68 HV d ⋅ ⋅ ° = (Eq. 3) where F is the test load in Kgf and d is the average indentation. If the load is expressed in Newton, the results has to be multiplied by 0.102.
2.3.4 Rockwell hardness
The test consists in to penetrate in the piece, at two times, with two different loads (initial and total), an unified indenter (diamond cone or tempered steel sphere) and in to measure the increase of depth between the initial imprint and that final in the suitable time. This test in comparison to Brinell test and to Vickers test has some advantages, as shorter time for the test and no ones mathematical calculations.
There are different Rockwell scales, as function of the material type. Usually HRC scale is used on very hard steels, tempered or cemented on account of the superior value of the load and for the nature of the indenter. Instead, HRB scale is normally used on softer material, like the annealed steels and steel plates of thickness at least equal to 0.5 mm. Conventionally, the Rockwell C - scale hardness, which uses the diamond cone indenter, it is given by the expression HRC = 100 – e, in which HRC points out the symbol of the Rockwell C - scale hardness. The symbol "e" intends the remaining growth of the depth of penetration and it is expressed in 1/500 mm. Likewise, the Rockwell B - scale hardness, with tempered steel sphere indenter, is given from the expression HRB = 130 – e. The indenter can be a cone or a sphere: in the first case it is constituted by a diamond with the shape of circular cone with a vertex angle of 120° (± 0.5°) rounded off with ray of the terminal spherical cap of 0.2 mm (± 0.1), while in the second case it is constituted by a sphere of diameter equal to 1,587 mm of tempered hard steel.
2.5 Microstructure Analysis
In a scanning electron microscope (SEM) an electron beam, generated by heating of a tungsten filament, is focused on a very little spot on the material and this leads to generation of a variety of signals. These signals can be captured by using different detectors, as WDS and EDS detector, to determine the chemical composition of small volumes of solid materials. A common SEM is composed by an electron source, a series of electromagnetic lenses (which allow to focus the electron bean on a spot
diameter up to 1 μm), a vacuum chamber (where the sample is placed), a wavelength dispersive detector (WDS) and an energy dispersive detector (EDS). Other detectors can be present, in order to collect special measures. It is necessary a vacuum chamber in order to avoid the interaction between electrons and gas molecules. This spurious effect can be caused by presence of atmospheric gas or instable phases inside the sample: for this reason it is necessary that the sample is stable and completely dry. By using electron optics it is possible to collect imagines with a better resolution than that one allowed by a light microscope. The principal limitation is the overlapped x-rays peak position (by both energy and wavelength) generated by some element, thus sometimes it could be difficult to analyze the results. WDS exhibits superior peak resolution of elements if it is compared with EDS. EDS is less commonly used for actual chemical analysis because the wavelength-dispersive (WDS) method is more precise and capable of detecting lower elemental abundances [32]. This analysis is considered a no-destructive test, because X-rays generated by electron interactions do not lead to volume loss of the sample, so it is possible to re-analyze the same materials more than one time.
2.5.1 Generation of X-rays
X-rays are short-wavelength, high-energy electromagnetic radiation, having the properties of both waves and particles. X-rays are generated when an energetic beam of electrons interacts with the inner shell electrons by inelastic scattering with enough energy to excite inner shell electrons to outer shell orbitals, leaving inner-shell vacancies. An electron from an outer, higher-energy shell then fills the hole, and the difference in energy between the higher-energy shell and the lower energy shell may be released in the form of an X-ray [33]. These X-rays can be captured by a detector, which distinguishes different chemical element basing its analysis on the characteristic wavelength or on the energy. As the energy of the X-rays are characteristic of the difference in energy between the two shells, and of the atomic structure of the element from which they were emitted, this allows the elemental composition of the specimen to be measured. In order to achieve a sufficiently high energy level, electron beam is accelerated by using a potential difference of 15-20 kV.
2.5.2 Wavelength Dispersive Spectroscopy (WDS)
Using wavelength dispersive spectrometer it is possible to isolate interesting X-ray and thus to detect which elements are present. X-rays produced by interaction between electron beam and material are selected by an analytical crystal with specific lattice spacing and they proceeds to detector. Amount of different elements are calculated basing from the collected amount of X-rays having a certain wavelength.
2.5.3 Energy Dispersive Spectroscopy (EDS)
X-rays produced by collision between electron beam and sample are separated into an energy spectrum by an energy dispersive detector. In this ways it is possible to determine the amount of the different elements which are present inside the material. EDS systems is composed of an x-ray detector, a liquid nitrogen cooling system and software to collect and analyze energy spectra. The detector is typically represented by a single crystal silicon doped with lithium, covered at both ends with a conductive layer of gold, maintained under high vacuum at a temperature of -192 °C with liquid nitrogen. Crystal absorbs the energy of incoming X-rays by ionization, yielding free electrons in the crystal, which become conductive and produce an electrical charge bias. The X-ray absorption thus converts the energy of individual x-rays into electrical voltages of proportional size; the electrical pulses correspond to the characteristic x-rays of the element. In comparison with WDS, by using EDS it is possible to acquire a complete spectra in a shorter time.
3 Implementation
3.1 Samples preparation and gradient re-solidification
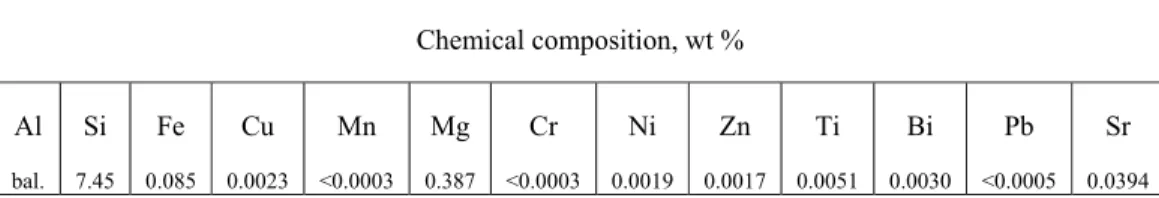
The experimental part started with the controlled re-solidification of aluminium alloy bars, having the chemical composition reported in Table 3.1. The bars had a length of 160 mm and a diameter of 10 mm.
Table 3.1. Chemical composition of the alloy
Chemical composition, wt % Al bal. Si 7.45 Fe 0.085 Cu 0.0023 Mn <0.0003 Mg 0.387 Cr <0.0003 Ni 0.0019 Zn 0.0017 Ti 0.0051 Bi 0.0030 Pb <0.0005 Sr 0.0394
The rods were putted in steel tubes, internally covered by a special graphite solution in order to allow the subsequently removal of the bars from the tubes. The tubes were closed on one side by a special material, in order to avoid air infiltrations from the bottom. The tubes were them putted inside a special furnace and they were supported by brass bars, which allow to obtain the right position of the tubes inside the furnace. The specimens were then remelted at a temperature of 715 °C and they were left at this temperature a predetermined time. For protect the melted metal from oxidation, an argon gas shield was used. After 30 min, the heating element was raised while the samples stayed in the same position. In the bottom part of the heating element there were three jets of water which cool the specimens as they passed by. In this way it was possible to use the gradient solidification technique, only by setting the moving rate of the furnace, which lead to change the solidification rate. For this work a Secondary Dendrite Arm Spacing (SDAS) of about 25 μm was needed. Setting the solidification rate at 0.3 mm/s, the right SDAS was achieved.
About sixty samples, having a length of 20 mm, were obtained cutting the rods. The so short length was allowed because no tensile tests were needed for this work. A short length allows also a better heat treatment.
3.2 Furnace temperature and heating rate
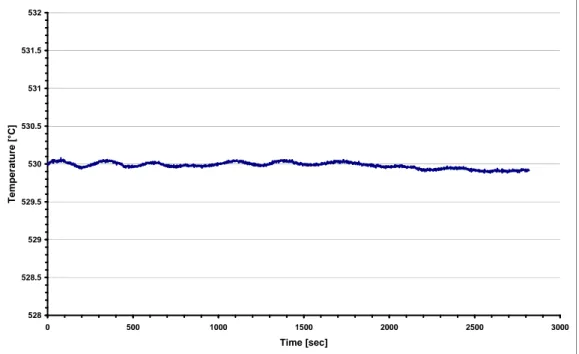
Before to start with the heat treatment, it was necessary to check the temperature inside the furnaces. This operation was necessary because the temperature set on the temperature regulator not ever is the exact temperature inside the sample. For example, the set temperature for the SHT furnace was higher than the temperature inside the sample. The set temperatures for the ageing furnaces, instead, were lower than the temperature in the sample. The furnaces temperatures were checked by using two thermocouples: the first one was fixed in the centre of the sample, the second one was inserted in the rear part of the furnaces for check if the temperature inside the furnace was the same of that one showed by the thermostat. An internal temperature inside the furnace for the solution treatment of 535 °C leads to a temperature of the sample of about 530 °C. As it is possible see in Figure 3.1, the temperature inside the SHT furnace was very stable.
528 528.5 529 529.5 530 530.5 531 531.5 532 0 500 1000 1500 2000 2500 3000 Time [sec] T e mp erat ure [ °C ]
Figure 3.1. Temperature stability inside SHT furnace
It was necessary to check how much time the samples required to arrive at the right temperature starting from room temperature. So it was necessary to check the heating rate. It was calculated, after experimental checks, that the sample required more or less 15 min to achieve the exact temperature in the furnace. At a temperature of about 530 °C, the time required for an optimal solution is about 3 hours. This time was
chosen in relation to the size of the sample and the values reported in literature for similar SHT temperatures [26,27]. So the total time for the solution heat treatment, from the introduction of the samples in the furnace to their removal, was about 3 hours and 15 min. Also for the ageing furnaces, it was necessary check the temperature stability inside the ovens. The temperatures were stable around the set temperature of 170 °C and 210 °C [Figure 3.2].
168 168.5 169 169.5 170 170.5 171 171.5 172 0 500 1000 1500 2000 2500 3000 3500 Time [s] T e mp erat ure [ °C ] 208 208.5 209 209.5 210 210.5 211 211.5 212 0 500 1000 1500 2000 2500 3000 3500 4000 Time [sec] Te mp e ra tur e [ °C]
Figure 3.2. Temperature stability inside ageing furnaces: 170 °C (a) and 210 °C (b) (a)
To test the repeatability, more or less the same quantity of material and temperature setting, in both solution treatment and ageing furnaces, were used in all the tests. For the solution treatment furnace, the number of samples inside it at the same time ranged from 2 to 5. For the artificial ageing treatment furnaces, the range of sample was from 1 (usually for short test) to 3 (usually for long test, 110 hours or 220 hours). It was checked that these range didn’t influence the temperature and its stability.
3.3 Quench rate
The aim of this work was to check the influence of quench rate on the hardness of an A356 aluminium alloy. It was therefore necessary to check the quench rate for the different quench media. By this operation it was possible to see the different quench rates and to compare the results with the ones in literature. Five different quench media were utilized:
- 60 °C water; - 100 °C water; - sand;
- insulation material - furnace.
A hole of 1.5 mm diameter and 10 mm length was drilled on a test sample and a thermocouple was fixed inside it. This thermocouple, connect to a logger, allowed to log the temperature inside the sample. As is possible to see in Table 3.2, the number of samplings per second changes in relation with the quench media. Higher the expected quench rate was and obviously higher the log rate was. For example, for the quench in 60 °C water, 40 samplings per second were logged. For the quench in furnace, instead, only 1 sampling per second was logged. For more security, the log rates in 60 °C and 100 °C were the same, although a lower log rate could be used. In the same table there are the quench rate obtained from the tests.
Table 3.2. Log rates and quench rates for the different quench media QUENCH MEDIA LOG RATE QUENCH RATE
[samples/second] [°C/s] 60 °C water 20 200 100 °C water 20 26 Sand 2 3 Insulation material 2 0.6 Furnace 1 0.008
Cooling curves were generated (Figure 3.3) and for each test the quench rate was calculated.
Figure 3.3. Quench curves for different quench media
The average quench rates within the temperature range of 450 °C to 200 °C were calculated. In this range, the quench rate is the most critical in influencing the mechanical properties. It is worth to notice that the differences between this quench rate values and the ones existing in literature are mainly due to different sizes of the samples. For example, in the Zhang and Zheng’s work [26] (article used for the results comparison), about the quench sensitivity of A356 aluminium alloy, are reported different values for the quench rate (see Table 3.3.)
Table 3.3. Comparison between the quench rates of this work and that ones of Zhang and Zheng’s work [26]
QUENCH MEDIA QUENCH RATE QUENCH RATE (Zhang – Zheng)
[°C/s] [°C/s] 60 °C water 260 110 100 °C water 22 20 Sand 3 - Insulation material 0.6 - Furnace 0.008 -
The samples used in the Zhang and Zheng’s work had a cross section of 14 x 14 mm2
and a length of 55 mm, which lead to a material volume of 10780 mm2. The distance between the centre of the sample, where the thermocouple was placed, and the heat exchange surface was so 7 mm length. The samples used in this work had a diameter of 9 mm and a length of 20 mm, which lead to a material volume of 5089 mm2. The distance between the centre and the surface was only 4.5 mm. So it is possible to say that the material volume and the absolute dimension of the samples influence the quench rate. Higher volume of material and higher distance from the centre to the surface lead to a lower quench rate. This affirmation is sustained by a study of Cavazos and Colàs [29].
Although the water quench rates in this work are different from other studies [27], the results in hardness are comparable. This is because over a certain quench rate, mechanical properties are not more influenced by the quench rate, as it is reported in many studies [20,25,27]. After these considerations, it is possible to affirm that some result in this work, like ones about quench in 60 °C and 100 °C water, are comparable with the ones existing in literature, although the quench rates were different.
In Figure 3.4 it is reported the result for each quench media. For example, using 60 °C water as quench media, a quench rate of 260 °C/s was obtained. In this condition it is very easy to obtain a supersaturated solution, which lead to a higher hardness after ageing treatment (for more details, see Section 2.2). Some differences in the shapes of the temperature curves can be noted. In 60 °C (see Figure 3.4) and 100 °C water quenches, the decrease in temperature is quite linear. In Appendix 3, logged temperatures for quenches in 100 °C water and furnace are reported. In Appendix 3,
calculated quench rates for quench in sand and insulation material are also reported (with the equations for integral average quench rate calculation).
y = -262.67x + 461.98 R2 = 0.996 0 50 100 150 200 250 300 350 400 450 500 0 0.2 0.4 0.6 0.8 1 1.2 Time [sec] T e mp erat ure [ °C ]
Figure 3.4. Logged temperature for 60 °C water quench
About the quench rate in sand quenching, some consideration could be done. As difference from the water quenching, in this case the diminution of temperature is not linear with the time. This fact is justifiable by some considerations about the quench media. With the progress of the test, the heat leaves the samples and goes to the sand, which raises its temperature. In this way the sand temperature increases and this leads to a smaller difference in temperature between the sand and the sample. On account of that, calculating the quench rate in the range from 450 °C to 200 °C and reporting the results in a semi-logarithmic graph, it was possible to notice that the quench rate decrease in a logarithmic way. The relationship between time and temperature in very closely in the range considered. The quench rate in this case is not constant, as it was in the case of water quench; so the value reported in Table 3.2 is an integral average quench rate value in the range considered. Using a simple arithmetic average, the resulting quench rate was 2.7 °C/s, very closed to the value calculated by using integral average quench rate (3 °C/s).
About the quench rate in insulation material quenching, an operative way to proceed similar to the one used in sand quench was used. The temperature was logged and after an average quench rate was calculated. Also in this case, it was not possible find a constant quench rate, because the insulation material around the sample raises its temperature, by the heat removed from the sample. So it was necessary to log the temperature, calculate the quench rate for each data and calculate an integral average in the range from 450 °C to 200 °C. In this way it was possible to obtain the quench rate reported in Table 3.2. Using a simple arithmetic average, the resulting quench rate was 0.6 °C/s, very closed to the value calculated by using integral average quench rate (0.5 °C/s). About the case of quench in furnace, it was calculated only an arithmetic average quench rate.
3.4 Heat treatment
The T6 heat treatment is composed of three different steps, as reported before: solution heat treatment, quench and artificial ageing.
3.4.1 Solution heat treatment
Two different solution temperature were used, in order to check the influence of this parameter on the final hardness properties. All the samples were treated at 530 °C; only the samples that were subsequently quenched in 60 °C water was used also a temperature of 550 °C. The samples were treated in different sets, depending from the subsequent quench treatment. The number of samples for sets varied from 2 to 5; it was checked that in this range, the furnace temperature remained stable enough to ensure an optimal treatment condition. As reported in norms and manuals, the time between the furnace and the quench media has to be brief enough to avoid decreasing in temperature, because this could lead to microstructure modifications before the quench. So it was necessary to divide the samples in sets which had to follow the same treatment. The samples were supported by special supports which avoided the direct contact between the samples and the heating element. The support leaded also to a better moving of the samples. Each support contained samples destined to the same quench treatment. The time inside the furnace was 3 hours and 15 minutes (as reported in the previous chapter) and it was the same for all the samples. Theoretically, for the samples treated at 550 °C, the treatment time could be shorter;
by the way, for more security, it was decided to use the same time for all the condition. A higher solution temperature could lead to the melting of some element present in to the alloy. This fact can influence mechanical properties like the Ultimate Tensile Strength or the Yield Strength; in case of hardness tests, as in this ones, the final properties are not influenced because the hardness test is a global test and it appraises the hardness on a zone surely bigger than that ones influenced from micro-melting. In case of micro-hardness tests, which is a local test, the results could be influenced by the melted zone.
3.4.2 Quench
After solution treatment, the samples were quenched in different ways. Five different quench medias were used: 60 °C water, boiling water, sand, insulation material and furnace. As reported before, the time between the removal from the furnace to the entry in the quench media has to be as short as possible, to avoid premature precipitation of particles. In this work, a time no longer than 3 second was passed between the opening of the furnace door and the completed immersion of the samples in the quench media. The initial temperature in the quench treatment was the same for all the samples, except for the samples solubilised at 550 °C. The final temperature was different in relation with the utilized quench media. Using boiling water, sand, insulation material and cooling in furnace, the samples were removed from the quench media at a temperature of 100 °C. Using 60 °C water, the samples were removed from the quench media after a time which allowed to arrive at more or less 100 °C. In case of quench in water, the samples remained in to the quench media for about 15 seconds for boiling water and 5 seconds for 60 °C water; this times were found during the quench rate checking. In case of quench in sand, insulation material and furnace, the samples temperature were checked by using a thermocouple fixed on a test sample: when the temperature arrived to 100 °C, the samples were removed from the quench media and they passes to the subsequent ageing treatment. For each quench media, the hardness value was measured just after quench, with the aim to check the influence of the only quench rate on the hardness properties.
3.4.3 Ageing treatment
This part of the work presented the higher number of variable parameters: temperature and time. More precisely, two different temperature and nine different treatment times were used. In this way it was possible to check the influence of time and temperature on the final hardness values. The used temperatures were 170 °C and 210 °C, the used times were different in relation to the quench condition. For more details, see Table 3.4. All the samples, after the ageing treatment, were removed from the ovens and they were cooled on a isolated plate; the time requested to arrive at room temperature was no longer than 5 minutes. After cooling, the samples were classified, grinded and polished for the subsequent hardness tests and microscopic analysis. For the samples aged less than 20 hours, the hardness tests were done just after cooling; for ageing time equal or higher than 20 hours, it was possible to postpone the hardness measurements, putting the samples in to a refrigerator to avoid possible micro-structural modifications. Nevertheless, in the last case, the hardness tests were done as soon as possible. From the combination of two different solution temperature, five different quench media, two different ageing temperature and various ageing times, a total of 56 samples were tested.
Table 3.4. Ageing temperatures and times (for designation, see Attachment 1, Section 8) Quench SHT temp. AA temp. AA Quench SHT temp. AA temp. AA media [°C] [°C] time media [°C] [°C] time
Water 60°C 530 170 0 Sand 530 210 0 10 min heat 1 h 5 min 5 h 20 min 20 h 1 h 50 h 2 h 110 h 5 h 220 h 20 h Water 60°C 550 170 0 100 h 10 min Furnace 530 170 0 1 h 10 min 5 h 1 h 20 h 5 h 50 h 20 h 110 h 50 h 220 h 110 h Water 100°C 530 170 0 220 h 10 min 530 170 0 1 h 10 min 5 h 1 h 20 h Insulation 5 h 50 h material 20 h 110 h 50 h 220 h 110 h Sand 530 170 0 220 h 10 min 1 h 5 h 20 h 50 h 110 h 220 h
3.5 Hardness measurements
After the artificial ageing treatment the samples were grinded to remove the superficial layer (probably due to a loss of Mg) which was formed during the previous heat treatments. The grinding also allows to obtain a planar surface, removing the distortions caused by the quench. The grinding followed a two steps way: first the samples were grinded by the use of a 600 sandpaper disk and then by the used of a 1200 sandpaper disk. In each step, water was used to avoid excessive heating of the samples and for a continuous cleaning of the sandpaper disks. Between the two steps and after the end of the second one, the samples were washed with water, clean with ethanol and dried by the use of an air dryer. After grinding, the hardness tests were made. Following the norms, Brinell test was utilized, with a test load of 40 Kgf, equivalent to 392.4 N, an application time of 10 seconds and a spherical penetrator with a radius of 20 mm. For each sample, three indentations were made in a intermediate zone between the centre of the sample and its edge. In this way it was possible to obtain an average hardness value. In fact, as reported in literature [29], the quench rate could be different moving from the centre to the edge of the sample. In this case, the sectional area of the sample was very small, so the difference between the hardness values could be negligible. The indentations were made as more equidistant as possible one from the other ones and from the edge of the sample (Figure 3.5). The indentations were then measured by using a computerized light microscope, which allowed to check the shape of the indentations and their sizes.
The norm EN 10003-1 [31] indicates that two diametrical perpendicular measurements are necessary to calculate the hardness value. In some case in this work the shape of the indentations was not perfectly circular and so, for more security, four measurements for each indentation were taken, three on the diameter and one on the circumference. With these four values, an average diameter for each indentation was calculated. The average of the average value of each indentation gave the final diameter value, subsequently used for the hardness calculation. For the calculation of the Brinell hardness value, Eq. 2 was used
3.6 Matrix and particles analysis
In this work, WDS detector was used in order to check the weight percentage of silicon and magnesium inside the dendrites. Six different samples were checked, the ones about the peak aged condition. Three different dendrites on each sample were selected, one near the edge of the sample, one in the centre and another between the previous ones. For each dendrite, five different measurements were taken, moving along the dendrite width (Figure 3.6). In this way it was possible to check the effect of the quench rate on the wt % of silicon and magnesium inside the dendrites.
EDS detector was used in order to check the chemical composition of single particles and phases inside the microstructure. In this way it was possible to understand how the solution treatment temperature and the quench rate influence the microstructure. The measurements were taken on the same side of the samples on which the hardness measurements were taken. So it was necessary to regrind the samples, in order to remove the indentation and to obtain a perfect finished surface for the WDS-EDS measurements. For the grinding, the same steps illustrated before were follow (see Section 3.5). After grinding, the samples were polished, following a two steps way. At the beginning the samples were polishing using a felt disk, on which a abrasive solution was deposited. The size of the abrasive particles was 3 μm. The samples were polished for 3 minutes at 150 rpm, with a contact pressure of 0.5 bar. Every 30 seconds, new abrasive solution was deposited on the felt disk. The second step was a new polishing by using a abrasive diamond compound, called OPS. In this step the samples were polished for 1 minute at 150 rpm, with a contact pressure of 0.5 bar. Every 10 seconds new diamond compound was distributed on the felt disk. Between the two steps and after the second one, the samples were washed with water, cleaned with ethanol and dried by using an air dryer.
![Table 2.3. American Aluminium Casting Alloys Designation [1]](https://thumb-eu.123doks.com/thumbv2/5dokorg/4652748.120975/9.918.275.642.142.284/table-american-aluminium-casting-alloys-designation.webp)
![Figure 2.1. Al – Si phase diagram [13]](https://thumb-eu.123doks.com/thumbv2/5dokorg/4652748.120975/10.918.272.641.722.1035/figure-al-si-phase-diagram.webp)
![Figure 2.2. Elements solubility as a function of the temperature [13]](https://thumb-eu.123doks.com/thumbv2/5dokorg/4652748.120975/14.918.337.576.382.574/figure-elements-solubility-function-temperature.webp)
![Figure 2.5. Strength as a function of the radius of second phase particle (a) [22] and hardness as function of ageing temperature and time (b)](https://thumb-eu.123doks.com/thumbv2/5dokorg/4652748.120975/18.918.178.752.106.337/figure-strength-function-radius-particle-hardness-function-temperature.webp)
![Figure 2.6. Minimum precipitation time as function of wt% Mg [2]](https://thumb-eu.123doks.com/thumbv2/5dokorg/4652748.120975/19.918.311.605.733.936/figure-minimum-precipitation-time-function-wt-mg.webp)
![Figure 2.7. Modelled Temperature-Time-Yield Strength curves for A356 [25]](https://thumb-eu.123doks.com/thumbv2/5dokorg/4652748.120975/20.918.259.661.222.577/figure-modelled-temperature-time-yield-strength-curves-a.webp)
![Figure 2.8. Yield Strength of A356 cast aluminium alloy in as-cast and heat treatment conditions subjected to various quench rates [27]](https://thumb-eu.123doks.com/thumbv2/5dokorg/4652748.120975/22.918.314.598.186.454/figure-yield-strength-aluminium-treatment-conditions-subjected-various.webp)