CULTIVATION OF MICROALGAE FOR POTENTIAL HEAVY METAL REDUCTION IN
A WASTEWATER TREATMENT PLANT
Krustok I, Nehrenheim E, Odlare M
School of Sustainable Development of Society and Technology, Mälardalen University, P.O. Box 883, SE-721 23 Västerås, Sweden, e-mail:ivo.krustok@mdh.se
ABSTRACT
Sorption capacity of microalgae in 10 different mixtures of wastewater and lake water was evaluated for their ability to reduce heavy metal concentrations in wastewater. Cu, Zn and Ba concentrations were mostly reduced whereas Al and As concentrations actually increased in some samples. Co and Ni concentrations were more reduced in samples with pure wastewater compared to samples with wastewater/lake water mixtures. Hence, a mixture of wastewater and lake water seemed to decrease the metal reduction process in the water. Finally, for Fe and Mn concentrations, there was no significant difference between samples with pure wastewater and wastewater/lake water mixture. In positive cases reduction of heavy metal concentrations in the samples with 50-70% of wastewater worked best.
Keywords: algae, wastewater treatment, heavy metal
reduction, biosorption
NOMENCLATURE
Abbreviation DS Dry Solid BT Biological treatment1.
INTRODUCTION
In the search for new substrates for biogas production, many different waste and waste water resources have been evaluated. The overall principle is applicable regardless of the nature of organic waste used: carbon and nutrients should be utilized for energy production rather than disposed, landfilled or discharged in the environment. Unutilized waste water streams also leads to an uncontrolled dispersion of valuable and limiting elements, especially metals and P. At the same time we face worldwide problems with eutrophication and pollution of inland water systems due to inadequate waste water treatment and release of these substances. Even though the concentrations in the outlet typically are low, the large amounts of water add up to a significant net discharge of e.g. phosphorous which is responsible for growth in fresh water systems. Moreover, toxic substances such as heavy
metals and pharmaceuticals are commonly occurring. The pollution and eutrophication is solved by chemical precipitation, which prevents the heavy metals in the inflow water to reach the outflow and as a consequence, most of the P and heavy metals are strongly bound in the wastewater sludge. This means that the availability of P, which could be valuable for the next treatment step – fermentation for biogas, is limited. Soluble metals are considered to be toxic and most heavy metals are toxic to biological processes, including anaerobic processes, aerobic processes and nitrification, at very low concentrations [1]. Therefore lowering the heavy metal content in the sludge would benefit the biological processes required in the treatment of wastewater and in the methane production.
Metals in the sludge also creates problems in further applications, since a high concentration of heavy metals may prevent safe usage of the sludge as fertilizer. It is unfortunate, since wastewater sludge and its products are rich in nutrients and could serve as a natural recycling step for nutrients if used as a fertilizer on arable land [2, 3]. However, the content of heavy metals as well as known or unknown organic pollutants has raised the question whether fertilization of sewage sludge on food crops is actually safe [4 - 6]. At present, the sludge is recommended to be used only on non-food crops, such as energy crops or garden plants.
Recent research has shown that the cultivation of algae [7] in waste water could be an effective way of recovering nutrients. In another study, about to be published [8] we have shown that biogas production from food waste is significantly improved by addition of algae. Both biogas production, accumulated biogas yield over 30 days and the content of methane was more than 20% higher with 11% dry solid (DS) addition of algae. This altogether speaks for algae as a potential substrate for waste water treatment and utilization as a biogas production substrate.
Cultivation of algae is cost-effective, since most algae survive on light, a carbon source and some nutrients to grow. Many have also suggested that algae effectively adsorb heavy metals and research on the biosorption of heavy metals by algae has shown promising results [9 - 11]. It is therefore of great interest to evaluate the combined potential for algae as a nutrient carrier and biosorbent for heavy metals.
The aim of the present study was to evaluate the potential of indigenous algae from Lake Mälaren to reduce the heavy metal content of the inflow water to the Västerås wastewater treatment plant. The specific objectives were to:
1. Study the growth of algae in different ratios of lake water and waste water.
2. Study the retention of heavy metals and nutrients throughout the algae cultivation process.
2.
MATERIALS AND METHODS
The wastewater treatment plant in Västerås has a conventional treatment process. The incoming wastewater is screened and then settled using iron sulphate to remove the phosphorus. Prior to the biological treatment (BT) step, an external carbon source is added. In this study, we used the inflowing water and the water that is pumped into the activated sludge basins.
Lake Mälaren is the third-largest lake in Sweden with an area of 1140 km² and its greatest depth is 64 m.
2.1 Sampling
The sampling was done in Lake Mälaren in Västerås and from the wastewater treatment plant in Västerås. The samples were taken in January. Even though samples were taken during the cold period a rise in temperature has been shown to induce an exponential increase in algal growth until optimum level is reached [12]. Because the lake was frozen a hole was drilled prior to the sampling.
The wastewater was sampled from two sampling points in the wastewater treatment plant in Västerås. Samples were taken from the treatment plant inflow and before the BT step.
All samples were taken with sterilised equipment according to SS/ISO 5667-3:2004 and the water was immediately used in the experiment with no preservation or storage.
2.2 Experimental setup
The experimental light and temperature conditions were manipulated in order to simulate conditions prevailing during the extreme algae growth during the summer.
The experiment was set up with 30 flasks each containing a total of 250 ml of lake water and wastewater mixture. The flasks were divided with respect to the containing wastewater (inflow and before the BT). The wastewater was mixed with the lake water using the proportions presented in table 1. The flasks were placed in a climate chamber with automatic light and temperature regulation using a protocol of 12 h of light and 12 h of dark per 24 h at 23±0.5°C. These were found to be the optimum cultivation conditions by [13].
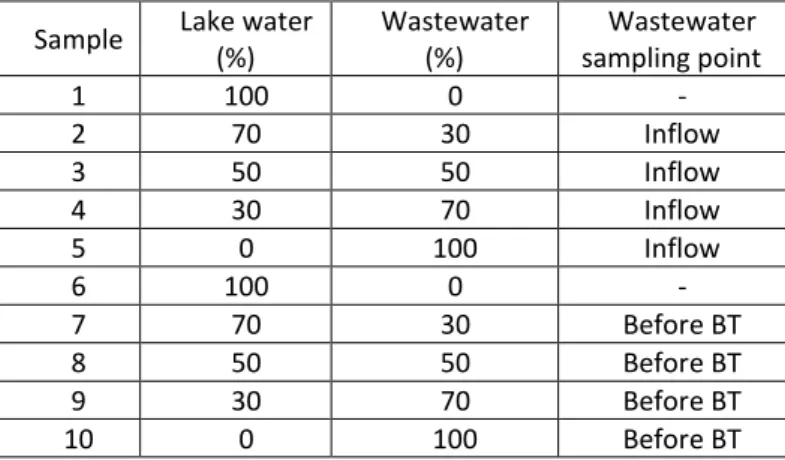
Table 1 The proportions of lake water and waste water in the mixed samples
Sample Lake water (%) Wastewater (%) Wastewater sampling point 1 100 0 - 2 70 30 Inflow 3 50 50 Inflow 4 30 70 Inflow 5 0 100 Inflow 6 100 0 - 7 70 30 Before BT 8 50 50 Before BT 9 30 70 Before BT 10 0 100 Before BT
2.3 Heavy metal and nutrient concentration in
the samples
The samples were left in the cultivation chamber for 16 days. Heavy metal concentrations were measured in every sample at the start and at the end of the experiment. The uptake of heavy metals by the algae was calculated by the difference of heavy metals in the samples after the beginning of the experiment assuming all the heavy metals removed from the water were taken up by the algae. To assure that we are only measuring algae uptake all the sampled were filtrated before measurement.
As additional information the ammonium, nitrate, nitrite and total phosphorous concentrations were measured in the samples. The measurements were made by the ALS Scandinavia laboratory. Optical density at 630 nm and pH were also measured during the experiment.
3.
RESULTS AND DISCUSSION
3.1 Growth by optical density.
The optical density of the samples changed over time as expected. Because some of the samples had more wastewater than the others, they started from a higher OD value. The high concentration of wastewater also may have interfered with measuring algae growth which could explain the sudden drops in OD as displayed in figure 1.
Figure 1 Optical density measurements of the samples at 630 nm (days from the start of the experiment)
The pH values measured during the experiment remained mostly stable with just some moderate changes near the end of the experiment. The average pH values measured during the experiment are in table 2.
Table 2 Average pH values of samples measured during the experiment
1 2 3 4 5 6 7 8 9 10
5.83 6.04 6.19 6.43 6.74 7.27 6.94 6.95 6.96 7.03
3.2 Metal concentrations
Metal concentrations measured prior to the experiment are in table 3. Strangely, concentrations of several of the heavy metals, e.g. Zn, Cu, Ni and As, were significantly higher in the sampling before BT than in the inlet to the waste water treatment plant. This could have several explanations. The metals are usually bound to the organic compounds when they enter the plant. Once they have entered the plant mechanical processes may cause a break-up of the particles leading to release of metal ions. Alternatively, microbes (such as protozoa and bacteria) feed on the organic material. After the initial step in the treatment plants these microbes probably dies which leads to a release of metal ions.
Metal concentrations measured after the experiment are in table 5. The decrease of Fe in was highest in mixture 7 (94.6%). That seemed to be the only mixture that had an advantage over pure wastewater. Al actually had a significant increase (18.7-542.5%) during the experiment in the mixtures with inflow wastewater. With the wastewater taken before the biological step however there was a decrease and the best results were with mixtures 8 (71.8%) and 9 (72.3%). As was below the detection limit in mixtures
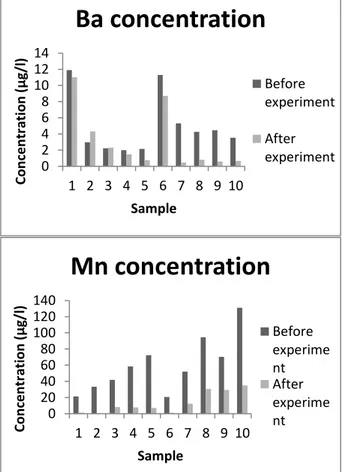
1-4 and 6 prior to the experiment. After the experiment mixtures 7-10 actually had a significant increase in concentration (17.7-135.4%). The highest reduction in Ba concentration was measured in mixture 7 (91.2%) (Figure 2). There was an increase in concentration in mixtures 2 and 3 however. Reduction of Co was highest in both wastewater cases in the wastewater itself. The same can be said about Ni. Cu was reduced to under the detection limits in most cases as was the case with Zn. In the case of Mn mixing the wastewater with lake water did seem to have some positive effect but not much (Figure 2).
OD measurements did not imply any toxic effect to the algae in any of the flasks in the experiment. In contrary, there was a growth of algae in the waste waters with highest heavy metal concentrations (sample 7-10).
Figure 2 Ba and Mn concentrations (µg/l) before and after the experiment
3.3
Nutrient concentrations
The nutrient concentrations measured prior to the experiment are in table 4. The concentration of P is interesting, firstly because it varies throughout the experiment and secondly because it can be considered as the limiting nutrients in the system since many of the algae potentially could retain N from the air. According to recent studies, ammonia has been found toxic to algae such as the green algae Clorella sp.
0.00 0.05 0.10 0.15 0.20 0.25 0.30 0.35 0 5 10 15 Op tical D e n si ty Day 1 2 3 4 5 0.00 0.20 0.40 0.60 0.80 1.00 1.20 0 5 10 15 Op tical D e n si ty Day 6 7 8 9 10 0 2 4 6 8 10 12 14 1 2 3 4 5 6 7 8 9 10 Co n ce n tr ation (µ g/ l) Sample
Ba concentration
Before experiment After experiment 0 20 40 60 80 100 120 140 1 2 3 4 5 6 7 8 9 10 Co n ce n tr ation (µ g/ l) SampleMn concentration
Before experime nt After experime ntThe nutrient concentrations measured prior to the experiment are in table 6. In mixtures 2-4 nitrite had a very high increase (421.4-4568.5%). The other samples remained under the detection limits. There was little change in nitrate concentrations as well. With total-P there was an increase with samples 1-2 and 4-6 (3.1-26.1%) but a
significant increase in samples 3 and 7-10 (96.1 – 344.1%). A similar pattern emerges with ammonium where the concentration in the mixtures with inflow wastewater was decreased (41.8-95%) and in the mixtures with wastewater before the BT step was highly increased (606-851%).
Table 3 Metal concentrations measured prior to the experiment. Samples 1-5 are lakewater mixed with inflow water and 6-10 are lake water mixed with wastewater before biological treatment
Element Sample 1 2 3 4 5 6 7 8 9 10 Fe mg/l 0.10 0.07 0.09 0.28 0.54 0.10 1.41 4.85 3.02 3.93 Al µg/l 31.60 30.60 24.40 13.10 12.70 28.70 38.20 34.20 35.60 22.80 As µg/l <1 <1 <1 <1 1.09 <1 1.6 3.22 2.29 4.99 Ba µg/l 11.90 2.99 2.23 2.01 2.16 11.30 5.32 4.28 4.47 3.54 Cd µg/l 0.14 <0.05 <0.05 <0.05 <0.05 <0.05 <0.05 <0.05 <0.05 <0.05 Co µg/l 0.23 0.81 1.25 1.77 2.66 0.10 1.46 3.08 2.46 4.70 Cu µg/l 4.90 4.46 4.54 4.19 3.55 5.31 8.67 8.40 7.44 10.20 Mn µg/l 21.30 33.40 41.80 58.60 72.40 20.60 52.00 94.50 70.30 131.00 Ni µg/l 2.84 3.93 5.00 6.21 6.43 2.15 5.22 10.30 8.62 16.00 Zn µg/l 7.45 7.39 7.95 10.50 14.10 8.46 13.50 20.70 20.90 20.10
Table 4 Nutrient concentrations measured prior to the experiment. Samples 1-5 are lakewater mixed with inflow water and 6-10 are lake water mixed with wastewater before biological treatment
Element Sample 1 2 3 4 5 6 7 8 9 10
Nitrite mg/l <0.040 0.10 0.19 0.18 <0.080 <0.040 <0.040 <0.040 <0.040 <0.040 Nitrate mg/l 3.60 3.80 <2.00 <2.00 <2.00 3.75 <2.00 <2.00 <2.00 <2.00
Total P mg/l 0.05 4.52 3.87 6.10 29.70 0.05 13.20 14.20 17.90 41.60
Ammonium mg/l 0.11 16.30 33.50 39.60 51.20 0.11 4.69 9.32 14.40 22.60
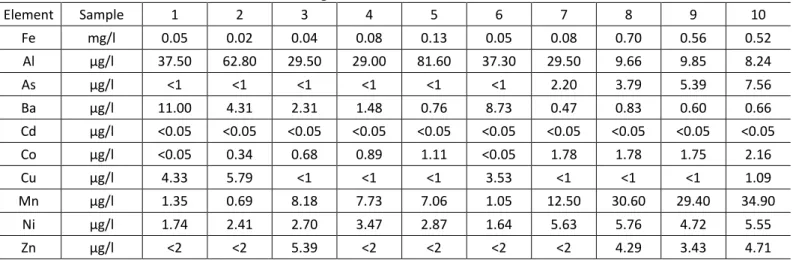
Table 5 Metal concentrations measured after the experiment. Samples 1-5 are lakewater mixed with inflow water and 6-10 are lake water mixed with wastewater before biological treatment
Element Sample 1 2 3 4 5 6 7 8 9 10 Fe mg/l 0.05 0.02 0.04 0.08 0.13 0.05 0.08 0.70 0.56 0.52 Al µg/l 37.50 62.80 29.50 29.00 81.60 37.30 29.50 9.66 9.85 8.24 As µg/l <1 <1 <1 <1 <1 <1 2.20 3.79 5.39 7.56 Ba µg/l 11.00 4.31 2.31 1.48 0.76 8.73 0.47 0.83 0.60 0.66 Cd µg/l <0.05 <0.05 <0.05 <0.05 <0.05 <0.05 <0.05 <0.05 <0.05 <0.05 Co µg/l <0.05 0.34 0.68 0.89 1.11 <0.05 1.78 1.78 1.75 2.16 Cu µg/l 4.33 5.79 <1 <1 <1 3.53 <1 <1 <1 1.09 Mn µg/l 1.35 0.69 8.18 7.73 7.06 1.05 12.50 30.60 29.40 34.90 Ni µg/l 1.74 2.41 2.70 3.47 2.87 1.64 5.63 5.76 4.72 5.55 Zn µg/l <2 <2 5.39 <2 <2 <2 <2 4.29 3.43 4.71
Table 6 Nutrient concentrations measured after the experiment. Samples 1-5 are lakewater mixed with inflow water and 6-10 are lake water mixed with wastewater before biological treatment
Element Sample 1 2 3 4 5 6 7 8 9 10
Nitrite mg/l <0.040 0.51 3.39 8.59 6.19 <0.040 <0.040 <0.080 <0.080 <0.200 Nitrate mg/l <2.00 7.19 3.38 <2.00 <2.00 <2.00 <2.00 <2.00 <2.00 <2.00
Total P mg/l 0.042 3.34 7.59 5.91 26.10 0.04 33.50 36.00 79.50 94.50
Ammonium mg/l <0.050 0.82 8.49 13.10 29.80 <0.050 44.60 65.80 112.00 167.00
The growth of algae, in the start-up phase in mixtures of winter lake water and wastewater, requires long time to be established. It appears as if the microbiological community is very complex during the first days and that it takes some time for the algae culture to take over. The colour of the wastewater throughout the experiment is very dark which explains the OD-measurements below, i.e. that is not a valid way of measuring the algae growth, taken into account the other organic material in the flasks (Figure 3).
Figure 3 The transformations of the water in the variants of compositions throughout two weeks experiments
4. CONCLUSIONS
The aim of this work was to see if a suitable mixture of lake water and wastewater would increase the heavy metal removal from the wastewater by algae. After 16 days there was apparent growth in all the mixtures. As expected, there was more growth in the samples where wastewater was added to lake water. There is a considerable amount of nutrients available in the wastewater compared to just the lake water (see table 4). If there was a reduction of heavy metal concentrations the samples with 50-70% of wastewater worked best.
The method worked to reduce Cu, Zn and Ba concentrations. In the case of Al there was a reduction in the samples where the lake water was mixed with the
wastewater before BT. With other metals however there was either no benefit in adding the lake water to the mixture or it made matters worse.
As for nutrients ammonium and total-P had a similar pattern where the concentrations in the mixtures with inflow wastewater were decreased and in the mixtures with wastewater before the BT step were increased.
REFERENCE
[1] Wong MH, Cheung YH. Gas production and digestion efficiency of sewage sludge containing elevated toxic metals. Bioresource Technol 1995;54(3):261-268.
[2] Uysal A, Yilmazel D, Demirer GN. The determination of fertilizer quality of the formed struvite from effluent of a sewage sludge anaerobic digester. J Hazard Mater 2010;181(1–3):248–254.
[3] Hossain MK, Strezov V, Chan KY, Nelson PF. Agronomic properties of wastewater sludge biochar and bioavailability of metals in production of cherry tomato (Lycopersicon esculentum). Chemosphere 2010;78(9):1167-1171.
[4] Muchuweti M, Birkett JW, Chinyanga E, Zvauya R, Scrimshaw MD, Lester JN. Heavy metal content of vegetables irrigated with mixtures of wastewater and sewage sludge in Zimbabwe: Implications for human health. Agr Ecosyst Environ 2006;112(1):41-48.
[5] Khan S, Cao Q, Zheng YM, Huang YZ, Zhu YG. Health risks of heavy metals in contaminated soils and food crops irrigated with wastewater in Beijing, China. Environ Pollut 2008;152(3):686-692.
[6] Nabulo G, Black CR, Young SD. Trace metal uptake by tropical vegetables grown on soil amended with urban sewage sludge. Environ Pollut 2011;159(2):368-376
[7] Odlare M, Nehrenheim E, Ribe V. Cultivation of algae with indigenous species - Potentials for regional biofuel production. Appl Energ 2011;88(10):3280-3285.
[8] Nehrenheim E, Odlare, M, Liu X, Li S. Co-digestion of cultivated microalgae and food waste. Submitted to Appl Energ 2012.
[9] Dönmez GÇ, Aksu Z, Öztürk A, Kutsal T. A comparative study on heavy metal biosorption characteristics of some algae. Process Biochem 1999;34(9):885-892.
[10] Sheekh MM, Shouny WA, Osman MEH, El-Gammal EWE. Growth and heavy metals removal efficiency of Nostoc muscorum and Anabaena subcylindrica in sewage
and industrial wastewater effluents. Environ Toxicol Phar 2005;19(2):357-365.
[11] Romera E, González F, Ballester A, Blázquez ML, Muñoz JA. Comparative study of biosorption of heavy metals using different types of algae. Bioresource Technol 2007;98(17):3344-3353.
[12] Singh NK, Dhar DW. Microalgae as second generation biofuel. A review. Agron Sustain Dev 2011;31:605-629.
[13] Tang H, Chen M, Garcia MED, Abunasser N, Simon Ng KY, Salley SO. Culture of Microalgae Chlorella minutissima for Biodiesel Feedstock Production. Biotechnol Bioeng 2011;108(10):2280-2287.