Main field of study – Criminology Two-year master program 30 credits
Spring 2017
Supervisor: Manne Gerell
Hot Spots of Robberies in the City
of Malmö
A Qualitative Study of Five Hot Spots, Using the
Routine Activity Theory, and Crime Pattern Theory
ABSTRACT
Studies about hot spots of crimes have found that crimes are clustered; few places have many crimes. There is a consensus among criminologists that opportunities for crimes are important when explaining hot spots, at some places, there are more opportunities than at other places. The same applies for hot spots of robberies. Most studies done on the subject are quantitative, relatively little is done using a qualitative approach. Furthermore, little research is done in a Swedish or
Scandinavian context. To fill these research gaps this study use participant observations to research five hot spots of robberies in Malmö. The research will try to answer which characteristics are important to explain why the places are hot spots and what the similarities and differences there between the places are. This will be analyzed using the Routine Activity Theory and the Crime Pattern Theory. The findings suggest that place-specific things are important to explain why the places are hot spots, but when using the theories several places are similar.
Keywords: Hot spots, Robberies, Routine Activity Theory, Crime Pattern Theory, Place-specific things
TABLE OF CONTENT
1. Introduction ... 1
1.1 Content of the Thesis ... 1
2. Previous research ... 2
2.1 Hot Spots of Crime ... 2
2.2 Situational Crime Prevention ... 3
2.3 Hot Spots and Robberies ... 3
2.4 Qualitative Studies About Hot Spots ... 5
2.5 Swedish Studies About Hot Spots ... 6
2.6 The Relevance of This Study ... 6
3. Aim and Research Questions ... 7
4. Theory ... 8
4.1 The Routine Activity Theory ... 8
4.2 The Crime Pattern Theory ... 9
5. Method ... 10
5.1 Participant Observation- Advantages and Disadvantages ... 10
5.2 Data Collection ... 12
5.2.1 Problem with the Data ... 12
5.3 Use of Theories in the Observations ... 13
5.4 How the Observations Were Done ... 15
5.4.1 Tallriken ... 16
5.4.2 Nydala Square ... 16
5.4.3 Nydala Bike Path ... 16
5.4.4 Lorensborg ... 17
5.4.5 Amiral Street ... 17
5.5 Analysis of the Material ... 17
5.6 Ethical Considerations ... 18
6. Result and Analysis ... 18
6.1 The Characteristics of the Five Places ... 18
6.1.1 Tallriken ... 19
6.1.2 Nydala square ... 20
6.1.3 Nydala Bike Path ... 23
6.1.4 Lorensborg ... 25
6.1.5 Amiral Street ... 26
6.2 Similarities and Differences Between the Five Places ... 28
6.2.1 Similarities ... 28
7. Discussion ... 30
7.1 The Importance of Suitable Victims and Capable Guardians ... 30
7.2 Place-Specific Things ... 31
7.3 Solutions to the Problems ... 32
7.4 Are the places hot spots? ... 33
8. Conclusion ... 34
8.1 Limitations ... 35
References ... 37
Annex 1 - Field Notes ... 40
Annex 2 - Checklist ... 44
1
1. INTRODUCTION
Hot spots of crime are small places where a proportionally substantial number of crimes are committed. Since the 1980s it has been a popular topic within
criminology (Weisburd, et al., 2014). Hot spots can be narrowed down to a street corner or an address, so called micro places; a whole neighborhood is seldom criminogenic (Weisburd, 2015). Hot spots of robberies have the same
characteristics as crimes in general; few micro places have a proportionally large amount of robberies. To explain why it is this way, opportunities for crimes are a key factor. At some places, there are more opportunities to commit robberies than at other places (Braga, et al., 2011). Most studies done are quantitative which means that researchers try to map and generalize findings of the hot spots, usually to explain citywide trends. This means that researchers seldom visit the places they research (Braga & Weisburd, 2010; Vito, et al., 2014). Instead of a
generalization, qualitative research can provide in-depth research and find place-specific attributes (St Jean, 2007). Because of the relatively few qualitative studies about hot spots, there is currently a research gap within this field. Besides, most research has been done in the American society, relatively little has been done in a Swedish or Scandinavian context. Thus, there is also a research gap in that
context.
To fill this research gap, this thesis is qualitative with the use of participant observation as the method. Five hot spots of robberies outside the city center in Malmö (Tallriken, Nydala Square, Nydala Bike Path, Lorensborg and Amiral Street (Annex 1)) were visited, to research which characteristics could explain why the places were hot spots for robberies and what similarities and differences there were between the places. The point of the observations was to research the everyday movement, not to witness any crimes. Each place was visited and observed two to three times with two to three hours observation each time. The places were analyzed using the Routine Activity Theory and the Crime Pattern Theory. First in the form of a checklist (Annex 2) of what to look for in the observations and then as a tool to do an analysis of the findings.
1.1 Content of the Thesis
The thesis will start with Previous Research, which will be a presentation of previous research, both of hot spots of crime in general and hot spots of robberies. There will also be a presentation of the lack of qualitative and Swedish studies done, which will lead to the relevance of this thesis. Next, the Aim and research
questions will be presented. The heading after that is Theory, where the theoretical
concepts of the Routine Activity Theory and the Crime Pattern Theory will be shortly explained. In the section Method, there will be a presentation of participant observations, why the method was chosen in this thesis, how data was collected, how the theories were used in the observations and the analysis and detailed information about how the participant observations were done at each place. In the heading, Result, and Analysis the results will be presented and discussed. Because of the qualitative aspect of the thesis, the result and analysis will be integrated with each other. After that, the result will be discussed in the heading
2
2. PREVIOUS RESEARCH
There have been many studies done about hot spots of crime and hot spots of robberies. However, there is relatively few qualitative studies or studies done in a Swedish context. In this section, previous research will be presented. The subject will be narrowed down and lead to the aim and research questions of the thesis.
2.1 Hot Spots of Crime
Most studies, within the field of criminology, are person focused, while relatively little research has been done about crime and places. However, since the late 1980s, crime and place have become a popular topic of studies and several studies show that most crimes occur at few places in a city. To reduce crime it is,
therefore, important to analyze those places (Weisburd, et al., 2014). An important aspect of hot spots is that, according to research, crimes are often found at micro places; you can often narrow it down to an address or a street corner (Weisburd, 2015). Sherman et al. (1989) performed a study where they found that 3,5 percent of the addresses in Minneapolis accounted for 50 percent of all emergency calls during a year. Another researcher, Spelman (1995), also conducted a study on emergency calls. He found that the 10 worst locations accounted for 50 percent of all emergency calls. Hot spots of crimes also seem to be stable over time
(Weisburd, 2015). Weisburd et al. (2004) did a study about hot spots in Seattle between 1989 and 2002. They found that 50 percent of all crimes were committed at 4,5 percent of the micro places. The findings propose that it is better to focus on small places to prevent crime, instead of entire neighborhoods or areas. Even though it is popular to cluster crime on a neighborhood level, the whole neighborhood or area is rarely criminogenic; most places in high-crime neighborhoods have no or very little crimes (Herrmann, 2015). There are also other disadvantages of studying entire neighborhoods. Social boundaries that go beyond the administrative boundaries could exist, which means there could be boundaries within neighborhoods and people from different neighborhoods might belong together. Studies of micro places do not have this problem. Also,
interventions to reduce crime applied on a neighborhood level will include the area that has no or little crime. Resources that is needed on high crime places are then redirected to other places. This means, that with a focus on micro places it is possible to identify most of the criminal activities and focus intervention at places where crime happens (Gerell, 2016).
Studies of hot spots have led to improvement in crime control policies. There is now an understanding of how certain places attracts criminals and how certain settings increases the risk for people to become victims. This means that the police can map certain places and target them. Also, by changing the
characteristics of these places crimes can be prevented, often without
displacement of criminal activities (Braga & Weisburd, 2010; Weisburd, et al., 2006). The biggest affect the analysis of hot spots has provided is the change in police work. Instead of randomly patrolling the streets, the police have in many countries changed tactics to focus on high-crime places (Braga & Weisburd, 2010). This is a change to a preventive, rather than a reactive approach to crime (ibid). Many studies have offered evidence that hot spot policing is effective. The
3 research of hot spots has also provided an understanding of how other
stakeholders, than the police, can reduce crime. It is, for example, possible to build obstacles at hot spots, install surveillance cameras, or remove abandoned houses, that usually are hot spots for drug sales (Clarke, 1997). The idea of hot spots of crime is closely linked to the Routine Activity Theory (Cohen & Felson, 1979) which will be discussed further in the theory section of this thesis. The assumption is that crime is strongly related to situational factors. Nightclubs, for example, attracts a lot of intoxicated people. They are therefore more exposed to violence there than at other places. There is also an assumption that it is easier to prevent situational factors, rather than individual or social factors, since
situational factors could be dealt with faster (Granath, 2014).
2.2 Situational Crime Prevention
Situational crime prevention focuses on opportunities of crimes. The focus is on reducing crime at the place rather than reducing the risk for the offender (Clarke, 1997). As Clarke (1997, p. 2) says:
“Proceeding from an analysis of the circumstances giving rise to specific kinds of crime, it introduces discrete managerial and environmental change to reduce the opportunity for those crimes to occur. Thus it is focused on the settings for crime, rather than upon those committing criminal acts. It seeks to forestall the occurrence of crime, rather than to detect and sanction offenders. It seeks not to eliminate criminal or delinquent tendencies through improvement of society or its institutions, but merely to make criminal action less attractive to offenders.”
The most known situational crime prevention is the security design in houses; by making property harder to steal, more secure locks, better doors, and windows in houses and camera surveillance at parking lots, the property is harder to steal and the risk of being detected increase. This has been proven an effective way to reduce burglaries (Waller, 2014).
There are diverse ways to reduce opportunities for crimes. It is dependent on the type of crime, the situation, the potential victim, and the place (Clarke, 1997). Clarke (1997) have listed 16 opportunity-reducing techniques that could be used to reduce crime at individual places. Understanding why crime happens in a place is, therefore, the key to doing something about the problem (Braga, et al., 2011). When you understand why some places are hot spots of certain crimes, you can start with finding techniques to reduce problems at these places. It is also a good thing that you can exclude some interventions, which would be a waste of time and money (Waller, 2014). An interesting aspect of situational crime prevention of hot spots is that evidence shows that there is little or no displacement of crimes, even if that is expected (Weisburd, et al., 2006). The most common hot spot interventions often involve the police, but there are other solutions involving other partners which have proven to be effective (Braga & Weisburd, 2010; Waller, 2014)
2.3 Hot Spots and Robberies
Robbery is a violent crime which is economically motivated. It can vary from attacks on individuals to larger bank robberies, but there is always an economic
4 loss for the victim (Braga, et al., 2011). Robbery is a crime that spread fear and affects people. As Braga et al. (2011, p. 8) say:
“Robbery is particularly fear-inspiring, as it usually involves an unprovoked attack by strangers that includes bodily harm or the threat thereof. The threat of robbery victimization has far-reaching effects on urban life through its influences on choices for residents and visitors about where to live, work, shop, and go out to dinner”
The crime is most common in cities and the most common robbery is when one or several people attack a single person. This is because there are more people on a smaller surface in cities. Also, an offender is more likely to be relatively
anonymous there (Braga, et al., 2011). In a Swedish setting, the situation is the same. In 2015, 8360 robberies were reported to the police, 69 percent were classed as muggings or personal robberies. Of the muggings, 81 percent were reported in public places and the robber had for the most part been unknown to the victim (BRÅ, n.d).
Hot spots of robberies have the same pattern as general crime trends; few micro places accounts for most of the robberies (Braga, et al., 2011). Sherman et al. (1989) found that almost all robberies reported to the police, happened at 2,2 percent of the street addresses in Minneapolis, and Braga et al. (2011, p. 9) found that “In fact, roughly 8 percent of street segments and intersections in Boston are responsible for nearly 66 percent of street robbery incidents between 1980 and 2008 even when controlling for prior levels of robbery and existing trends.”
There is a consensus among criminologists that opportunity is a key factor to explain hot spots of robberies; the place must provide offenders with an
opportunity to rob victims without getting too much attention. This explains why hot spot policing projects has been regarded successful; it has decreased
opportunities at hot spots by increasing surveillance at these places. To explain why some places are hot spots while others are not, scientists have looked at and tried to find risk, and protective factors. The risk and protective factors can be the places themselves, but also the people who spend the time at these places (Braga, et al., 2011; Braga & Weisburd, 2010; Weisburd, et al., 2014). The risk-reward aspect in robberies seems to be important. Places must be visited by victims with things to steal (preferably money), and offenders must know they can find victims there. Also, the best places of robberies are places where it is difficult to get caught or supervised since the offender often rob people who they do not know. This makes some places more ideal for robberies than others and the result is a clustering of robberies at some places (Braga, et al., 2011). By interviewing offenders, researchers have found that they rarely plan their robbery carefully, rather, they go to places where they know that people carrying valuables will be (Bernasco & Block, 2009; Feeney, 2014; St Jean, 2007). Feeney (2014) did research on 113 offenders, who were charged with robbery. He found that fewer than 60 percent wanted money when they robbed the rest desired other things, such as thrills. St Jean (2007) also found in his study, that robbers rarely carefully plan who to attack, but instead go to places where they know they can find victims and where they can be relatively anonymous. This implies that certain places are better than others to commit robberies at. When offenders find a place suitable for robbery, they might return to that place many times. Other offenders might also get information about the place and start committing offenses there. Thus, making it a hot spot for crime (Bernasco & Block, 2009; St Jean, 2007). The choice of
5 places is also linked to the temporal variation. “Great places for robbery in the morning may be pretty useless places at night” (Bernasco & Block, 2009, p. 122). This makes it important to consider when the offenses are taking place when studying places of crime (Bernasco & Block, 2009).
2.4 Qualitative Studies About Hot Spots
Studies about hot spots of crimes tend to be quantitative, using official data to draw conclusions (St Jean, 2007). The studies mentioned above such as Braga et al. (2011), Sherman et al. (1989), Spelman (1995), and Weisburd et al. (2004) have all used quantitative approaches to answer their research questions. This is in line with criminology in general. Only about five to ten percent of published articles in journals have a qualitative approach to them (Copes, et al., 2016). The vast quantitative data have provided knowledge about micro-places, and that most crimes in cities are committed there. This kind of research has been reproduced and used in many cities and the conclusion is that the situation is the same in all cities (Braga, et al., 2011). To understand why some places are hot spots for crimes, studies have found that opportunities for crimes important. Quantitative studies most often use crime data to find the right places, thereafter they use what is known about why offenders choose the places and theories, to explain why those places are hot spots of crimes. The analysis of the studies can be that
situational features or movement of persons can explain why certain places are hot spots (Braga & Clarke, 2014). These are valid research methods, but the purpose of the quantitative approach to research is to generalize the results to a larger setting. (Vito, et al., 2014). “Qualitative research seeks indepth, detailed information which, though not always completely generalizable, allows for a deeper understanding of those specific persons/events from whom data is collected.” (Vito, et al., 2014, p. 172). For research of hot spots of crimes, this means that researchers often do not visit the places they study. Mostly they try to map places and generalize why they are hot spots based on theory or general features, both situational and social (Braga & Clarke, 2014). When using a qualitative approach, it is possible to explain why a certain place is a hot spot, by visiting the place, and why offenders choose certain places, by interviewing them. There could be features of a place that is not visible on a map, which could
explain why offenders are drawn to the place or why it is not supervised. With the relatively few qualitative studies of hot spots of crimes, there is, therefore, a research gap of in-depth analyses of these places (St Jean, 2007).
Despite the relatively small number of qualitative studies, there are some studies produced. One example of a study that tries to answer why certain places are hot spots, is a study done by Kooi (2015). When he found that three bus stops in a city handled much of the crime and disorder, observations were done to answer why these places were hot spots. Because of the observations, he could analyze both the physical attributes of the bus stops as well as what kind of people were hanging around at these places. By these analyses, he could discuss and suggest place specific, instead of general solutions to the problems. St Jean (2007) did a study of hot spots of crimes when he spent four years in disadvantaged
neighborhoods in Chicago, interviewing and observing people and places. He observed hot spots of drug dealing, violence and robberies and interviewed offenders about why they chose certain places to commit crimes. The conclusion of the study was that the theories of broken windows and collective efficacy could be used to explain why some places had more crime than others. Weisburd et al.
6 (2006) conducted a qualitative study to find if crime prevention initiatives
displace crime or not. By doing interviews and observations they found that there was no displacement of crimes in the areas researched. A pattern of qualitative studies is to depart from theoretical perspectives to look for certain aspects which can be explained (St Jean, 2007; Weisburd, et al., 2006). In general, qualitative studies of hot spots have contributed to our understanding of why certain places are hot spots for crime, although they have also been able to view things from the offenders’ perspective and see why they choose certain places (St Jean, 2007).
2.5 Swedish Studies About Hot Spots
Although there is a scarce amount of research done on this topic, even less has been done in a Swedish or Scandinavian context. There are however some evaluations of interventions at hot spot places. Examples of evaluations are one study about CCTV in the Stockholm subway system, that showed a decrease in planned crime after the CCTV was introduced (Priks, 2015) and two types of initiatives to direct police, security guards, or volunteers to hot spot areas to prevent crime (Frogner, et al., 2013; Østergaard Larsen, et al., 2015). A common theme in these studies was that the hot spots covered larger areas than micro places and the interventions in the studies were regarded as having no effect (ibid). One study that analyzed hot spots of crimes was Uittenbogaard and Ceccatos (2014) study. The authors analyzed why some subway stations in Stockholm had more crime than other stations. By looking at several types of crimes, such as vandalism, violence, and property crime, they analyzed the characteristics at the stations with a higher number of these crimes. They also made suggestions for interventions to prevent these crimes. The study is, however, quantitative which means that they looked for general characteristics, rather than detailed.
2.6 The Relevance of This Study
This study will be qualitative, where five micro places which are hot spots of robberies will be researched. By doing observations it will be possible to describe the places and the people who spend time there. The findings will contribute to the relatively little qualitative research that has been done about hot spots and crime. From previous studies, we know why offenders choose certain places to rob people: they prefer places where they know there are victims and where they have a minimal risk of getting caught. From generalization, we know that places, where a lot of people moving around and the visibility is low, make good places for robberies and that the clustering of robberies are often at places that have these characteristics (Braga, et al., 2011). This study aims not to generalize why certain places are hots spots, but instead to conduct an in-depth study of five places and explain why just these places are hot spots. In his study, St Jean (2007) found different attributes at various places which explained why they were hot spots. This study could hopefully do the same. This could give an indication, if it is important to research certain places in detail to find why they are hot spots, or if it is enough to generalize. By visiting the places, it might also be possible to find certain aspects that are place-specific, which means that you cannot see them on a map or generalize them from other places. Since there have been relatively few studies done of hot spots using participant observation, there is little knowledge of what you can find using this method. This study could, therefore, contribute to the research gap which exists.
7 When looking for previous studies, no qualitative studies about hot spots done in a Swedish context were found; all studies found used quantitative methods. The findings of the studies found are, however, that the same conclusion as the American studies applies to a Swedish setting; there are few places that have many crimes, throughout a city (Granath, 2014; Priks, 2015; Uittenbogaard & Ceccato, 2014; Østergaard Larsen, et al., 2015). This means that there is a lack of knowledge about individual characteristics of hot spots in Sweden. Even though there are qualitative studies done in other countries, it is difficult to say if the same things could be applied in a Swedish context. St Jean (2007) for example, using the broken windows theory, says that:
“Physical disorder refers to conditions that suggest lack of care for the physical environment of a neighborhood. These conditions include abandoned buildings, broken and/or boarded-up windows, graffiti, overgrown lawns, and untidy vacant lots. Social disorder refers to unpleasant and potentially intimidating patterns of social interaction such as panhandling, loitering, and public drinking” (St Jean, 2007, p. 2).
These conditions may not apply to a Swedish setting since the environment here is different. Abandoned buildings, for example, are less common in a Scandinavian context (Østergaard Larsen, et al., 2015). This thesis will offer some knowledge of what could be important to explain hot spots of robberies in a Swedish context. Hopefully, it can provide information about what is and is not important in a Swedish context.
Robbery is a crime that injures people, spread fear, and lead to an economic loss, it is, therefore, important for the society to prevent it (Braga, et al., 2011; Waller, 2014). There are well-established methods of how to prevent robberies and several projects have been successful in doing that. However, it requires that the problems are diagnosed correctly which means, you need to know the causes of why robberies happen at certain places (Waller, 2014). This thesis will provide an analysis of five hot spots and explain why they are hot spots. The knowledge presented in this thesis can be used to find methods to reduce crimes at hot spots, the solution might even be really simple. It could also provide information on how to get place-specific information.
3. AIM AND RESEARCH QUESTIONS
The aim of this thesis is, to use the Routine Activity Theory and the Crime Pattern Theory to explain why five places, outside the city center in Malmö, are hot spots of robberies. I want to research the characteristics of the places and the people who visit them, to analyze place-specific reasons for them being hot spots of robberies. The analysis will be based on the everyday movement of people at the places, thus there is no attempt to see any robberies. The aim is to analyze each place individually to explain place-specific characteristics, not to generalize. However, the places will be compared to each other to find what they have in common and what differs them apart. The theories will be used to find which
8 characteristics are important and to analyze the result. Because of this aim, two research questions have been formulated. These are:
1. What are the individual characteristics of the places, which could explain why they are hot spots of robberies?
2. What are the similarities and differences between the five places regarding their characteristics?
4. THEORY
In studies where hot spots of certain crimes have been researched, the most common way has been to depart from a theoretical assumption and look for attributes of that theoretical perspective (Uittenbogaard & Ceccato, 2014). In his study, St Jean (2007) used the theories of Collective Efficacy and Broken
Windows to research if they could explain why some places have more crime than others. Uittenbogaard and Ceccato (2014) also did a study where they tested theories. They used the Crime Pattern Theory and the Routine Activity Theory to suggest situational crime prevention methods in Stockholm’s subway.
In this thesis, the aim is to analyze the places themselves, but also the people who spend time or pass through there. The Crime Pattern Theory (Brantingham & Brantingham, 1995) and the Routine Activity Theory (Cohen & Felson, 1979) have therefore been chosen as a theoretical background. The reason for this is, that they both focus on people and physical aspects to explain why crimes do or do not occur at certain places (Brantingham & Brantingham, 1995; Cohen & Felson, 1979).
4.1 The Routine Activity Theory
The routine activity theory originates from Cohen and Felson (1979), who says that:
“Each successfully completed violation minimally requires an offender with both criminal inclinations and the ability to carry out those inclinations, a person or object providing a suitable target for the offender, and absence of guardians capable of preventing violations” (Cohen & Felson, 1979, p. 590).
The theory does not explain who is the offender or the victim; rather it is a
descriptive theory that describes the risks of becoming victimized at certain places (Pratt & Turanovic, 2016). Routine activity means that there are certain patterns in peoples’ everyday lives. People might go to work, to school or to other activities. When people are moving around in their everyday lives they will visit and pass through certain places. Some of the places visited by people will offer
opportunities for offenders to commit a crime against them. The way to reduce crime is therefore to reduce opportunities for crimes (Cohen & Felson, 1979). To think that leaving the house is a risky behavior is not a useful analysis though.
9 This because, you cannot stop people from leaving their houses since people must do that to engage in activities and meet other people (Pratt & Turanovic, 2016). “Thus, thinking about what constitute high risk, people, and places—as opposed to just people and places—is a more useful theoretical endeavor when thinking about victimization” (Pratt & Turanovic, 2016, p. 339). Within environmental criminology and in research about places of crime, the Routine Activity Theory is often used to analyze victims and crime targets. The vast number of analyses are about victims at certain places and how the lack of capable guardians makes certain targets more vulnerable. The theory put little emphasis on the potential offenders, the assumption is that there are enough motivated offenders around and the key to understanding crimes are potential victims and lack of capable
guardians (Clarke, 1997).
Figure 1 The Routine Activity Theory (Wikipedia, 2017)
4.2 The Crime Pattern Theory
In contrast to the Routine Activity Theory, the Crime Pattern Theory put more emphasis on the offenders, why certain places attract them or generate criminal activities. According to the theory, there are three types of places, crime attractors, crime generators and crime-neutral areas (Brantingham & Brantingham, 1995). Crime attractors are places which attract offenders because offenders know people will be there and the place will offer an opportunity for crime. Crime generators, on the other hand, do not attract offenders, but instead, crime opportunities are generated because many people are attracted to a place during certain times of the day. The number of people there will produce offenders who in the crowd will find people to victimize. Crimes at these places are therefore less planned. Crime-neutral areas are places that are neither crime attractors or crime generators. Generally, crime rates there are lower. Places are not often pure attractors, generators, or crime-neutrals, there is usually a mix or an interaction between the levels (ibid). The theory also explains where people commit offenses in the
concepts of nodes, paths, and edges. Nodes mean that people commit offenses and get victimized at central places in their lives, such as home, work, or school. Many people have the same nodes in their life, and therefore crimes are clustered. “Paths determine where people go and what they learn about the city. People spend long hours in routine paths, traveling to and from work, school, shopping, and entertainment. Paths determine where people search for criminal targets and
10 where people are victimized” (Brantingham & Brantingham, 1995, p. 11). Paths therefore strongly explain the distribution of crimes in a city. There are also edges which are places between two areas and they often have high crime rates.
“Edges can be considered in terms of physical barriers, or in terms of the strong cognitive images created by paths with diverse land uses on either side of a road; or in terms of the limits of perceptual comfort felt by outsiders entering unknown areas” (Brantingham & Brantingham, 1995, p. 12).
The reason edges have higher crime rates is that:
“Edges may create areas where strangers are more easily accepted because they are frequently and legitimately present, while the interiors of areas may constitute territories where strangers are uncomfortable and subject to challenge. Edges may also contain mixes of land uses and physical features - crime generators and attractors - that concentrate criminal opportunities” (Brantingham & Brantingham, 1995).
Both the Routine Activity Theory and the Crime Pattern Theory has been
developed to understand crime at places. The Crime Pattern Theory can be used to map crime and explain geographical crime rates (ibid).
5. METHOD
The point of this thesis is to do a qualitative study; therefore, qualitative methods will be used. The aim of qualitative research is to understand the environment, the humans within it and to analyze rather than describe (Stake, 2010). Participant observation has been chosen as the method to use since the emphasis of the method is to visit places to understand them and the human behavior there (Spradley, 1980). The purpose of observing the five locations is to understand why they are hot spots of robberies, based on their appearances and the everyday movement of people there. It is possible to see the general structures of places on a map, but by visiting them a more personal experience will be provided. It will be possible to observe things that are impossible to see on a map and how things interact with each other. For example, how much it is possible to see from a house or peoples’ movement at the places. The main goal is not to see any robberies, but to analyze how the places could be explained as hot spots of robberies, based on their appearances and the everyday movement of people there.
5.1 Participant Observation- Advantages and Disadvantages Participant observation focuses on studying behaviors in social settings. The researcher observes a behavior to find a meaning and to explain it (Spradley, 1980). The idea of participant observation is to do fieldwork; the researcher wants to go to places where the behavior is taking place, observe, and partly participate in the behavior. The goal is to get primary data, which could be used to explain the behavior and its meaning (DeWalt & DeWalt, 2011). A participant observer has two purposes: “(1) to engage in activities appropriate to the situation and (2) to observe the activities, people, and physical aspects of the situation” (Spradley,
11 1980, p. 54). Observation is the important part of the method. A good observer should objectively observe details and behavior and take notes of them,
considering the bigger picture and the researcher's own role in the behavior and situation. Participation can be done in the form of taking part in the behavior studied, but also in form of informal interviews, where people are asked about what they think or how they experience things. Most interviews are casual
conversations, where the researcher gets information by talking to people (DeWalt & DeWalt, 2011). It is important to note that the researcher’s main goal is to see and analyze, not to participate in every action (Vito, et al., 2014). This research will not be deep in the context that there are many interactions with people. The vast part will be observing people passing by.
The advantages of the method are the gathering of primary data and direct contact with people. “Ethnography yields empirical data about the lives of people in specific situations” (Spradley, 1980, p. 16). It is possible to see how humans behave in social situations, in contrast of just asking them or guessing, which is common in quantitative studies. This makes it possible to analyze how people act rather than how they say they act. Society is complex, there are many different behaviors and people behave in diverse ways in different situations. Participant observations allow the researcher to meet the reality and analyze it from what he or she sees (Spradley, 1980). The method relies on personal experience and the ability to interpret the surrounding. The advantage with that is that, it is easy to find patterns and structures and it is possible to decide what is important and not (Vito, et al., 2014). The involvement of the researcher however also is a
disadvantage, because of the bias of the researcher. Emotions, feelings, and pre-knowledge provides the researcher with a bias, which influences the research. It is possible that this will influence the results and the conclusions. There could also be a problem, where the researcher does not understand or misinterpret what they are researching (Wakeman, 2014). When doing participant observations, it is impossible to come around that the research is biased, however, it requires that the researcher tries to reflect on it. Another problem with qualitative research is that it is difficult to replicate. This is because, the researcher’s own perspective is so important and other researchers might observe different things or interpret things different (Vito, et al., 2014).
This research will be biased because it will rely on my own observations. The observations will only have one perspective and this would be a problem if my own thoughts and feelings were the only analyze. To make the bias less of a problem the theory will be used. First, to create a checklist of what to look for and second, to analyze the observations. This will give this research a theoretical analysis, which departs from other peoples’ thoughts and research rather than my own thoughts and feelings. To make the research valid theoretical analyses must be used to support the participant observations, the conclusion can not be drawn just because I think it something is valid. Therefore, everything observed must be explained. Another important thing is to reflect on how valid the observations are. Important things might be missed and there might things observed, which is not important.
12 5.2 Data Collection
To find hot spots to research, data of robberies reported to the police in 2013 and 2014 were examined. The data might not be 100 percent reliable when looking at the distribution of robberies since not all crimes are reported to the police.
However, the data is somewhat reliable and the only available information which can show the distribution in detail (Hvitfeldt, et al., 2016). Most robberies in Malmö, as other crimes, occurs in the city center, where a lot of people spend time away from home and where many night clubs are found, which means the
presence of intoxicated people. Places that many people visit, generally have more crime than others. This because more people are present there.
“It is well established that places visited by many people tend to have more crime, which can largely be explained in terms of the presence of more potential victims and potential offenders coinciding in space and time. In particular, places such as shopping malls or night clubs that attract large numbers of visitors may act as generators or attractors of crime” (Gerell & Kronkvist, 2016, p. 4).
This is not exclusive to Malmö but is the general pattern of any city (Gerell & Kronkvist, 2016). Outside of the city center, however, seven places stood out as hot spots of robberies. These seven places had lower rates of robberies than the city center and could be referred to as warm spots rather than hot spots. They will, however, be called hot spots since they are hot spots outside the city center. Seven places were too much to observe according to me, instead, five of the seven places were chosen. These were: Tallriken, Nydala square, Nydala bike path,
Lorensborg and Amiral street (Annex 1). The two places removed were
Rosengård Centrum and a place close to a school in Lindängen. They were removed on the basis that I would not feel safe spending time at those two places after dark when many of the robberies occurred. It is possible that the removed places were different, but the aim of this thesis is not to generalize the results. All places chosen were so called micro places since they narrowed down to a street corner or another small area. Previous research has shown that micro places are best to use when researching hot spots of crime (Braga, et al., 2011).
5.2.1 Problem with the Data
There are several problems with the data used in this thesis. The data consist of reported robberies to the police. Using reported crimes is not always the most reliable way to measure crime rates since you then will miss the dark figure of crime (Waller, 2014). In this study, it means that there might be even more places that should be regarded as hot spots of robberies but because of the dark figure, it is not possible to find these places. This, in turn, might mean that in comparison to other places the places observed in this thesis should maybe not be regarded as hot spots of robberies. It can also mean that more robberies happened at the places researched. The problem is simply that there is no knowledge of exactly how many robberies occurred, both at the places researched and at other places in Malmö. Another problem is the distribution of the robberies. The police always report a crime on an address. This means that the police use the closest address available when reporting a crime. However, at some places, the closest address might be up to hundred meters away from the crime spot. In this thesis, micro places are used, it might mean that at some of the places there might be robberies that are reported to an address which is far away from the place researched. There
13 might also be robberies committed elsewhere that are included in the data. A third problem is a gap between the data and when the observations were done. The data is from 2013-2014 which means that the robberies occurred four to five years before the observations were done in 2017. Things might have changed during that time which means that the places observed no longer are hot spots of robberies.
The reason to use this data anyway is that it is the latest data available. It would have been better to have access to the dark figure of robberies when doing this thesis, but there is no way to find that kind of information. This means that the police statistics is the only information which shows the location of robberies committed and thus it is the data used. The displacement of robberies in the statistic is problematic, but at the same time are the robberies displaced to nearby areas. This means that it would be a good idea to take a look at the robberies located close to the micro place to see if they belong to the place researched. The most problematic thing is the time gap between the data used and the observations done. It would have been much better to use later data that shows the location of robberies in Malmö. There is no such data available though. The places
researched might still be hot spots though and research have shown that hots spots of crime tend to be located at the same places over time (Weisburd, 2015;
Weisburd, et al., 2004).
5.3 Use of Theories in the Observations
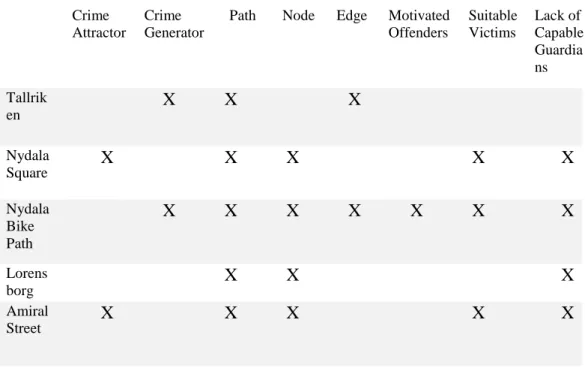
The Routine Activity and Crime Pattern Theory will be used in two ways. First, a checklist with the theoretical concepts will be created (Annex 2). The theoretical concepts will be drawn from previous research to find what is important to look for in the observations. This is because previous research offers a pre-knowledge of what hot spots and robberies look like. The checklist will provide use of established facts as a compliment to my own feelings. This is good since the critique of participant observations is that emotions and feelings influence the results and interpretation too much (Wakeman, 2014). If you depart from the Routine Activity Theory, the hot spots are places where motivated offenders, suitable victims and a lack of capable guardians are present (Cohen & Felson, 1979). From a Crime Pattern Theory perspective, the places are either crime attractors, crime generators or both (Brantingham & Brantingham, 1995). Statistics and previous research have also offered some knowledge. Most offenders are young men who rob other young men and the offender is usually unknown to the victim (BRÅ, n.d). Further, research has shown that offenders often go to places they have knowledge of and where they can be relatively anonymous (Bernasco & Block, 2009). Pre-knowledge will, therefore, be used to categorize what for example could be considered as motivated offenders, capable guardians, crime attractors, or crime generators.
The Routine Activity Theory states that there needs to be a motivated offender, a potential victim, and a lack of capable guardians for a crime to happen (Cohen & Felson, 1979). However, the theory does not clearly say who a motivated
offender, potential victim or capable guardian is. The researcher must, therefore, categorize people into these groups based on the crime type and situational factors (Groff, 2007). Groff (2007) has in her study used knowledge of robberies to create a list of who belongs to each category. Her way of conceptualizing the categories
14 will be used because she defines them clearly. The basic principle is that any civilian person could be characterized by one or more of the three categories (ibid). Since the Routine Activity Theory emphasis little on how motivated offenders looks like (Clarke, 1997), it is difficult to spot potentially motivated offenders based on physical appearances. The assumption of the Routine Activity Theory is that there is a supply of motivated offenders (Groff, 2007). Statistics shows that young males are the most common offenders (BRÅ, n.d), therefore it is the only category in potentially motivated offenders. It does not mean that all young men are potential offenders, but if many young men visit a place, there is an increased chance that an offender will be present. The category potential victims include young men, people with money and easy targets. Groff (2007) says that: “Suitable target is an individual who is visible, accessible and has perceived value” (Groff, 2007, p. 82). Young men are the most common victim of robberies and for it to be a robbery there must be an economic loss (BRÅ, n.d). People with money is defined as, a person who will have money and it is easy to know that, for example, if they take out money from an ATM or shop in a store. We know that sometimes offenders rob people, not for money but for the thrill (Feeney, 2014), then it is more rational to choose an easier target to rob. An easy target is someone who will have difficulties to fight back, such as intoxicated or handicapped people (Groff, 2007). The reason to include handicapped people is that some of the robberies reported were categorized as robberies of handicapped. The category of capable guardians consists of cameras, constant observers, and hard targets. Groff (2007) categorize guardians as people who is hard to rob and therefore can interfere when a crime is taking place. The category will also include physical appearances too since it sometimes is enough that a motivated offender will feel observed for him or her to be deterred from offending (Cohen & Felson, 1979). The presence of cameras and constant observers, therefore, might deter offenders. Constant observers are people or the appearance of people who spend a long time at the places and therefore can observe the places during a longer time. For example, store personal or windows where people are living.
The Crime Pattern Theory is clearer than the Routine Activity Theory in its definition of the theory’s concept. Therefore, I will use Brantingham &
Brantinghams (1995) concepts in the checklist. A crime attractor, in this case, is a place where offenders know there will be people with money. Such places could have a presence of ATMs, stores, or restaurants. It could also be connected to the path concept, which means people will walk through that place. Crime generators are places that attract a lot of people and thereby generates crimes (Brantingham & Brantingham, 1995). In the checklist, a large gathering of people or if many people visit a place during the same time will be observed. Nodes are places that are important in peoples’ everyday lives such as workplace, school, living close, stores or spare time activities (ibid). If the place is a path between nodes and if it is an edge between two areas will also be researched.
15
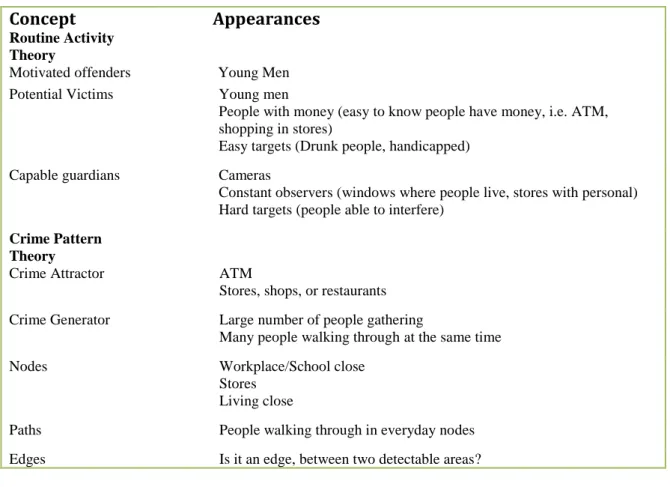
Table 1 Concepts and explanations
Concept Appearances
Routine Activity Theory
Motivated offenders Young Men
Potential Victims Young men
People with money (easy to know people have money, i.e. ATM, shopping in stores)
Easy targets (Drunk people, handicapped)
Capable guardians Cameras
Constant observers (windows where people live, stores with personal) Hard targets (people able to interfere)
Crime Pattern Theory
Crime Attractor ATM
Stores, shops, or restaurants Crime Generator Large number of people gathering
Many people walking through at the same time
Nodes Workplace/School close
Stores Living close
Paths People walking through in everyday nodes
Edges Is it an edge, between two detectable areas?
5.4 How the Observations Were Done
First, the five places were visited to see what they looked like and for maps to be drawn. By observing the places and looking at the maps, some ideas of what could be important in explaining why the places are hot spots were formulated. The second part was to decide when to do the observations since a place might not be a hot spot during certain days or certain hours (Bernasco & Block, 2009). By looking at the statistics of when the robberies took place, at three places most of the robberies occurred during a six-hour period. At some places, most robberies occurred either on weekdays or weekends and at all places, one or more trends could be found. After deciding when to do the observations, the checklist (Annex 2) was created.
The main goal of the participant observations was to see the general structure and patterns of the places, based on how the places looked and how people moved around. This required only spending time at the places taking notes, not to participate in any special kind of behavior. However, sometimes questions about certain things were asked to the people present. The participant observations were done differently at each place, because of the individual characteristics of the places, but there were some general attributes to all observations. At all places, the checklist was used as a guide of what to look for. When arriving at a place the environment was observed to find any physical attributes that applied to the checklist. Then two to three hours were spent at each place every time to see people and their movement. What was observed was, however, different at each place, but field notes were taken everywhere (Annex 1). The field notes departed from the checklist, for example, it was noted if any suitable victims or capable guardians could be found and if the place had any crime attractors, if it was a
16 crime generator or if it was a pathway or an edge. Also, other things considered important was noted. When doing the observations, several considerations had to be renowned. The first consideration was what the weather looked like. What it looks like could affect how many people are present. Rain might keep people indoors, while the sunny weather might inspire people to go outside. This could affect how many people are passing through the places. The second consideration, connected to the weather, is what time of the year the observations were done. All observations were done in March and April. In summer and winter, the movement and number of people passing through might be different.
5.4.1 Tallriken
Tallriken is an open area surrounded by trees. It is a part of a larger park
(Pildammsparken). Next to Tallriken a daycare center and a dog yard are present. There is also a running track in the woods. The first observation was done
Thursday the 9th of March between 17.00 to 19.00. This was around sunset (Annex 1). The observation took place on a bench with a view of the whole place and notes were taken. The checklist was used as a guide of what to look for. At the second observation the 29th of March (Annex 1), the same thing was done, but
I also walked around in the park to see if there were any differences between Tallriken and the rest of the park.
5.4.2 Nydala Square
Nydala Square is a square where stores, a gym and a supermarket is present. Above the stores, there are nine-floor houses. Behind the square, there is a park on one side, parking lot on another side and a yard on a third side. The place lies next to a road where and there is a tunnel under that road. The first observation took place between 18.00 to 21.00 Friday the 10th of March. The first two hours were spent in the middle of the square with the checklist, observing the place and how people were passing through. From the observation point, it was possible to see the ATM and the number of people taking out cash was counted. Other things considered important was noted such as how it looked in the tunnel and how it looked like around the corner where the Kebab shop was located (Annex 1). The last hour of the first observation was spent at a pizza place eating pizza. From there it was impossible to see one of the ATMs. Two of the stores closed at 22.00, therefore the second observation was done when the stores were closed. It took place on Saturday the 18th of March between 21.00 to 23.00. It was done the same way as the first observation. I also decided to talk to the owner of one of the stores, since he spends a lot of time at the place. I asked him about the flow of people walking through and if young people hang out at the square.
5.4.3 Nydala Bike Path
The bike path is a path stretching several hundred meters. It passes by houses schools and fields. The first observation was done Tuesday the 14th of March at 12.00 to 15.00 (Annex 1), by first sitting on a bench with the checklist and taking notes. After one hour, I decided to walk up and down the bike path to see how the bike path looked further up and down the way to see the differences between the stretch and the rest of the bike path. After the first observation, it was decided to observe the place in the evening when the school was closed and it was dark outside. The second observation was done on Thursday the 23rd of March (Annex 1). This, to see how the flow of people looked like after dark. A third observation
17 was also done to see how the path looked like at the time when school finished. The observation was done in the same way as the other two between 13.30 to 15.30 on Friday the 31st of March (Annex 1).
5.4.4 Lorensborg
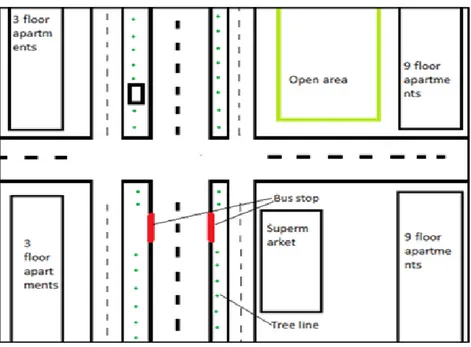
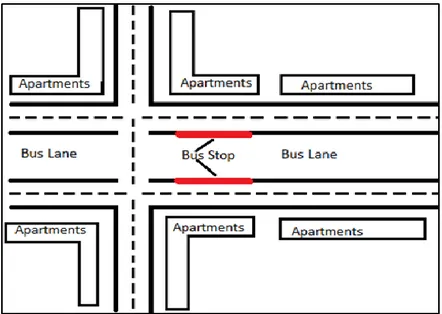
The place is located at the crossing of Lorensborg Street and Hallings Street. Next to the crossing, there is a supermarket, a bus stop, and a grill. The first observation took place on Thursday the 16th of March between 18.30 to 21.00 and the second
between 21.00 to 23.00 on Wednesday the 22nd of March (Annex 1). At the first observation, there was no hypothesis of what could be important, therefore as many things as possible were noted. I sat on a bench at the bus stop and observed how people were passing through, how many people were getting on and off the bus, how the flow of people into the supermarket looked like and how the flow of people to the grill looked like. I also walked around in the crossing to see it from different angles and trying to estimate how much you could see of the crossing from the houses. The second observation was done later in the evening than the first one after the supermarket was closed and the focus was one side of the road. I still, however, took notes about the whole crossing. Otherwise, the observation was done in the same way as the first. A third observation was done where the previous and next crossing were observed. This to see similarities and differences between crossings, to be able to explain why just this crossing is a hot spot.
5.4.5 Amiral Street
The place is located at the crossings of Amiral Street and Baskemölle Street. Next to the crossing, there is a bus stop. The first observation took place on Sunday the 26th of March (night between Saturday and Sunday between 00.00 to 02.00 (Annex 1). I sat at the bus stop, taking notes of the place and how cars and people passed by, how many buses stopped and how many people stepped on and of the bus. Also, how many people who walked by were intoxicated were noted, since it was the time when people walked home from bars or night clubs. During the second observation on Sunday, April the 2nd between 03.00 to 05.00 (Annex 1), the previous and next bus stop on the bus line were visited to see if was possible to explain why crossing on Amiral Street was more exposed to robberies than the other places.
5.5 Analysis of the Material
Being able to explain the observations are important since the aim is to find why the places are hot spots of robberies. The analysis will be integrated into the observations with the checklist and the use of theories. In Appendix 1, the field notes will be written. They will contain what have been seen in the observations, without any attempt to explain it. The result and analysis will be integrated in a way to present what was observed and how it can be analyzed by the theories. Both theories used will be applied and analyzed together. This because, the theories are linked together in the way that they both explain crime at places, thus being applicable on the same thing (Cohen & Felson, 1979; Brantingham & Brantingham, 1995). Using theory as an explanation is well proven in research and offers the researcher with a framework to depart from. This means people doing research will have more than just their feelings to rely on when analyzing the data (Wakeman, 2014).
18 The result and analysis will consist of a presentation and an analyze of what was observed; there will be a presentation of the observation, how the theories could explain what was observed and how different things interact with each other. The Routine Activity Theory says that motivated offenders, suitable victims, and a lack of capable guardians are important to explain crimes (Cohen & Felson, 1979). What in the observations, which could be considered as motivated
offenders, suitable victims, and capable guardians will be presented. Then it will be analyzed if all those components are present, if some or more are missing and what that means. The same thing applies to the Crime Pattern Theory; if some things are crime attractors if the place is a crime generator and how nodes, paths, and edges interact with each other. Each place will be analyzed individually since they are different but there might also be different explanations of why they are hot spots. After the individual places have been presented and analyzed, they will be compared to each other to analyze the similarities and differences between them.
5.6 Ethical Considerations
There are no major ethical considerations in this thesis. Most of the fieldwork consists of observing places and people, with little personal interaction. Anyone can sit at a public place and observe people if that person does not disturb the order. There is, therefore, no reason to think that the method used in this thesis will personally affect anyone. There are however some things which must be regarded when doing the observations and interviews. The persons interviewed must consent and the questions must be about the place. Personal questions shall be avoided. During the observations, places that are public must be used that have no insight into peoples’ private lives, for example where it is possible to see into peoples’ homes.
6. RESULT AND ANALYSIS
The analysis will consist of two parts. The first part aims to answer the first research question, which means each place will be presented and analyzed separately. In the second part similarities and differences between the places will be analyzed to answer the second research question. The similarities and
differences will be discussed in relation to the theories but also regarding the places individual characteristics. The presentation of the result and the analysis will be integrated with each other, because the observations were done in an analytic way, using the checklist.
6.1 The Characteristics of the Five Places
Each place observed was different, regarding location, appearance, time of day when the robberies took place, number and characteristics of people who moved around and how many robberies occurred there. Since each place has its own characteristics, each place will be presented and analyzed separately.
19
6.1.1 Tallriken
When looking at the statistics, 16 robberies occurred in 2013-2014 (Annex 3). More than half of the robberies occurred in July to September; only six robberies happened outside of that period. This implies that when the observations took place, the 9th of March between 17.00 and 19.00 and the 29th of March between
16.00 to 17.30 (Annex 1), tallriken should not have the characteristics of a hot spot.
During the observations, it was difficult to find characteristics which could explain the place as a hot spot. In fact, the findings suggested it was not. When departing from the checklist using the Routine Activity Theory, there were both a lack of potential victims and a presence of capable guardians (Annex 2). Both the daycare centers and the dog park could be viewed as capable guardians since people spent time there and could see what happened at Tallriken (Annex 1). Few people passed by and it would have been easy for people who spent time there to see an offender who committed a robbery. People at the outside gym could also be viewed as capable guardians since they could see Tallriken through the trees. Because few people passed by and most of them were either exercising or walking their dogs (Annex 1), it was difficult to find any characteristics which meant that potential victims would be present. It was hard to know who had money/valuables or not. The vast number of people exercising even suggests that there were many people who did not have any money/valuables on them. The runners and dog walkers could even be seen as hard targets and thus capable guardians (Annex 2) since they were fit or had a dog with them, which would have made them more difficult to rob. Rather than a hot spot of robberies, the observations suggested that few potential offenders and victims were present and there were many capable guardians. No one spent any long time at Tallriken, few walked through and after dark, due to the absence of lights, the place was almost completely empty (Annex 1). The lack of potential victims and the presence of capable guardians meant that the place could not be a crime attractor or a crime generator, rather it was a crime neutral place; where only occasional crimes take place (Brantingham & Brantingham, 1995). The place is a pathway between peoples’ nodes since most of the people observed passed through and it was popular for people to go there when taking a walk or exercise. According to theory, pathways have a lot of crimes (Brantingham & Brantingham, 1995), but in this case, the opposite conclusion is drawn due to the circumstances presented; few people present and most of the people present were considered as capable guardians.
20
Figure 2 Picture of Tallriken
Even though what was observed suggested that the place was not a hot spot of robberies, during the summers of 2013-2014 Tallriken was a hot spot of robberies. This means that additional knowledge must be used to explain why. As a
researcher, I have a pre-knowledge of the place since I have been there during other times of the year. The observations took place in March when the weather was cloudy and between five to ten degrees, which means that fewer people spent time outside then for example in the summer. Tallriken, as well as the whole park it is located in, is a popular place for people to visit when it is warm outside. This means simply that more people are present there at the same time during the summer than at other times of the year. Tallriken is also a place where events take place, like festivals and concerts. This means that during the summer there is a change in the characteristics of the place. In the summer, it would be more difficult to see the place through the trees, meaning the people running and spending time at the outside gym cannot see it. The gathering of many people is an indicator that Tallriken is a crime generator (Annex 2). The number of potential offenders and victims will in the summer increase because of a large gathering of people at the same time. This, in turn, increases opportunities for crimes. The gathering of people could also attract offenders to the place however, it is difficult for potential offenders to have any knowledge if people would have valuables there or that they would be able to rob. This because, the only
knowledge an offender can have of the place is that there would be many people there, not if they are suitable victims or if there is a lack of capable guardians. Rather it suggests that in the situation, a motivated offender would find
opportunities for robberies there. Tallriken is probably not an edge since an edge is a place between two areas where people live (Brantingham & Brantingham, 1995). Tallriken is part of a park, therefore no one lives there.
6.1.2 Nydala square
According to the statistics, six robberies happened at the square itself and four just next to the square in 2013-2014. Six robberies happened between 17.30 to 23.00 on Fridays, Saturdays, and Sundays and three within the same period on
21 Fridays or weekends the observations were done Friday the 10th of March between
18.00 and 21.00 and Saturday the 18th of March between 21.00 and 23.00.
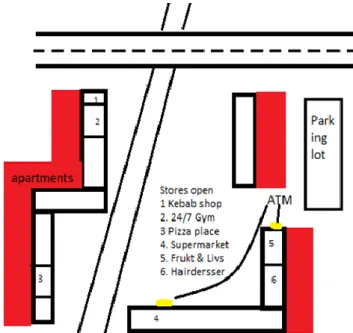
It was easy to find characteristics which could explain the square as a hot spot for robberies. Two ATMs were used by between 20 to 30 people per hour in average when the observations were summarized and there were several shops, stores, and restaurants open (Annex 1). These characteristics indicate that the place is a crime attractor (Annex 2) since it is easy for a motivated offender, who knows the area, to know that people will have money there. The presence of a supermarket, some stores, and two ATMs suggested that the place was a central node in people's lives. People visited the shops to buy things, especially the supermarket, people visited the ATMs to get cash and some people ate at a restaurant or exercised at the gym. This explains why there was a constant flow of people who passed by, but few people who spent any longer time at the square (Annex 1). When inside a store, it was difficult to have a view of the square thus, the square was lacking capable guardians even though many people were present there. The square itself is could, therefore, be seen as a path between the nodes home and supermarket, restaurant, and gym.
Figure 3 Map of Nydala Square
The groups of young people who, according to one of the shop owner, hangs out at the square when the weather is warmer (Annex 1), is an indicator that the place also could be a crime generator (Annex 2). Young people are the most common offenders (BRÅ, n.d) and if groups of young people spend a long time at the square, the risk that one or more people will find opportunities to commit
robberies there will increase. Even though not every young person is a motivated offender, the fact that most offenders are young males means that, if many young males are present the risk of an offender being present increases. The reason to consider the place as a crime attractor rather than a crime generator is that robberies took place all around the year in 2013-2014. This means that most robberies occurred when groups of people were not likely there.
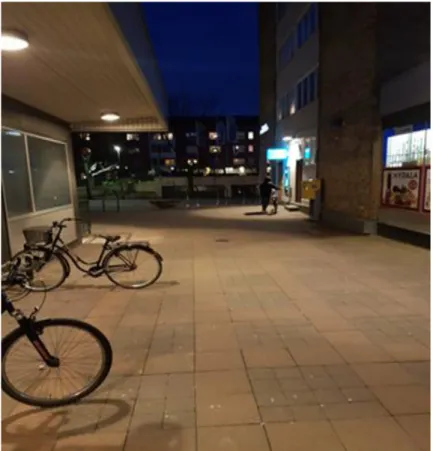
During the observations, many suitable victims were seen, in people taking out money from the ATMs, and at three spots that were observed, there was a lack of
22 capable guardians. The first spot was the ATMs located around the corner of the square since it could not be seen from any of the open shops (Figure 3). The ATM itself had a camera, which could be considered as a capable guardian (Annex 2), but there was a narrow corridor of about 20 meters between the ATM and the square. Behind the ATM there was a parking lot where few or no people were present during the observations (Annex 1). It was, therefore, possible to rob someone at both sides of the ATM. That most people used the pathway on the left side of the square also lead to the impression that the place by the ATM felt empty. The second place was the tunnel under the road next to the square (figure 3). From the gym and the kebab shop, it was possible to see the down ways to the tunnel, but there was no insight in the tunnel itself (Annex 1). Since most people who passed through the square used the walking path through the tunnel it was possible for an offender to follow a victim or wait for him or her there. The third place was behind the supermarket. After the square, the pathway went through a small park that few people could see. This place was more likely to be a good place for robberies later in the evening or during the night when the stores were closed. This since, most people passed by there earlier in the evening.
Figure 4 Picture of the ATM around the corner
Windows of apartments towards the square could be viewed as capable guardians were present (Annex 2), but the three places mentioned were difficult to see from most windows. Besides, most windows were dark during the observations. A lack of capable guardians could also explain the time distribution of the robberies. During the day, a café, and a bakery with a view of the ATM around the corner were open, thus it was more likely that capable guardians were present then. The most difficult part is to say whether the place was an edge or not. There are some indicators of that, for example, the entrance to the houses were not on the square but on the opposite side. The presence of stores is on the other side something which speaks against the place being an edge because some of the stores have