The only way is up – anchoring effects in appraisals
Paper presented at ERES, Istanbul, June 2015 Version 2016-06-16
Peter Palm, Helena Bohman, Magnus Andersson
Department of Urban Studies, Malmö University, SE- 205 06 Malmö, Sweden Corresponding author, peter.palm@mah.se, phone: +46(0)40 665 7711
Introduction
In all appraisals, as Amidu (2011) demonstrate, it is the judgement of the individual appraiser that set the level of quality. Appraisal Institute (2001) constitute that the quality of a valuation report depends on good and sound judgement in the application of basic valuation theory. In education and student training focus often lie in the systematic process for decision making regarding how to appraise a property. In this process it is important to ask whether the students are prepared to critically analyse information and make a sound appraisal.
Real estate appraisal use available data make an assessment of an object and its market value. It is generally considered as a process where the goals is to appraise a value rather than calculate a value. As Appraisal Institute (2001) state:
The final value opinion does not simply represent the average of the different value indications derived. No mechanical formula is used to select one indication over the others, rather, final reconciliation relies on the proper application of appraisal techniques and the appraiser´s judgement. (Appraisal Institute, 2001, p. )
When discussing judgement personal beliefs and psychology of the individual appraiser becomes important factors that might influence for example an appraisal task. The appraised value is individual and may depend on different parameters such as tacit knowledge and personal preferences. Tversky and Kahneman (1974) argue that when a person are to put a value on something, she will adjust her first value based on additional information that she receives. Tversky and Kahneman (1974) argue that although this initial value may be relevant or not she will incorporate it and be influenced by it when finally deciding a value for the object. Within real estate appraisal Northcraft and Neale (1987) conducted a survey where they asked different people (both real estate agents and amateurs) to appraise the same property while changing the condition regarding asking price. Although the asking price should not influence the appraisal of the market value. Northcraft and Neale (1987) concludes that regardless of being a professional real estate agent or an amateur there were a positive relation between the irrelevant asking price and the appraised value. In later years several other experiments has been conducted and they indicate similar outcome (for example Levy and Frethey.Bentham, 2010, Thomas et al., 2010, Diaz and Hansz, 2010, Beggs and Graddy, 2009, Kaustia et al., 2008 and Hansz, 2004).
The aim of this study is to conduct an experiment where the appraiser, in this study real estate students in fourth semester (the length of their educational program is six semesters) are faced by different information regarding what value that are preferred by the real estate owner.
Purpose
The objective of the research is to investigate the anchor effect in appraisal of residential property based on a quantitative survey among Swedish students at a program for real estate brokerage.
Prior research has identified various factors that influence price perceptions, including factors that affect assessments of the perceived value of products to consumers and, relatedly, the reference prices consumers use to evaluate the attractiveness of given prices (e.g., Winer 1986). Although the determinants of reservation prices have been extensively studied, there has been
much less research regarding the manner in which consumers decide on the lowest price they are willing to accept for a product (for exceptions, see, e.g., Carmon and Ariely 2000; Kahneman, Knetsch, and Thaler 1990). The value appraised is individual and may depend on different parameters such as tacit knowledge and personal taste. Tversky and Kahneman’s (1974) seminal work on anchor effects reveal that an external number, referred to as anchors, influence the value people will estimate a given object. Within real estate valuation Northcraft and Neale (1987) applied the same idea on real estate, conducting a study in which both students and real estate agents were to value the same house while changing the conditions regarding asking price for the house. Although the asking price should not affect the valuation of the market value, the study concluded that both real estate agents and students were positively affected by the asking price. Design/methodology/approach
The study was divided into two experiments. The experiments were undertaken in a course on real estate valuation, one group of students were introduced to the matter as an exercise on course material and the second group was asked to appraise a property during an exam.
Experiment 1 with a total of 46 students, all in their fourth semester in the real estate education within the course of Real estate valuation, participated in the experiment. The experiment tasks were designed to be both representative of real valuation situation and to be relevant for the students in their course as a kind of rehearsal. In other words, the upward bias of real estate agents should be counteracted since they have been informed that grading is made on basis of ‘true’ vales. Furthermore the task handed out was to estimate the ‘real’ value for a bank – not as real estate agents. The bank should have a strong incentive to want a realistic value rather than a real estate agent who would have an incentive for a positive bias. The experiment was conducted during a classroom exercise. They were not informed of the experiment´s manipulative design nor the research objectives.
Experiment 2 with a total of 115 students, all in their fourth semester in the real estate education within the course of Real estate valuation, participated in the experiment. The experiment was conducted during the final exam of the course and designed to be representative of a real appraisal situation.
In both experiments, students are first asked to calculate key figures; previous sales records, price/square meter and a quota measuring selling price / taxation value. The students are asked to calculating points of reference which are to be used for the estimated value. In addition to this, they were informed that the property had recently been sold for a fictive price; the anchor. Experimental setting: Experiment 1
For the experiment two properties were used, Property A and Property B. Both properties are typical properties for their respective area.
Specifications for property A: Built 1925, 119 m2 and 50m2 basement. The property was extended in 2004.
The Swedish property market is transparent in the sense that all sales of residential properties are to be registered in a public register. This transparency makes it possible for the appraiser to get comparable sales data. For the experiment the students were exposed for the whole list of sales in respective area so that they could make the sorting of themselves. The list with sales, for property A, consisted of 42 sales and of property B, 26 sales. For property A the range of sales were 1.6´´-3.87´´ SEK and they were between 50-196 m2 and built between years 1925-2000. For property B the range of sales were 1.5´´-3.82´´ SEK and they were between 56-204 m2 and built between years 1925-1958. Besides the list of sales for the area the students also got a map where all of the sales were marked.
For this experiment two different sets of data were produced:
Set 1: Property A is given a high anchor (3.350´ SEK) and Property B a low anchor (2.500´ SEK)
Set 2 Property A is given a low anchor (2.700´ SEK) and Property B a high anchor (3.250´ SEK) The two data sets were distributed to the students during their regular lessons where 33 students got data set 1 and 13 students got data set 2.
The task for the participants was to use the data material in order to use a sales comparison approach to indicate a market value for the property. The assignment constituted that they should first sort the historical sales and select the sales that they think are most comparable. Then calculate average regarding; price per square foot living area, total property price and price divided with tax assessment value. Finally from these averages and the property at hand reconciling, and motivating, a market value for the property. All of this material was to be handed in after the lesson.
Experimental setting: Experiment 2
For experiment 2 one property was used, Property A (same property used in experiment 1) Specifications for property A: Built 1925, 119 m2 and 50m2 basement. The property was extended in 2004.
The list with sales, for property A, consisted of 42 sales. All sales were done in the last 24-month. For property A the range of sales were 1.6´´- 4.95´´ SEK and they were between 50-196 m2 and built between years 1925-2000.
For this experiment two different sets of data were produced: Set 1: Property A is given a high anchor (3.350´ SEK) Set 2 Property A is given a low anchor (2.400´ SEK)
The two data sets were distributed to the students during their final exam.
The task for the participants was to sort the data material using a sales comparison approach to indicate a market value for the property. The assignment constituted that they should first sort
the historical sales and select the sales that they think are most comparable. Then calculate average regarding; price per square foot living area, total property price and price divided with tax assessment value. Finally from these averages and the property at hand reconciling, and motivating, a market value for the property. All of this material was to be handed in after the exam.
Findings
The findings are divided into two sections describing the experiments and concluding section to capture similarities and differences between the two experiments.
Experiment 1
The initial findings implicate low difference between group A (low anchor value) and group B (high anchor value). However, there are indications of higher appraisals no matter the level of anchors within both groups as shown in Figure 1.
Figure 1 Descriptive Statistics Experiment 1
Anchor Observations Mean Std. Deviation Std. Error Mean Difference Appraised value -
average price
Low 45 184,9778 229,37994 34,19394
High 41 250,0244 196,53632 30,69382
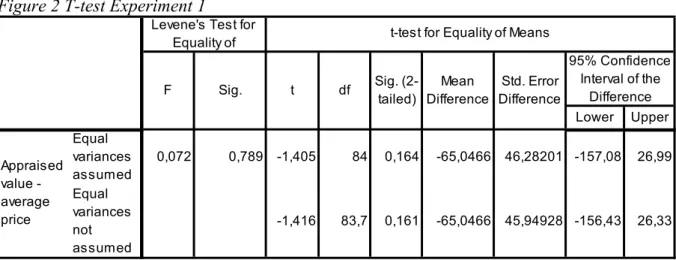
Figure 2 T-test Experiment 1
In above Figure 2 we report the results from the t-test conducted in experiment 1 where we reject the null hypothesis and conclude that there is difference between the mean appraised values depending of low or high anchor. Thus within our sample indicates an anchoring effect where students receiving low anchor tend to appraise a low house value and students receiving a high anchor tend to appraise a higher value.
Lower Upper Equal variances assumed 0,072 0,789 -1,405 84 0,164 -65,0466 46,28201 -157,08 26,99 Equal variances not assumed -1,416 83,7 0,161 -65,0466 45,94928 -156,43 26,33 Std. Error Difference 95% Confidence Interval of the Difference Appraised value - average price
Levene's Test for
Equality of t-test for Equality of Means
F Sig. t df Sig.
(2-tailed)
Mean Difference
Experiment 2
Figure 3 indicate that there is a difference in the mean estimated difference between the appraised value and from the objective sales price when comparing the group receiving a high anchor with the group receiving a high anchor. The students receiving a low anchor tend to provide an appraised value under the objective sales price and students receiving a high anchor tend to increase the appraised value.
Figure 3 Descriptive Statistics Experiment 2
Anchor N Mean Std. Deviation Std. Error Mean
Difference Appraised value - average price low 43 -100,6744 198,14325 30,21656 high 43 163,9070 236,13493 36,01024
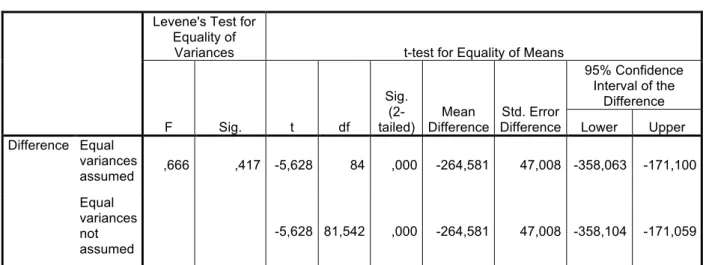
Figure 4 T-test Experiment 2
Levene's Test for Equality of
Variances t-test for Equality of Means
F Sig. t df
Sig.
(2-tailed) Difference Mean Difference Std. Error
95% Confidence Interval of the Difference Lower Upper Difference Equal variances assumed ,666 ,417 -5,628 84 ,000 -264,581 47,008 -358,063 -171,100 Equal variances not assumed -5,628 81,542 ,000 -264,581 47,008 -358,104 -171,059
In above Figure 4 we report the results from the t-test conducted in experiment 2 we reject the null hypothesis and conclude that there is difference between the mean appraised values depending of low or high anchor. Thus within our sample indicates an anchoring effect where students receiving low anchor tend to appraise a low house value and students receiving a high anchor tend to appraise a higher value.
There are two things to note about the analysis of the experiments. To conclude the results supports the effect of the anchor influencing the appraisal process. Students tend to provide a
higher appraised value depending on the level of the anchor in experiment 1. However, students in experiment 2 provide a lower appraised value when receiving a lower anchor. Secondly, our observable characteristics from the t-tests are highly significant. The level of the anchor low or high influence the appraised value.
Discussion
Anchoring effects do not appear to have been as large in the second experiment as the first, though both experiments indicate an anchor effect. An interesting check would be to test whether we can observe a socialization effect within different groups of students influencing the tendency to appraise higher values.
As noted in the introduction, anchoring often influence the process of appraisal providing a bias towards higher appraised values. In this study, we find that the estimated appraisal are biased relative to the objective sales prices no matter of the level of the anchor. We interpret his finding as anchoring.
References:
Amidu, Abdul-Rasheed. (2011). Research in Valuation Decision Making Process: Educational Insights and Perspectives, Journal of real Estate Practice and Education, Vol. 14, No. 1, pp. 19-33.
Appraisal Institute. (2001). The Appraisal of Real Estate, 12th Edition, Appraisal Institute, Chicago, Illinois.
Begs, Alan, and Graddy, Kathryn. (2009). Anchoring effects: Evidence from art auctions, American Economics Review, Vol. 99, No. 3, pp. 1027-1039.
Diaz III, Julian, and Hansz, Andrew J. (2010). A Taxonomic field investigation into induced bias in residential real estate appraisals, International Journal of Strategic Property Management, Vol. 14, No. 1, pp. 3-17.
Hansz, Andrew. (2004). Prior transaction price induced smoothing: testing and calibrating the Quan-Quigley model at the disaggregated level, Journal of property research, Vol. 21, No. 4, pp. 321-336.
Kaustia, Markku, Alho, Eeva, and Puttonen, Vesa. (2008). How much does Expertise Reduce Behavioral Biases? The case of Anchoring Effects in Stock Return Estimates, Financial Management, Vol. 37, pp. 391-411.
Levy, Debroah, S., and Frethey-Bentham, Catherine. (2010). The effect of context and the level of decisionmaker training on the perception of a property´s probable sale price. Journal of Property research, Vol. 27, No. 3, pp. 247-267.
Northcraft, Gregory, B., and Neale, Margaret, A. (11987). Experts, Amateurs, and Real Estate: An Anchoring-and-Adjustment Perspective on Property Pricing Decisions, Organizational Behaviour and Human Decision Processes, Vol. 39, pp. 84-97.
Thomas, Nonoj, Simon, Daniuel, H., and Kadiyali, Vrinda. (2010). The price precision effect: Evidence from laboratory and market data, Marketing science, Vol. 29, No. 1, pp. 175-190. Tversky, Amos, and Kahneman, Daniel. (1974). Judgement under Uncertainty: Heuristics and Biases, Science, Vol. 185, pp. 1124-1131.