N0. 60 ' 1981
60
Statens väg och trafikinstitut (VTI) - 581 01 linköping
National Road & Traffic Research Institute - 5-581 01 Linköping - Sweden
Frost heave tests on tills with an
apparatus for constant heat flow
by Sven Fredén and Lars Stenberg
Paper presented at the 2nd International Symposium on Ground Freezing,
N0. 60 ' 1981
60
Statens väg- och trafikinstitut (VTI) - 581 O1 Linköping
National Road &Traffic Research Institute - S-581 01 Linköping - Sweden
Frost heave tests on tills with an
apparatus for constant heat flow
by Sven Fredén and Lars Stenberg
Paper presented at the 2nd International Symposium on Ground Freezing,
Contents
Abstract
Introduction
The Frost Heaving Process
Description of the Apparatus
Experiments
Sample Preparation
Influence of Saturation Time on Water Content
Repeatability
Relation between Frost Heave Rates and Capillarity
Study of Frost Heaving Rates of Sandy Tills
Results
Page760
760
761
764
766
767
767
768
769
771
771
The 2nd International Symposium on Ground Freezing
The Norwegian Institute of Technology
June 24. - 26., 1980, Trondheim, Norway.
22%
...u||||||||||
ISGF 80
FROST HEAVE TESTS ON TILLS WITH ANAPPARATUS FOR CONSTANT HEAT FLOW
Sven Fredén and Road Division, Sweden
Lars Stenberg Swedish Road and
Traffic Research Institute Abstract
An apparatus for determinations of the frost susceptibility of soils has been tested. Repeated freezing was performed with constant heat extraction. The soils tested were frozen under various load pressures Freeze thaw cycles on the same sample showed that the repeatability is good.
In the same equipement were several tills frozen. The results show that tills of nearly the same mechanical composition show great differences in their sensibility to changes in load pressure. Comparisons with capillarity and percent finer than 0.074 mm were made in an effort to make a relative classification of the soils. 1. Introduction
During the last few years it has been documented more and more clearly how unreliable, in many cases, the conventional, indirect methods of classifying the frost susceptibility are. The need for a method which can determine the frost susceptibility of soils by
direct frost heaving tests and which is easy to handle has often been emphasized. Such a method should comply with the following
re-quirements:
1) External parameters, such as heat flow (in the frost zone), pore water pressure and mechanical load, should be well-defined and easy to measure.
2) The sample volume should be so large that large particles (say 20 mm ) in a till, for instance, need not be sorted out.
3) It must be possible to compact the sample under controlled con ditions to the compaction degree desired.
4) The equipment should be easy to handle and not require complicated external arrangements.
In this connection, it is important to try to demonstrate which thermal parameter that can be considered fundamental and then to design the control equipment to control and measure that parameter.
2. The Frost Heaving Process
Freezing - and frost heaving, if any implies that water
crystallizes and is transformed into ice. This can occur under two different conditions:
1. Only the water that originally exists in the soil freezes when the temperature falls below 00C. In making a preliminary approximation it can be assumed that no frost heaving will occur (the volume expansion of the soil with the enclosed water/ice is zero). 2. In addition to the water that exists in the soil before the
freezing, water is carried up to the ice front from the underlying layers. When this water freezes, which occurs in the form of ice lenses, an expansion of the volume of the soil materials occurs and frost heaving is obtained.
No matter under what conditions the ice formation occurs, the same amount of heat energy per quantity of phase transformed water is liberated. For the ice formation to continue, this amount of energy has to be carried away.
From the location where the freezing occurs the frost zone a heat transport towards the ground surface (we assume that it is below zero) occurs, but, at the same time, heat is transported from below towards the frost zone. Obviously the rate of the ice formation is a function of the difference between these two heat flows. If the heat flow upwards from the frost zone is denoted by qt, the flow from below by go, the amount of heat per unit of time that is liberated
during the ice lense formation by qh, and the corresponding value for the original water in the frost zone by qu,
qt_qo=qh+qu
is obtained.
Under the given, simplified conditins, and regarding the system as stationary, it can be noted that
D"
_ qh/L ' Y
Iu = qu/L ' y - w AW = h/u
where the rate of heaving is denoted by h, the penetration of the frost by u, the density of hte water by y, the crystallization heat of the water by L, the moisture content increase (in parts by volume) obtained by the frost heaving by AW and the original moisture content by w (in parts by volume).
In theory, the heat flow, qt, is easily calculated. In reality, the calculations become more difficult by the fact that the thermal conductivities of the soil materials in question are not always know with sufficient accuracy and that the irregularly varying road
surface temperature has to be described in a simplified way. In most practical cases, however, it will be possible to calculate this flow with sufficient accuracy. qo, which denotes the flow that reaches th frost zone from below, can often be regarded as a non varible
parameter given by the climate, but can also be determined with satisfactory accuracy.
The relation between qu and qh is, however, unknown. In the dis cussion that follows we introduce the quotient A, defined as qu/qh. By experience we know that A is primarily a function of the pore structure of the soil material and the dimensions of the pores and the following external variables:
- The heat flow - A is a function of Aq and probably also of qt
(Aq = qt ' qo)
The pore water pressure composed partly of static negative pressure, partly of dynamic negative pressure.
The mechanical load the pressure that the above lying soil layers etc exert on the frost zone.
6 1 / l 4 ** x * x / /© (Load = 5,3 KPa)
R a t e o f h e a v x n g , m m / s e k -O (Load = 10,6 KPa) [ I 10 20 30 40 Heat flow, mw/cm2
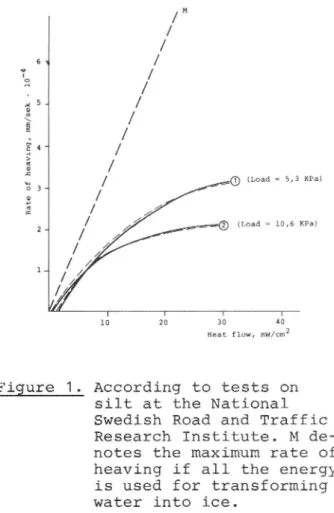
Figure 1. According to tests on silt at the National Swedish Road and Traffic Research Institute. M de-notes the maximum rate of heaving if all the energy is used for transforming water into ice.
According to Beskow et al it is possible to add up the mechanical load and the pore water pressure. The load, as well as the static pore water pressure, is of course easy to determine (provided that the position of the ground water table can be assumed to be known). The dynamic pressure is a function of the flow velocity and the permeability. Since the flow is directly proportional to h and,
consequently, also a function of A and, furthermore, the permeability is a function of the pore water pressure, the relation between A and the dynamic pore water pressure becomes mathematically complicated but quite solvable using the present facilities. The rate of the flow is, however, so low that the dynamic pressure may be neglected or, at any rate, the permeability may be cosidered constant. (This can
always be done when the soil pores are filled with water.) Once the sum of the pressure is known, its influence on A can be shown experi
mentally, which has also been done on a number of soil types. Because of experimental difficulties it is not until the last few years that is has been possible to more convincingly present relations between the heat flow and A. This has been done at the National Swedish Road and Traffic Research Institute i.a., and some results are presented in figure 1 (as relations between Aq and h). The curves that are typical of each soil type are fundamental for determining the amount of frost heaving. It is now possible to calculate the amount of heaving for a certain soil if these relations are known:
A1 = f1 (pressure
a2
f2(qt _ qo)
Thus, for a non compressible soil the rate of frost heaving is h : A1 (P): A2(qt _ qO).
3. Description of the Apparatus
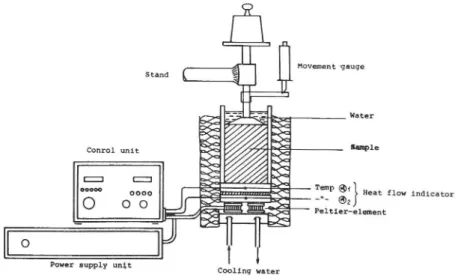
The soil specimen cell (113 mm in diameter, 200 mm in height) rests on a heat flow indicator that is connected to the cooler (figure 2). The cooler consists of a battery of Peltier elements, the warm side of which is cooled with tap water. Thus the sample is cooled from below, which does not, however, really affect the frost process since the direction of the gravitation is of minor importance in comparisc with the other energy gradients that act during the frost process.
Movement gauge Stand Water Sample
Conrol unit Twp®1 _" 2 Peltier-element
Heat flow indicator
Power su 1 un t
pp y 1 Cooling water
Figure 2. Equipment for measuring the frost heaving of soils
Two advantages are obtained by this arrangement:
1) If the sample heaves, the unfrozen part may slide against the
plastic wall with low friction. Consequently, it is not necessary
to use rings for making the heaving possible.
2) As the soil specimen cell is tight and the water pressure is above atmosphere pressure, air cannot enter during the testing.
One disadvantage of the freezing from below is that it is difficult to arrange for a negative pressure. It is, however, possible to assume that the pore water pressure and the ground water load are additives in saturated soils, and the negative pressure can be replaced by the corresponding loading.
As already mentioned, the heat flow through the sample is controlled
by a heat flow indicator placed under the test cylinder (figure 3).
Since, at the temperature interval in question, the heat flow is directly proportional to the temperature gradient (with a discoun-tinuity at the freezing point), the gradient below the frost zone is fixed, too. Since the sample between the heat flow indicator and the frost zone has a certain thermal inertia, the gradient between these points is not completely constant, and the measured flow not com-pletely equal to the flow close to the frost zone. If the lowering of the temperature takes place slowly enough (say less than 1O/h), the error will, however, be negligible. To make a complete description of the thermal relations, the flow through the unfrozen material has to be known. This is possible by having a heat source also on the top side of the sample and by controlling that source by a heat flow indicator, too. In that way it should be possible to control the total heat flow through the frost zone, as well as the difference in the heat flow between the under and the upper sides of the frost zone
(= the energy of the ice crystallization). This possibility of con trolling the heat flow from the warm side of the sample has, however,
been considered not to be worthy of the additional complication that
the necessary equipment involves. The only possibility of obtaining a constant energy flow without the adjustement discussed is to make, by use of insulation, the flow to the frost zone so small, in comparison
with the flow from the frost zone, that it can be neglected. The
easiest way of doing this is to design the end plates with insu lation, which has been done, in this case, by means of 50 mm of ex truded plastic insulation.
Since the equipment is intended for use in normal room temperature, it has been enclosed with a thick insulation, which prevents heat from the environment from disturbing the process.
Experiments
The main purpose of the tests performed was to study the repeata bility of the direct freezing tests and to establish the relation to capillarity and mechanical composition of the soils tested.
Freeze-thaw cycles were performed on a number of tills at constant heat flow but under varying load pressure.
Repeatability studies of the freezing tests were limited to three tills by freeze-thaw cycles on the same sample.
Finally, the relation between capillarity and frost heave rates was studied on tills.
W%
POROUS DISC INSIDE THE PERFORATED STAMP OF BAKELIZED FABRIC FILTER PAPER
O
O
CYLINDER (ACRYL PLASTICS) I
INTERNAL DIAMETER g; 119 MM THICKNESS MM HEIGHT 200 MM D l > l > l > x x D
FILTER PAPER 5 OFine Sllt Sälen .. _| .. _, 2
POROUS DIsc (BRONZE) 0 ( 50 q/cm )
D Till Salen
. " " ( 450 g/cmz)
' A Mora Till 5.1
O -RING x _, .. G
.V,
l , HEAT FLOW INDICATOR3
1. I.
aysFigure 4. Water content, W % (by
Figure 3. The test cylinder
weight), as a function
of time of saturation.
Load pressure m 50 g/cm
was used on the Sälen soils, the other samples were unloaded
Sample Preparation
A simplified sample preparation technique has been tested. The dry soil material is placed spoonwise into the cylinder, which rests in a bowl of water. The porous cylinder bottom consists of a separate disc of sintered bronze beads, figure 3. To eliminate the changes in
compaction degree after a number of freeze thaw cycles, the soil material is compacted lightly by a hand stamp during the saturation process. This preparation technique is used to reduce the Volume of
trapped air in the samples which will occur when using Proctor com
paction on moist soils.
The design also allows of drainage of the over saturated soil sample after thawing and makes repeated freeze-thaw cycles of the same sample possible. The cylinder with the still frozen soil is lifted off the cooler and is allowed to thaw and drain under the same load conditions as during the freezing test. In the meantime, another test is performed. In all tests the heat extraction rate was % 4.7 W. With a cylinder cross section area of 95 cm2 this gives 490 W/m2.
Influence of Saturation Time on Water Content
One silt and three tills were used. Dry soil material was portioned into the cylinder and compacted slightly during the capillary rise of water into the soil. Saturation was considered complete when water separated on the surface under a slight extra load, for instance, by pressing a finger against the soil surface. The cylinder was left in the water for 1-10 days. After this period of time the water content was determined. Determinations of the water content were also made on samples saturated under a surcharge of 50 g/cm2. The results are illustrated in figure 4.
Conclusions:
a) The water content varies a lot both for loaded and unloaded samples.
b) For the soils used, the saturation time is of secondary importance. c) Variations in water content are less for samples saturated under
Repeatability
The repeatability was studied on three tills, Mora E:1, E.2 and G, h several freeze-thaw cycles on the same sample. The samples were saturated in accordance with the procedure described. Both preloaded i.e. load pressure applied during saturation, and not preloaded sample testings were performed.
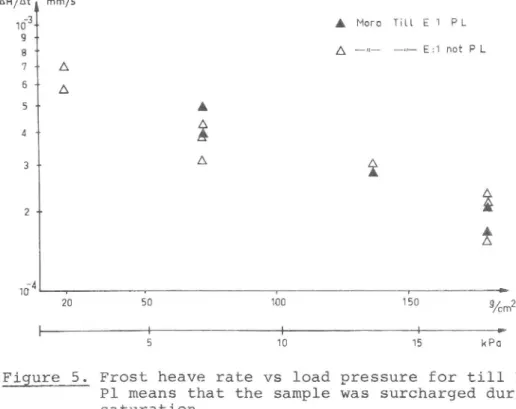
The observed differences in the heav1ng rates cannot be ascribed to whether the sample was preloaded or not. However, the variations in heaving rates are less for the preloaded samples. For till E:1 the heaving rate as a function of load pressure is shown in figure 5.
1 mm/s 10 _ A More Till E1 PL
as
u
-m Ez1 not P L
[> > > V 20 50 100 150 gÅrmZ l l J . i ' I Y ' 5 10 15 ch1Figure 5. Frost heave rate vs load pressure for till E:1. Pl means that the sample was surcharged during saturation.
The methods most commonly used for classifying the frost suscepti bility of soils are based on particle size distribution. In Sweden, the percentage of material finer than 0.074 mm in a cumulative curve representing particles ö < 16 mm is the determining factor for tills. In some cases, a capillarity test is performed on sedimentary soils. The soils are classified as follows:
% 0.074 Cap (Sed)
not frost susceptible I < 16 < 1 m
frost susceptible II 16 - 43 1.0 1.5 m
highly frost susceptible III > 43 > 1.5 m
From table 1 and figure 7 it is seen how poor the agreement between
% < 0.074 mm and frost heave rate is.
Relation between Frost Heave Rates and Capillarity
At the end of the series of freeze thaw cycles, capillarity tests were performed on the upper and lower parts of the till samples, Mora E:1 and E:2. Capillarity was also determined on six other tills, see table 1.
To study whether any vertical sorting had taken place during the repeated freeze-thaw cycles, a sedimentation analysis was made on material < 2 mm from three levels of the Mora E:1 and E:2 samples.
(See table 1.) From table 1 it appears that the difference, in % < 0.074 mm and % 2 0.060 mm, is to small to indicate any vertical movement of freeze thaw cycles.
MM/S 1 0 w1mw7 10 3. () 90679 9 .. 8 £3 " 99682 7 . 6_ X %&3 5. a %&0
4 _
+
+ " 90685
3 . mm s-10'l 21 P . . R A C . 2 1 O s. xmz w ons-w s. " 10' . g _. m _ E: 4 . . X / 7 -_w
x
x
s
å 5" g a 5 3 X 0 /A 8 o A 3 ' k 2 x X 2 O . A 1 X A 10 5 , , , , ' all 20 50 100 150 g/cm2 äcm _voo zoo 300 400 500 sbo 700 Hc 2.0 3.3 0.7 7.3 9.8 12.5 13.6 L<Po
CAPILLARITY
EESE£§_§; Frost heave rate VS
Figure 7. Frost heave rate vs load
capillarity Of tills
pressure for tills of
at different load
about similar composition
pressures
in regard of % < 0.074 mm.
Table 1. Capillarity, % < 0.074 and uniformity of test soils
. Cap % < % < d d Cu
5011
cmvp 0,074 0,060
60
10
d60/d10
Mora Till Ezl upper mtrl <2 mm 42.2 37.0 0.17 0.0042 40.5 " " " middle " " 45.0 40.0 0.15 0.0037 40.5 " " " lower 43.4 38.8 0.16 0.0036 44.4 " " E:2 upper " 45.0 39.8 0.137 0.0037 37.0 u n " middle " " 46.0 41.4 0.133 0.0036 36.9 " " " lower " " 47.0 41.5 0.128 0.0035 36.6 " " G " " 43.2 37.8 0.16 0.005 32.0 Till VTI 94677 " " 48.6 44.5 0.142 0.0051 27.8 " 94679 " 43.4 38.3 0.17 0.0096 17.7 " " 94682 " " 39.0 34.0 0.22 0.0104 21.2 u " 94683 " " 46.2 39.0 0.138 0.010 13.8 " " 94684 " " 32.6 29.0 0.22 0.007 31.4 " " 94685 " " 4 43.0 33.5 0.13 0 008 16.3 Mora Till Ezl upper tot mtrl >750 24.8 21.3 2.3 0.011 209.1 " " " middle " " 33.3 29.9 0.37 0.0074 50.0 " " " lower " " 731 28.8 25.0 0.75 0.009 83.3 " " E:2 upper " " 494 35.0 31.3 0.28 0.0066 42.4 " " " middle " " 36.8 33.0 0.25 0.0062 40.3 " " " lower " " 601 33.7 29.9 0.37 0.0068 54.4 " " G " " 524 29,6 25,3 0,67 0,011 60.9 Till VTI 94677 " " 366 43.3 39.8 0.225 0.0066 34.1 " " 94679 " " 379 38.3 34.0 0.26 0.010 26,0 " " 94682 " " 330 32.0 27.2 0.41 0.0138 29.7 " u 94683 " " 283 40.4 35.2 0.21 0,0127 16.5 " " 94684 " " 225 27.7 25.2 0.32 0.0112 28.6 " " 94685 " "
301 40.8 32.0
0.14 0.0094 14.9 770
The relationship obtained between frost heave rate and capillarity at three different load pressures is shown in figure 6. The expected linearity decreases with load pressure. Thus, capillarity is still a good means in a relative classification, but it cannot yet be used in predicting frost heave behaviour.
Study of Frost Heaving Rates of Sandy Tills
Sandy tills were frozen under constant heat flow but various load
pressures. The object was to compare the frost heaving rates with the general classification of frost susceptibility based on particle size composition. The results shown in figure 7 illustrate how the heaving rates and the sensibility to load pressure vary for soils with small differences in particle size composition.
Comparing the results in figure 7 with table 1, we will find that the tills, VTI 94677-94685, should all be classified as "frost
su-sceptible .
However, the direct freezing test indicates that both VTI 94682 and 94683 can be made "not frost susceptible" even when under a small load pressure. The reasoning is based on the fairly well established assumption that the distance to ground water level and the overlying soil pressure are additives.
Results
Direct freezing tests by the constant heat flow apparatus have the following advantages:
1) By simulating the pressure conditions at the frost line in a direct freezing test, soils classified as frost susceptible from grain size distribution can be found to be not frost susceptible. 2) The heat flow control makes it possible to simulate conditions in
a partially insulated road.
3) Direct freezing of waste products. The mechanical composition of many waste products often make capillarity tests and particle size analyses irrelevant. To that there is to be added that their