CONSIDERATIONSWHENCALCULATING PERCENT ROAD CENTRE FROM EYE MOVEMENT DATA IN DRIVER DISTRACTION MONITORING
Christer Ahlstrom, Katja Kircher, Albert Kircher
Swedish National Road and Transport Research Institute (VTI) Linköping, Sweden
Email: christer.ahlstrom@vti.se
Summary: Percent road centre (PRC) is a performance indicator which is
sensitive to driver distraction. The original definition of PRC is based on fixation data extracted from eye movement recordings, but it has also been suggested that PRC can be determined directly from the gaze data without segmenting it into saccades and fixations. The primary aim of this paper is to investigate if this is the case. Naturalistic driving data from a small scale field operational test comprising seven vehicles was used in the evaluation. It was found that PRC time traces based on gaze data and fixation data, respectively, were highly similar (correlation coefficient=0.95, average wavelet semblance=0.84) except for an absolute amplitude difference of about 8%. This indicates that the two approaches can be used interchangeably and that the processing step of segmenting gaze data into saccades and fixations can be left out. In addition to this finding, design issues related to the calculation of PRC are investigated. Especially, the impact of gaze cases pointing towards the intersection of the road centre area and the centre rear mirror were investigated. Results lead to conclude that gazes and fixations on the centre rear mirror should be removed from the PRC calculations, as they may negatively influence the correctness of the performance indicator.
INTRODUCTION
Traditionally, driver distraction is studied off-line by manual analysis of video recordings (Klauer, Dingus, Neale, Sudweeks, & Ramsey, 2006; Sayer, Devonshire, & Flannagan, 2005; Stutts, et al., 2003). This is a cumbersome and time consuming process which does not allow any kind of immediate feedback to the driver. With the introduction of unobtrusive eye trackers such as SmartEye (SmartEye AB, Gothenburg, Sweden) and Seeing Machines (Seeing Machines, Canberra, Australia), this may be about to change. By using model based image processing, these systems are able to measure where the driver is looking in real time, thus facilitating novel distraction warning systems.
The connection between driver distraction and eye movements is often sought in the driver’s glance behaviour (Donmez, Ng Boyle, & Lee, 2006), but glances are sensitive to task complexity (Lansdown & Fowkes, 1998) and visual demand (Green, 1999), and should always be considered in relation to the driving situation (e.g. speed and environment). Percent road centre (PRC) has been introduced as an easy to implement and more sensitive performance indicator for
distraction monitoring (Victor, 2005; Victor, Harbluk, & Engström, 2005), and several studies have shown that PRC (or related measures) are sensitive to both visual and auditory secondary tasks (Engström, Johansson, & Östlund, 2005; Recarte & Nunes, 2000; Victor, 2005; Victor, et al., 2005). PRC is defined as the percentage of gaze data points labelled as fixations that fall
within the road centre area, where the road centre area is a circle of 8° radius centred around the driver’s most frequent gaze angle. PRC is usually computed based on fixations, but it has also been stated that it can be determined using all gaze data (including both fixations and saccades) just as well (Victor, et al., 2005).
The aims of this study are to investigate two aspects of the PRC performance indicator: (1) the difference between PRC values when calculated based on fixations and gaze data, and (2) the influence of the centre rear mirror on PRC.
METHOD
This study is based on data acquired in a small scale field operational test on distraction and drowsiness prevention. Full details about the materials and methods used in the study can be found in a technical report by Kircher et. al. (2009). To the best of our knowledge, this is the first study using remote eye tracking in a naturalistic setting for a longer period of time.
Seven participants were enrolled in the study, four men and three women. Their mean age was 42 years (std = 10.9 years), and on average they had held their driver’s licence for 25 years (std = 10.9 years). In order to ensure good eye tracking results the participants were not allowed to wear eye glasses, they should not apply heavy mascara and they should not be bearded. The main requirement for participation was high mileage (at least 200 km per day). The test car was a Saab 9-3 SportCombi Aero provided by SAAB Automobile AB.
The vehicle was equipped with an autonomous data acquisition system. Variables such as speed, steering wheel angle and lateral acceleration were sampled directly from the vehicle’s CAN bus and position was logged via a GPS receiver. Two video cameras recorded the driver from over the shoulder and the scene ahead of the car. Further, the vehicle was equipped with the remote eye tracker SmartEye Pro 4.0 (SmartEye AB, Gothenburg, Sweden), for which two cameras observing the driver’s face were installed. A glance-based distraction warning system was also installed in the vehicle.
Each participant drove a baseline phase during approximately 10 days. During this time data were logged, but the distraction warning system was turned off. After the baseline phase the driver was informed that the vehicle was equipped with a distraction warning system, and during the following three weeks the participant drove with the distraction warnings activated. In this study, the two phases were however treated as one since the distraction warning system was not under investigation.
Data Analysis
Initial smoothing of eye movement data was performed in SmartEye Pro 4.0 (SmartEye AB, Gothenburg, Sweden). Further signal processing steps were conducted with in-house analysis tools developed in MATLAB 7.2 (The Mathworks Inc, Natick, Mass). Driving sessions with less
than three minutes of active driving (active defined as speed>0 km/h and gaze quality>0.25) and sessions having a maximum speed of less than 50 km/h were excluded from the analysis. All calculations were performed off-line, thus allowing non-causal analysis methods.
The PRC performance indicator was used to analyse data from the eye tracking system. The road
centre area was here defined as a circular area with a radius of 8° centred around the road centre point (determined as the most frequent gaze angle in each driving session). A two-dimensional
histogram with 100x100 bins, covering 180 degrees of the data in the forward view, was used to calculate the most frequent gaze angle. If more than one gaze angle were found to be equally frequent, the one most closely corresponding to a gaze angle of zero (straight ahead) was chosen. The road centre area was redefined for each driving session, meaning that the amount of data that the centre point was based upon varied between sessions and that the centre point was roughly adjusted for the current driving setting. Based on the road centre area of the current driving session, PRC was calculated in a four seconds wide sliding window which was incremented in one-second intervals. This resulted in a time trace which allowed monitoring of PRC over time. The PRC calculations were based on fixation data as well as on gaze data where both fixations and saccades were included. To locate the fixations, an identification algorithm using three-dimensional velocity and a duration sensitive detection procedure was used (Duchowski, 2007). Gaze cases with velocity less than 125°/sec were marked as fixation candidates and candidates with duration longer than 100 ms were marked as actual fixations.
Correlation and wavelet based semblance analysis (Cooper & Cowan, 2008) were used to
compare PRC time traces obtained with fixations and all gaze cases, respectively. Changes in the amplitude level of PRC was tested with the Wilcoxon signed rank sum test (p<0.05).
RESULTS
The average mileage that the seven participants drove in the experimental car was 4350±2181 km (range 1541 – 7407 km). Some participants drove the same route very often, while others drove many different routes.
Effect of fixations versus gaze data on PRC
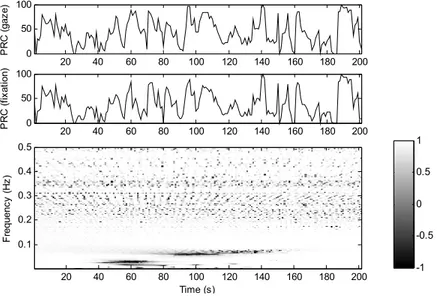
The similarity of PRC time traces, calculated with gaze data and with fixation data, was compared using several approaches. According to the Wilcoxon signed rank sum test, fixation-based PRC values are significantly lower than gaze-fixation-based PRC values (p<0.001), see Table 1. Nonetheless, disregarding the amplitude difference, the correlation and semblance analysis reveals that the two time traces basically contain the same information. The correlation coefficient was high (overall R-value of 0.95) and the average wavelet semblance was high as well (overall value of 0.84). An example of wavelet based semblance analysis (basically correlation between two signals phase angles) can be found in Figure 1, where semblance is plotted as a function of time and frequency. Semblance can take on values from -1 to +1, where white areas imply high phase correlation (1), black areas represent phase anticorrelation (-1) and grey areas represent no phase correlation (0). The average semblance value was determined as the mean value over the entire time-frequency plane. In the example in Figure 1 it can be seen that a low frequency phase anticorrelation appears after about 60 seconds. There is also a long duration phase anticorrelation period from 80 – 160 seconds in the 0.08 Hz band. In general, however, the semblance analysis reveals high phase correlation in the majority of the
time-frequency plane. Since PRC is calculated with a sampling rate of 1 Hz, the Nyquist–Shannon sampling theorem limits the interesting frequency range to 0.5 Hz.
The distance between the road centre points when basing the calculations on gaze data and fixation data, respectively, was found to be very small (average overall distance was 0.02 radians or about 1°), see Table 1.
Table 1. Similarity measures for the seven participants between PRC when calculated based on all gaze cases and fixations, respectively
PRC (gaze)
mean±std (%) PRC (fixation) mean±std (%) value R- Semblance Distance between road centre points mean±std (range), (rad)
1 44±25 38±25 0.97 0.84 0.0120±0.0265 (0 – 0.1217) 2 45±28 40±27 0.98 0.91 0.0051±0.0181 (0 – 0.1414) 3 36±28 22±24 0.85 0.60 0.0329±0.0704 (0 – 0.3406) 4 57±31 54±32 0.99 0.95 0.0033±0.0155 (0 – 0.1456) 5 40±27 30±25 0.93 0.79 0.0215±0.0652 (0 – 0.6083) 6 28±21 20±19 0.87 0.68 0.0286±0.0668 (0 – 0.4837) 7 42±27 37±26 0.98 0.89 0.0071±0.0202 (0 – 0.1020) All 44±29 36±29 0.95 0.84 0.0160±0.0491 (0 – 0.6083)
Effect of the centre rear mirror on PRC
The calculated road centre area and the area defined by the centre rear mirror sometimes intersect. This means that PRC indicates that the driver looks at the road whereas he/she is actually looking in the mirror, see Figure 2. To investigate the consequence of this weakness in the PRC performance indicator, analyses were performed both when the rear mirror was included and excluded from the road centre area. Our results confirm that the road centre area and the centre rear mirror intersect in three of the seven drivers. In fact, 2% of the gaze cases within the
20 40 60 80 100 120 140 160 180 200 0 50 100 PR C ( ga ze ) 20 40 60 80 100 120 140 160 180 200 0 50 100 P R C ( fix at io n) Time (s) F requ enc y ( H z) 20 40 60 80 100 120 140 160 180 200 0.1 0.2 0.3 0.4 0.5 -1 -0.5 0 0.5 1
Figure 1. Example showing time traces of PRC values when calculated based on gaze data (top) and fixations (middle). The wavelet semblance between the two time traces is plotted in a joint time-frequency plane
road centre area were directed towards the rear mirror. By excluding all rear mirror gazes when defining the road centre area, the road centre point is altered in 4% of the trips. The average effect of the rear mirror on PRC was about 1%. Similar results were obtained when using fixations to calculate PRC, see Table 2.
Figure 2. Example of gaze cases from one driving session with participant 5, where the gray crosses reside in the centre rear mirror and the circle represents the road centre area. The abscissa is reversed since it is
defined from the view point of the camera
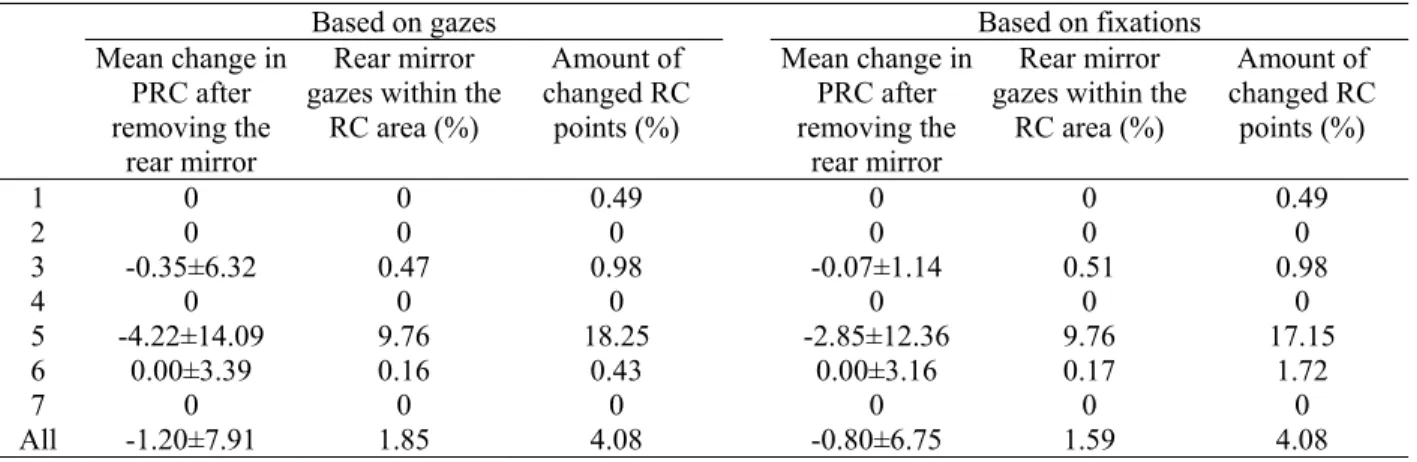
Table 2. Effect of removing gazes directed towards the centre rear mirror before calculating PRC and the road centre (RC) area/point for the seven participants
Based on gazes Based on fixations
Mean change in PRC after removing the
rear mirror
Rear mirror gazes within the
RC area (%) Amount of changed RC points (%) Mean change in PRC after removing the rear mirror Rear mirror gazes within the
RC area (%) Amount of changed RC points (%) 1 0 0 0.49 0 0 0.49 2 0 0 0 0 0 0 3 -0.35±6.32 0.47 0.98 -0.07±1.14 0.51 0.98 4 0 0 0 0 0 0 5 -4.22±14.09 9.76 18.25 -2.85±12.36 9.76 17.15 6 0.00±3.39 0.16 0.43 0.00±3.16 0.17 1.72 7 0 0 0 0 0 0 All -1.20±7.91 1.85 4.08 -0.80±6.75 1.59 4.08 DISCUSSION
The main finding of this study is that gaze cases do not need to be separated into saccades and fixations before calculating PRC. In fact, PRC time traces calculated with fixations and gaze cases, respectively, were very similar with an overall correlation coefficient of 0.95 and a semblance value of 0.84. This indicates that PRC based distraction algorithms will work equally well with gaze data and with fixation data. It should be noted that the main advantage of using gaze data directly is not the reduction in computational complexity, but rather that the difficult problem of designing a robust real-time fixation detection algorithm can be omitted.
PRC values for attentive drivers have been reported to be around 70 – 80 % (Victor, 2005; Victor, et al., 2005). Results from this study support this finding, since the upper range of the results presented in Table 1 are about 70%. However, it should be noted that PRC is generally much lower during a general driving session (44±29% with gaze data and 36±29% with fixations). It should also be noted that the mean values for PRC (fixations) are significantly lower than the mean values found for PRC (gaze data). The similarity between these two
performance indicators suggests that they can be used interchangeably, but due to the amplitude difference, thresholds have to be chosen with care if they are to be used in a distraction warning system.
When keeping one’s eyes on the road, gazes residing in the rear centre mirror should not inter-sect with the road centre area. Nonetheless, the results in Table 2 and Figure 2 clearly show that the rear mirror intersects with the road centre area for several participants. The influence on the road centre point is not very large, but local effects on PRC may be far greater. This issue is probably due to drifting calibration errors in the eye tracking system and not due to PRC per se. Nonetheless, it does affect PRC and the problem has to be taken care of. In this study, the instrumented vehicle was equipped with a two-camera system, allowing precise gaze direction data in relation to a predefined three-dimensional model of the vehicle. With high quality eye tracking data, it is possible to pinpoint and thus exclude gazes in the rear mirror before
calculating PRC. For a large-scale automotive introduction of an eye tracking system the solution will be more complicated since single camera systems are favoured compared to many-camera systems for cost and system complexity reasons. Three-dimensional gaze direction data is however difficult to acquire with one-camera systems, excluding the possibility to directly correct PRC for rear-mirror gazes. A more practical solution could be to create a statistical gaze direction model, where the probability of gaze points lying in the rear mirror is calculated, and thereafter correcting PRC. This approach gains importance with the fact that a promising camera placement is on top of the steering wheel column, which itself is adjustable in all modern cars, resulting in displacements of the eye tracking camera as well. A related issue that should be investigated is if the suggested methodological changes somehow changes PRCs sensitivity as a distraction monitor.
This paper has investigated two aspects concerning PRC calculations, but there are many more variables that affect the end result. Some examples of what still has to be investigated are the size of the road centre area, the size of the bins used when creating the histogram, the time duration that data has to be acquired in order to construct a reliable histogram, the length and overlap of the running window used to create the PRC time trace, the influence of the sampling rate and the impact of different time-on-task issues or driving environments on the road centre area. Further, visual perception and selective attention theories still do not offer conclusive answers on the relation of eye movements and driver distraction (Carsten & Brookhuis, 2005). The use of PRC as a measure related to driver distraction is fairly new in the literature, but it may contribute towards better understanding of visual perception and driver distraction.
In conclusion, PRC based on fixations and on gaze data can be used interchangeably if possible thresholds are adjusted to account for the amplitude difference. It also implies that it is not necessary to segment the eye tracking data into saccades and fixations, thus making distraction detection algorithms more robust and easier to implement. If a world model of the car is
available, gaze cases in the rear centre mirror should be excluded before defining the road centre area.
ACKNOWLEDGEMENTS
We would like to thank the Swedish Road Administration for supporting parts of the project under the IVSS-program (Intelligent Vehicle Safety Systems). Special thanks go to Arne Nåbo and Fredrich Claezon at Saab and SmartEye AB for support with the eye tracker. Last but not least we thank all participants who were willing to share their data with us, and who made this study possible.
REFERENCES
Carsten, O., & Brookhuis, K. (2005). Issues arising from the HASTE experiments.
Transportation Research Part F: Traffic Psychology and Behaviour, 8F, 191-196.
Cooper, G. R. J., & Cowan, D. R. (2008). Comparing time series using wavelet-based semblance analysis. Computers & Geosciences, 34(2), 95-102.
Donmez, B., Ng Boyle, L., & Lee, J. D. (2006). The impact of distraction mitigation strategies on driving performance. Human Factors, 48(4), 758-840.
Duchowski, A. T. (2007). Eye Tracking Methodology: Theory and practice. London: Springer-Verlag.
Engström, J., Johansson, E., & Östlund, J. (2005). Effects of visual and cognitive load in real and simulated motorway driving. Transportation Research Part F: Traffic Psychology and
Behaviour, 8(2), 97-120.
Green, P. (1999). Visual and Task Demands of Driver Information Systems. Ann Arbor: University of Michigan, Transportation Research Institute.
Kircher, K., Kircher, A., & Claezon, F. (2009). Distraction and Drowsiness Field Operational
Test. Linköping, Sweden: VTI (Swedish National Road and Transport Research Institute).
Klauer, S. G., Dingus, T. A., Neale, V. L., Sudweeks, J. D., & Ramsey, D. J. (2006). The Impact
of Driver Inattention on Near-Crash/Crash Risk: An Analysis Using the 100-Car Naturalistic Driving Study Data. Virginia: Virginia Tech Transportation Institute.
Lansdown, T. C., & Fowkes, M. (1998). An investigation into the utility of various metrics for the evaluation of driver information systems. In A. G. Gale, I. D. Brown, C. M. Haslegrave & S. P. Taylor (Eds.), Vision in vehicles (pp. 215-232). Amsterdam: North-Holland.
Recarte, M. A., & Nunes, L. M. (2000). Effects of verbal and spatial-imagery tasks on eye fixations while driving. Journal of Experimental Psychology: Applied, 6(1), 31-43. Sayer, J. R., Devonshire, J., & Flannagan, C. (2005). The Effects of Secondary Tasks on
Naturalistic Driving Performance Ann Arbor: University of Michigan, Transportation
Research Institute.
Stutts, J., Feaganes, J., Rodgman, E., Hamlett, C., Meadows, T., Reinfurt, D., et al. (2003).
Victor, T. W. (2005). Keeping eye and mind on the road. Unpublished Doctoral thesis, Uppsala University, Uppsala.
Victor, T. W., Harbluk, J. L., & Engström, J. (2005). Sensitivity of eye-movement measures to in-vehicle task difficulty. Transportation Research Part F: Traffic Psychology and