A Long-Term Context for Snow Water Equivalent Trends in Rocky
Mountain National Park
Glenn G. Patterson
EASC-Watershed Science, Colorado State University, Fort Collins CO 80523-1482, 303-747-2089, scampi162@gmail.com
Steven R. Fassnacht
ESS-Watershed Science, Colorado State University, Fort Collins, CO 80523-1476, Cooperative Institute for Research in the Atmosphere, Fort Collins, CO 80523-1375, Natural Resources Ecology Laboratory, Fort Collins, CO 80523-1499
Abstract. The seasonal snowpack in Rocky Mountain National Park is critical to the local and
downstream water supply and the ecosystem of the park, and is important for winter recreational opportunities. Recent regional studies of trends in observed snow water equivalent (SWE) over the past three and a half decades have illustrated that temperatures are rising. Snow accumulation is decreasing, averaging on the order of a 2 to 4 cm/decade decline with snowmelt tending to be earlier, averaging on the order of 2 to 4 days/decade sooner. To place these SWE trends observed over the past few decades into a longer-term context, multi-century SWE reconstructions were derived from tree-ring widths and examined to determine whether similar multi-decade trends have occurred in the past. Possible SWE trends were examined into the future using projections from the Coupled Model Inter-comparison Project-Phase 5 (CMIP5) climate models linked to hydrologic models to identify models that best fit the observed data. From these model projections, possible SWE trends were estimated for the remainder of the 21st century. Results of the paleo-analysis suggest that similar multi-decade declining trends in SWE have occurred in the study area at certain times over the past four centuries. Results of the model projections suggest that recently observed trends (past 3+ decades) are likely to continue over the next eight or so decades.
1. Introduction
The seasonal snowpack in and near Rocky Mountain National Park stores and releases about 80 percent of the annual flow of the rivers draining the northern Front Range
(Colorado Climate Center, 2016).
Recent regional studies of trends in observed snow water equivalent (SWE) over 3 decades or more have concluded that, over most of Colorado and the Rocky Mountains, temperatures are rising, and snow accumulation overall is decreasing (Mote et al., 2005; Lukas et al., 2014; Patterson, 2016). Although higher elevations and cooler temperatures in the northern Front Range continue to favor snowpack accumulation during the coldest winter months (Fassnacht and Derry, 2010; Rasmussen et al., 2014), the period of snow cover has been decreasing (Harpold et al., 2012), and spring snowmelt has been occurring earlier (Clow, 2010). This trend is of concern to water managers, ecologists, and winter recreation enthusiasts, but it also has ramifications for meteorology since decreased snow cover lowers the albedo of the land surface causing it to absorb more solar radiation, which contributes to additional warming. Overall, at 23 manual snow course stations and 13 automated snow telemetry (SNOTEL) stations in the vicinity of Rocky Mountain National Park from 1981 to 2015, April 1 SWE has, on the average, been declining at a rate of 10 to 15 mm/decade (Patterson, 2016).
In this paper, these trends in SWE will be examined in the context of the past, by using multi-century reconstructions of paleo-SWE to determine whether the observed trends are unique over a longer term. The trends will also be examined in the context of the future, by using projections of future SWE based on climate models, to determine whether the recent trends are unique, and to anticipate future changes in snowpack accumulation and ablation. 2. SWE Reconstructions Based on Tree-ring Widths
A question that arises in a trend study is: Have there been other periods of similar duration during recent centuries, with indications of similar trends? This question can be addressed using SWE reconstructions based on tree-ring chronologies. Tree ring
chronologies have been used to reconstruct SWE from historical snow course data
(Woodhouse, 2003). With such reconstructions it can be difficult or impossible to identify multi-century trends, because growth trends and autocorrelation have been removed from the record (Woodhouse and Lukas, 2006), because the algorithms used to produce the reconstructions mute extreme values, and because the chronologies are calculated based on relative ring-width indices, i.e., departures from normal, where normal is assumed to be without a long-term trend. As a result, “reconstructions are usually a conservative estimate
of past variability” (Woodhouse, 2016). However, these reconstructions can be used to
examine trends with durations of several decades. 2.1. Data and Methods
Estimates of multi-century patterns of SWE for locations near the study site were derived from seven tree-ring chronologies in the general vicinity of the study area (Figure 1, Table 1). This investigation used three tree-ring-based SWE reconstructions for the evaluation of past trends (Table 2).
Figure 1. Locations of tree-ring chronologies by Woodhouse and Lukas
Table 1. Tree-ring chronologies used in SWE reconstruction (data from Woodhouse and Lukas, 2006).
code name species
begin [year] end [year] length [yrs] latitude [N] longitude [W] elev [m] BTU Big Thompson Douglas-fir 1520 2000 481 40° 25’ 105° 17’ 2012 ENC Encampment Douglas-fir 1380 2001 622 41° 09’ 106° 47’ 2500 GMR Green Mtn. Res. Douglas-fir 1378 2000 623 39° 51’ 106° 14’ 2514 HOT
Hot Sulphur
Springs Douglas-fir 1571 1999 429 40° 04’ 106° 08’ 2499 NPU North Park update Douglas-fir 1486 2001 516 40° 57’ 106° 20’ 2450 PUM Pump House pinyon 1320 2002 683 39° 58’ 106° 31’ 2194 STU Stultz Trail Douglas-fir 1480 1997 518 38° 20’ 105° 16’ 2465
Table 2. Snow courses and periods for associated tree-ring chronologies used in this investigation.
Snow course
Reconstruction date for SWE
Tree-ring chronology
SWE start
Start End
North Inlet Grand Lake April 1 1571 1999 1938
Cameron Pass May 1 1486 2000 1936
Longs Peak May 1 1571 1999 1951
Multi-variate linear regression was used to develop relations between tree rings and snow course SWE. First the monthly SWE data from the 23 snow courses used in the Rocky Mountain National Park study (Patterson, 2016) were examined to identify, for each snow course, the month with the highest median SWE (closest to the annual peak). The monthly SWE data were also used to identify months with large trend values to facilitate comparison of reconstructed trends during paleo time periods and observed trends during the recent (35-year) period. Next, multi-variate regressions were developed between observed SWE for the highest-SWE month for each year of record at each snow course, and tree-ring width index for the same months for each of 26 tree-ring chronologies from the northern portion of the Colorado Rockies (Woodhouse and Lukas, 2006). The three relations with the highest coefficients of determination were selected for analysis of past SWE trends.
The selected relations were used to estimate SWE for the period of record of the chronologies. The reconstructions were then used to compute 35-year linear trends to identify possible large increases or decreases in SWE over the reconstructed time period. To compute the 35-year linear trends, a moving 35-year time frame was centered around each year of the reconstructed record, and a 35-year trend was computed for each year. 2.2. Results of Tree-Ring Reconstructions
The three selected SWE reconstructions, with their equations, fit statistics (coefficients of determination and Nash-Sutcliffe coefficients of efficiency), are listed in Table 3. Of the three, the reconstruction for the Longs Peak snow course has the highest values for the fit
statistics, indicating a fairly strong correlation, while the reconstruction for North Inlet Grand Lake has the lowest, indicating a weaker correlation (Figure 2).
Table 3. Equations for the paleo-SWE reconstructions based on tree rings, fit statistics (R2 is the coefficient
of determination and NSCE is the Nash-Sutcliffe coefficient of efficiency), and comparable period of trend analysis observed in the reconstruction versus the recent period of record.
location reconstruction date equation Fit statistics Comparable trend present? R2 NSCE North Inlet
Grand Lake April 1
26.1PUM + 126HOT +
26.1BTU + 49.6 0.29 0.29
Decrease ~1610 Increase ~1580 Cameron
Pass May 1 162GMR + 202NPU + 355 0.42 0.4 No
Longs Peak May 1
101GMR + 53.5ENC + 36.2HOT + 85.2BTU +
65.4STU + 0 0.53 0.52 Decrease ~1830
Figure 2. Correlation between the modeled (tree ring estimated) and observed April 1st SWE for
the North Inlet of Grand Lake snow course. Data were for the period 1938 (start of snow course) to 1999 (end of tree ring chronology).
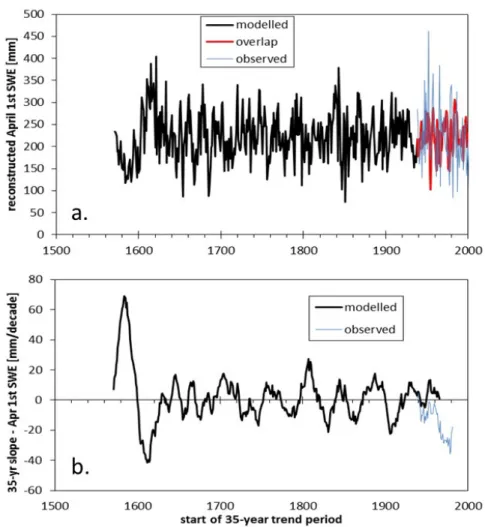
The reconstructed and moving 35-year linear trends in SWE estimates for North Inlet based on these equations are shown in Figure 3. Similar SWE reconstructions and moving 35-year trends for Cameron Pass and Longs Peak are shown in Figure 4. While there is greater variability in the observed (historical) SWE compared to the reconstructed SWE, similar patterns exists for both observed and reconstructed SWE. In general, 35-year moving trends in reconstructed SWE at all three snow courses tend to follow a cyclical pattern, with periods ranging from about 15 to about 60 years, but mostly in the range of 20-30 years (Figures 3 and 4). During these cycles the slope of the 35-year trend in
reconstructed SWE tend to fluctuate between about 80 mm/decade and -80 mm/decade, but mostly in the range of 50 to -50 mm/decade. The recent observed 35-year decreasing trend in April 1 SWE at a rate of almost 40 mm/decade at North Inlet of Grand Lake is therefore similar to decreasing trends that occurred during the paleo-record, specifically around 1610 (Figure 3, Table 3). An even larger increasing trend (~75 mm/decade) may have occurred around 1580. The above method was applied to the May 1st SWE at Cameron Pass and Longs Peak (Figure 4) to yield similar results. Specifically, the Cameron Pass SWE trends in the recent 35 years are somewhat similar to the trends reconstructed for the period 1525-70. The Longs Peak SWE trends in the recent 35 years are similar to trends reconstructed for several periods in the paleo record, and more extreme 35-year trends may have
occurred at Longs Peak around 1830 (Figure 4).
Figure 3. a. North Inlet of Grand Lake April 1st SWE reconstruction from 1571 to 1999. b.
Slope over 35-year time period for the reconstructed and observed (historical) April 1st SWE at
Figure 4. a. Cameron Pass May 1st SWE reconstruction from 1486 to 2000. b. Slope over 35-year time
period for the reconstructed and observed (historical) May 1st SWE at Cameron Pass snow course. c. Longs Peak May 1st SWE reconstruction from 1571 to 1999. d. Slope over 35-year time period for the
reconstructed and observed (historical) May 1st SWE at Longs Peak snow course. 3. Climate-model Projections of SWE
Climate scientists have used various models to project future trends in climatic and hydrologic variables that affect the seasonal snowpack. This investigation examines results from two of those models to compare trends from the past few decades with trends that the models project for the rest of the 21st century (Table 4).
3.1. Data and Methods
Probably the best-known climate model projections are those made by the Coupled Model Inter-comparison Project-Phase 5 (CMIP5) (Maurer et al., 2007; Brekke et al., 2014) (Table 4). Regionally downscaled projections from these models offer estimates of future trends in temperature and precipitation on a monthly basis, for grid cells measuring 1/8 by 1/8 degree of latitude and longitude (Maurer et al., 2007; <
http://gdo-dcp.ucllnl.org/downscaled_cmip_projections/ >).
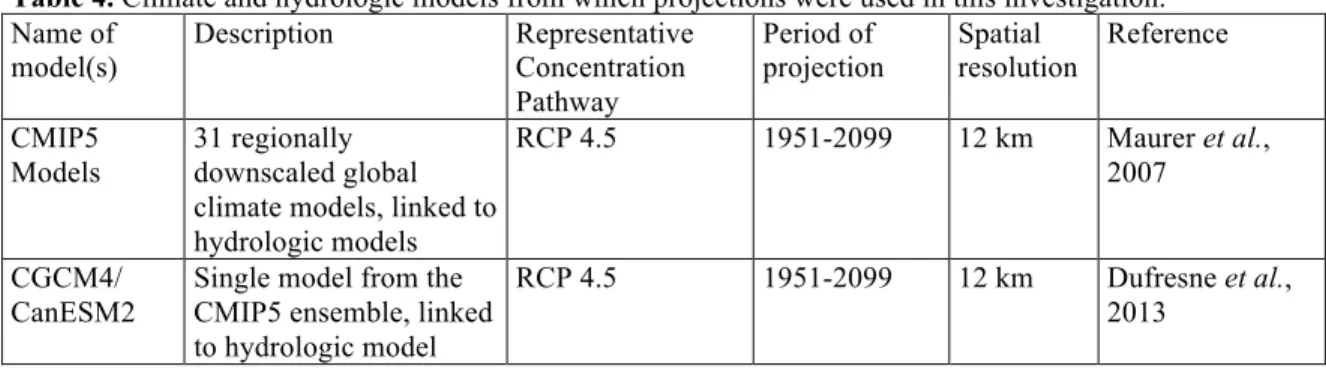
Table 4. Climate and hydrologic models from which projections were used in this investigation.
Name of model(s) Description Representative Concentration Pathway Period of projection Spatial resolution Reference CMIP5 Models 31 regionally downscaled global climate models, linked to hydrologic models
RCP 4.5 1951-2099 12 km Maurer et al., 2007
CGCM4/ CanESM2
Single model from the CMIP5 ensemble, linked to hydrologic model
RCP 4.5 1951-2099 12 km Dufresne et al., 2013
The projections of monthly temperature and precipitation have been used to drive hydrologic models that provide projections of monthly values for hydrologic variables including SWE (U.S. Bureau of Reclamation, 2014; Milly et al., 2005; Stahl et al., 2008). The model linkage is facilitated as the output of the climate model projections, monthly temperature and precipitation time series, serve as input for the hydrologic models. For this investigation, regionally downscaled projections of climate and SWE for the remainder of the 21st century, from the 31 CMIP5 climate models, were examined and compared with the observed trends (Maurer et al., 2007; Brekke et al., 2014). The selected representative concentration pathway was RCP4.5, representing an assumption for a low-to-moderate greenhouse-gas emissions scenario (Clarke et al., 2007). The area selected for regionally downscaled results is a rectangle of 3/8 degree of latitude and 1/4 degree of longitude, roughly centered on Rocky Mountain National Park (Figure 5).
Figure 5. Rectangular area for which regionally downscaled climate model projections were
obtained. (Map produced online at
http://gdo-dcp.ucllnl.org/downscaled_cmip_projections/dcpInterface.html.)
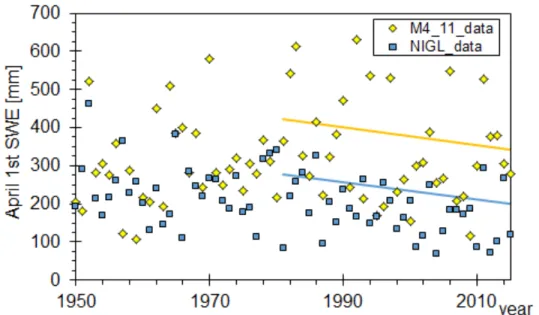
The CMIP5 models were evaluated to select one that, when linked to the Variable Infiltration Capacity (VIC) hydrologic model (Brekke et al., 2014), most closely matched observed SWE data in the study area. One model that closely matched the observed trend at the North Inlet Grand Lake snow course was the Fourth Generation Canadian General Circulation Model (CGCM4 or CanESM2) (Canadian Centre for Climate Modelling and Analysis, 2017) (Table 4) (Figure 6). Both the observed data and the model projection showed April 1 SWE declining at a rate of about -23 mm/decade. SWE projections made using this model linked to the VIC hydrologic model were examined to identify 35-year
Figure 6. Comparison of CGCM4 (6-pixel RMNP mean) April 1st SWE versus North Inlet
Grand Lake snow course, 1950-2015. Trends have been determined using the Thiel-Sen's slope for the 35-year period from 1981-2015. M4_11 refers to the CGCM4 Model.
3.2. Results of Climate-model Projections
When the CGCM4 model is run forward to project April 1 SWE through the end of the 21st century, the overall declining trend continues, albeit at a lesser rate of about 3
mm/decade (Figure 7, orange line). Within this 84-year period one can find 35-year periods with projected increasing trends of as much as 35 mm/decade (green line, 2033-67), and projected decreasing trends of as much as 50 mm/decade (red line, 2056-90).
Figure 7. Comparison of CGCM4 (6-pixel RMNP mean) April 1st SWE, 1950-2099, versus North
Inlet Grand Lake snow course, 1950-2015. Trends have been determined using the Thiel-Sen's slope for 2016-2099 and for various 35-year periods.
4. Discussion
Tree-ring reconstructions have been found to be useful proxies for long-term climate records in comparing recent and paleo trends in temperature (Esper et al., 2012),
precipitation (Yang et al., 2014), streamflow (Chen et al., 2016), and SWE (Woodhouse, 2003; Wood and Smith, 2013). The paleo SWE reconstructions examined in this study show that at least some of the recent 35-year trends in observed SWE have comparable precedents during the preceding five centuries (Table 3, Figures 3 and 4). This finding is consistent with paleo trends that appear in a tree-ring SWE reconstruction for the Gunnison region of Colorado, about 200 km SW of the study area (Woodhouse, 2003). The SWE reconstruction in the Gunnison region showed at least one period in the paleo record, around 1613-25, with a declining trend in SWE similar to those found in this investigation. However, the duration of the Gunnison paleo trend is about 13 years, and thus shorter than the 35 year period used in this Rocky Mountain National Park study.
The climate and hydrologic model projections discussed in the results section consider the atmospheric greenhouse gas loading that distinguishes the current period of warming trends from past warming trends (Maurer et al., 2007). Therefore, the projections for continued warming throughout the 21st century, common to all the models discussed, suggest that climatic conditions driving snowpack accumulation and ablation for the remainder of this century may be different from the cyclical patterns of the past. The CGCM4 model, one of the CMIP5 models that best matches the observed SWE record for 1981-2015, projects a long-term trend of slightly declining April 1 SWE through 2099, at about one-eighth of the rate of decline observed (and simulated) during 1981-2015. The projection of 35-year periods within this long-term trend, with both greater declining trends and increasing trends, suggests that the trends observed during the last 35 years may not be the same as the ones that will occur in the future. It appears likely that the cyclical SWE patterns of the past may now and in the future be superimposed on a generally decreasing long-term trend. This would be consistent with observations of global temperature anomalies over the past 130 years (NASA, 2013) and with projections of future temperature trends (IPCC, 2016).
The regionally downscaled CMIP5 climate models have a spatial resolution of 1/8 of latitude by 1/8 degree of longitude, or about 11 x 14 km (U.S. Bureau of Reclamation, 2014). Finer-resolution models have been shown to provide more accurate representation of complex topography in mountain areas, and hence of the complex weather patterns that influence the snowpack in these areas (Rasmussen et al., 2011, Rasmussen et al., 2014). The Weather Research and Forecasting-Hydrology (WRF-Hydro) model, which has a resolution of 4 x 4 km, was found to have close agreement with observed snowfall and SWE data observed at SNOTEL stations in the Colorado mountains (Rasmussen et al., 2014). The general agreement between the high-resolution WRF-Hydro model and
observed monthly trends in SWE lend some additional credence to this model (Rasmussen
et al., 2014). Specifically, in the WRF model, the simulated trends for precipitation
showed increasing precipitation early in the snow season, especially December through April, and decreasing precipitation later in the spring. The simulated trends for SWE showed little or no loss in SWE during October through February, but greater SWE loss during March through June. Therefore, enhanced precipitation during the early part of the
and, in some places, even raise the average SWE during those months. This enhancement of precipitation and SWE is likely to maintain or raise current SWE conditions as late as April 1 in parts of the study area. As spring progresses, enhanced warming and decreased precipitation are likely to accelerate rates of SWE loss, leading to earlier and lower peak SWE, more rapid melt, and earlier runoff. According to the WRF model, by 2055 April 1 SWE in much of Colorado is projected to decrease by 25% compared with 2014
(Rasmussen et al., 2014). However, the higher elevation and colder temperatures in the northern Front Range will probably result in lesser declines in this study area.
5. Conclusions
During the 35-year period 1981-2015 April 1 snow water equivalent (SWE) in the vicinity of Rocky Mountain National Park tended to show decreasing trends, averaging a decline of about 10 to 15 mm/decade. The decreasing trends were not evident at every measuring station, and were not uniform during the snow season, but did occur at most stations during most months. Reconstructions of SWE in the paleo record based on tree-ring chronologies in the region suggest that there have been times in the past few centuries when similar decreasing trends, as well as increasing trends, have persisted for similar time periods. Looking forward projections of climate models suggest that decreasing SWE trends are likely to continue, for the most part, over the rest of the century, but the decreasing trends may not be as large as they were during 1981-2015, and they might alternate with temporary periods of increasing trends. The high elevations and cool
temperatures in the vicinity of Rocky Mountain National Park are likely to provide at least temporary protection from loss of the seasonal snowpack during the core months of the snow season, at least in the near future.
Acknowledgments. This project was supported in part through a grant from Rocky Mountain
National Park, PR number: R1526-N-5117, Agreement number H1200-09-0004 The regionally downscaled projections were retrieved from
http://gdo-dcp.ucllnl.org/downscaled_cmip_projections/dcpInterface.html, accessed 7-10-16. References
Brekke, L., A. Wood, and T. Pruitt, 2014, Downscaled CMIP3 and CMIP5 Hydrology Projections: Release
of Hydrology Projections, Comparison with Preceding Information, and Summary of User Needs. U.S.
Bureau of Reclamation and other entities, 111 p.
Canadian Centre for Climate Modelling and Analysis, 2017, Models.
http://ec.gc.ca/ccmac-cccma/default.asp?lang=En&n=4A642EDE-1, accessed 2-9-17.
Chen, F., Q. He, E. Bakytbek, , S. Yu, and R. Zhang, 2016, Reconstruction of a long streamflow record using tree rings in the upper Kurshab River (Pamir-Alai Mountains) and its application to water resources management. International Journal of Water Resources Development, 0(0.0):1-11, October 14, 2016. [DOI: 10.1080/07900627.2016.1238347].
Clarke, L., J. Edmonds, H. Jacoby, H. Pitcher, J. Reilly, R. Richels, 2007. Scenarios of Greenhouse Gas
Emissions and Atmospheric Concentrations. Sub-report 2.1A of Synthesis and Assessment Product 2.1
by the U.S. Climate Change Science Program and the Subcommittee on Global Change Research. Department of Energy, Office of Biological & Environmental Research, Washington, 7 DC, USA, 154 pp.
Clow, D.W., 2010, Changes in the timing of snowmelt and streamflow in Colorado: a response to recent warming. Journal of Climate, 23, 2293-2306.
Colorado Climate Center, 2016, Drought Resources, http://climate.colostate.edu/droughtqanda.php, accessed 7-8-16.
Dufresne, J.-L., et al., 2013, Climate change projections using the IPSL-CM5 Earth System Model: from CMIP3 to CMIP5. Climate Dynamics, 40(9-10), 2123-2165, 2013, [DOI:10.1007/s00382-012-1636-1]. Esper, J., and co-authors, 2012, Orbital forcing of tree-ring data. Nature Climate Change, 2:862-866.
[DOI:10.1038/nclimate1589].
Fassnacht, S.R., and J.E. Derry, 2010. Defining similar regions of snow in the Colorado River Basin using self-organizing maps. Water Resources Research, 46, W04507 [DOI:10.1029/2009WR007835].
Harpold, A., P. Brooks, S. Rajagopal, I. Heidbuchel, A. Jardine, and C. Stielstra, 2012. Changes in snowpack accumulation and ablation in the intermountain west. Water Resources Research, 48, W11501-W11511. IPCC, 2016, Climate change 2013: the physical science basis. Working group contributions to the fifth
assessment report of the IPCC.
http://www.ipcc.ch/report/graphics/index.php?t=Assessment%20Reports&r=AR5%20-%20WG1&f=Chapter%2012, accessed 2-18-17.
Lukas, J., J. Barsugli, N. Doesken, I. Rangwala, and K. Wolter, 2014, Climate change in Colorado: A
synthesis to support water resources management and adaptation (2nd ed.). Report to the Colorado
Water Conservation Board. Western Water Assessment, Cooperative Institute for Research in Environmental Sciences, University of Colorado, Boulder, 114 p.
Maurer, E. P., L. Brekke, T. Pruitt, and P. B. Duffy, 2007, Fine-resolution climate projections enhance regional climate change impact studies, Eos Trans. AGU, 88(47), 504.
Milly, P.C.D., K.A. Dunne, and A.V. Vecchia, 2005, Global pattern of trends in streamflow and water availability in a changing climate. Nature 438:347-350. [DOI:10.1038/nature04312].
Mote, P.W., A.F. Hamlet, M.P. Clark, and D.P. Lettenmaier, 2005, Declining mountain snowpack in western North America. Bulletin of the American Meteorological Society, 86(1), 39-49.
NASA, 2013, GISS Surface temperature analysis. Goddard Institute for Space Studies,
https://data.giss.nasa.gov/gistemp/2008/, accessed 2-18-17.
Patterson, G.G., 2016, Trends in snow water equivalent in Rocky Mountain National Park and the northern
front range of Colorado, USA. Unpublished Ph.D. Dissertation, Department of Geosciences, Colorado
State University, 133 pp.
<https://dspace.library.colostate.edu/bitstream/handle/10217/178945/Patterson_colostate_0053A_13989.
pdf?sequence=1&isAllowed=y>, accessed 2-6-17.
Rasmussen, R. M., and coauthors, 2011, High resolution coupled climate-runoff simulations of seasonal snowfall over Colorado: A process study of current and warmer climate. Journal of Climate, 24, 3015-3048, [DOI:10.1175/2010JCLI3985.1].
Rasmussen, R., and co-authors, 2014, Climate Change Impacts on the Water Balance of the Colorado Headwaters: High-Resolution Regional Climate Model Simulations. Journal of Hydrometeorology, 15, 1091-1116 [DOI:http://dx.doi.org/10.1175/JHM-D-13-0118.1].
Stahl, K., R. D. Moore, J. M. Shea, D. Hutchinson, and A. J. Cannon, 2008, Coupled modelling of glacier and streamflow response to future climate scenarios. Water Resources Research, 44, W02422, [DOI:10.1029/2007WR005956].
U.S. Bureau of Reclamation, 2014, Downscaled CMIP3 and CMIP5 Climate and Hydrology Projections:
Release of Hydrology Projections, Comparison with preceding Information, and Summary of User Needs, prepared by the U.S. Department of the Interior, Bureau of Reclamation, Technical Services
Center, Denver, Colorado. 110 pp. Note: The hydrology projections were retrieved from http://gdo-dcp.ucllnl.org/downscaled_cmip_projections/dcpInterface.html, accessed 7-10-16.
Wood, L.J., and D.J. Smith, 2013, Climate and glacier mass balance trends from AD 1780 to present in the Columbia Mountains, British Columbia, Canada. Holocene, 23(5):739-748.
Woodhouse, C.A., 2003, A 431-year reconstruction of western Colorado snowpack from tree rings. Journal
of Climate 16:1551-1561.
Woodhouse, C.A., and J.J. Lukas, 2006, Multi-century tree-ring reconstructions of Colorado streamflow for water-resource planning. Climatic Change, 78:293, 23 p. [DOI: 10.1007/s10584-006-9055-0].
Woodhouse, CA, 2016, Streamflow reconstructions from tree rings: an example from Middle Boulder Creek.
NOAA Paleoclimatology Program. http://bcn.boulder.co.us/basin/forum/basindendro.html, accessed 7-23-16.
Yang, B., C. Qin, J. Wang, M. He, T. Melvin, T. Osborn, and K. Briffa, 2014, A 3,500-year tree-ring record of annual precipitation on the northeastern Tibetan Plateau. Proc. Natural Academy of Sciences USA,