eValuate - A Sports
Analytics mHealth App
Featuring the Perceived Load and Fitness Scale
for Overtraining Prevention and Intervention
ALA ABED
KTH
eValuate – A Sports Analytics
mHealth App
eValuate – en sportanalytisk
mHälsa app
Featuring the Perceived Load and Fitness Scale
for Overtraining Prevention and Intervention
Med utgångspunkt i Belastnings- och
formupplevelseskalan i syfte att förebygga och
ingripa vid överträning
ALA ABED
Degree Project in Medical Technology First cycle, 15 ECTS
Supervisor at KTH: Jonas Willén Examiner: Mats Nilsson
TRITA-CBH-GRU-2020:087 KTH
The School of Technology and Health 141 57, Flemingsberg, Sweden
Abstract
Health and fitness apps have become ubiquitous as smart devices become a major necessity in day-to-day life. However, an obvious issue with mobile health (mHealth) apps is that a substantial portion of them lack a scientific foundation and instead utilize experiential stratagems. Hence, the acquired data becomes unreliable. In sports, where data collection is extensive, this becomes a vital factor for success due to the increasing usage of mHealth. Therefore, the Swedish School of Sport and
Health Sciences has, in collaboration with other organizations, created the Perceived Load and Fitness Scale Questionnaire. The purpose of this questionnaire is to
function as a marker for overtraining, and thus injury prevention and intervention will become a simpler and more efficient task. A computer software was developed for the questionnaire; however, a mobile version was required, and thus requested. Consequently, the mHealth prototype app eValuate was developed. Research, in the form of literature studies, and dissection of other apps, for additional information, contributed to the development of it. The prototype was developed using the programming language Java with Android Studio as the Integrated Development Environment and Cloud Firebase Firestore as a database solution. The finished prototype, eValuate, had to be trialled to ensure that it satisfies the criteria. Thus, the
Mobile Application Rating Scale was employed as the most appropriate means of
evaluation. A small-scale study was planned to trial the prototype by utilizing this scale. However, due to unforeseen events, only four respondents could provide feedback. The prototype performed admirably and scored 3.8 stars out of 5 stars. Nonetheless, the testing sample is too small to draw any real conclusions.
Keywords
mHealth, sports analytics, app development, custom questionnaire, overtraining marker.
Sammanfattning
Hälsorelaterade appar har blivit allt mer förrkommande i och med att smarta produkter blir mer nödvändiga i vardagen. Ett uppenbart problem med mobil hälsa (mHälsa) appar är, dock, att de saknar en vetenskaplig grund och istället förlitar sig på strategier som bygger på empiriska data. Detta innebär att de erhållna resultaten blir opålitliga. Inom sport, där datainsamlingen är extremt intensiv, blir detta en viktig nyckelfaktor för succé då tillämpandet av mHälsa ökar. Av den anledningen har Gymnastik- och idrottshögskolan, i samarbete med andra organisationer, skapat Belastnings- och formupplevelseskalan. Syftet med detta frågeformulär är att fungera som en markör för överträning och därmed simplifiera och effektivisera arbetet med att förebygga skador. Ett datorprogram har också utvecklats för formuläret; däremot behövdes det en mobil version och, därför, begärdes detta. Följaktligen så utvecklades mHälsa prototyp appen eValuate. Forskning, i form av litteraturstudier, och dissekering av andra appar, för ytterligare information, bidrog till dess utveckling. Prototypen programmerades med programmeringsspråket Java i Android Studio som utvecklingsmiljö och Cloud Firebase Firestore utnyttjades som en databaslösning. Den färdiga prototypen, eValuate, måste dock ha testats för att säkerställa att den uppfyller samtliga kriterier. Således användes formuläret Mobile
Application Rating Scale som den mest lämpliga metoden för evaluering. En
småskalig studie hade planerats för att pröva prototypen med hjälp av detta formulär. Oförutsedda händelser ledde, dock, till att endast fyra respondenter kunde ge återkoppling. Prototypen presterade beundransvärt och kammade hem 3.8 stjärnor av 5 stjärnor. Dessvärre är testprovet för marginellt för att kunna dra några verkliga slutsatser.
Nyckelord
mHälsa, sport analys, apputveckling, skräddarsydda frågeformulär,
Acknowledgement
This paper is a result of a thesis project within the field of medical technology, at the Royal Institute of Technology, for the Swedish School of Sport and Health Sciences. I would like to thank everyone who assisted during this project. Thanks to the folks that signed up as testers and even more thanks to the testers who provided feedback. Special thanks to my mentor, Jonas Willén for his support, guidance, and suggestions during this project. Special thanks to Johnny Nilsson, as well, for his help in providing information and explanations regarding the questionnaire and its computer software.
Table of Contents
1 Introduction ... 1
1.1 Problem ... 1
1.2 Goals ... 1
1.3 Delimitations ... 2
2 Theory and background ... 3
2.1 eHealth and mHealth ... 3
2.2 Sports technology and sports analytics ... 5
2.3 Cost-effectiveness of mHealth ... 5
2.4 The Perceived Load and Fitness Scale ... 7
2.4.1 The scale’s specification ... 7
2.5 Technicalities of mobile apps ... 9
2.5.1 Platform ... 9 2.5.2 Language ... 10 2.5.3 Database ... 10 3 Method ... 11 3.1 Theoretical phase ... 11 3.2 Development phase ... 11 3.3 Evaluation phase ... 12 4 Results ... 14
4.1 The prototype – “eValuate” ... 14
4.1.1 User component – player section ... 14
4.1.2 User component – coach section ... 17
4.1.3 Database component ... 19
4.1.4 Miscellaneous component ... 21
4.2 Evaluate eValuate ... 22
5 Discussion ... 24
5.2 mHealth’s prospects ... 28
6 Conclusion ...30
7 Future work ...31
8 References ...32 Appendix A - HowTo……….. Appendix B - Mobile Application Rating Scale………..
1 Introduction
This section will briefly examine the problem that this thesis is compelled to find a solution for. It will introduce the initial goal(s) and sub-goal(s) that were defined for this thesis. Additionally, it will present the various delimitations that had to be set. 1.1 Problem
The ubiquity, and necessity, of smartphones [1] has led to a surge of mobile health applications (mHealth apps) development. Thus, health monitoring is a common occurrence amongst a substantial portion of the population. However, an exceedingly large portion of these mHealth apps utilize experiential stratagems as their foundation, [2,3] and thus output numbers that have little depth to the common end-user. These numbers are, nevertheless, a pivotal point for athletes and their coaches in assessing the athlete’s health and continued career. The analytical skills that these individuals possess helps them to determine the athlete’s current condition and prevent injuries. This is only possible due to their expertise in the field. The Swedish School of Sport and Health Sciences (GIH) is a sports and health-orientated school and an expert in this field.
The Perceived Load and Fitness Scale Questionnaire (PLFS-Q) is a questionnaire that aims to monitor and analyze an athlete’s health at four distinct categories. These categories pertain to the psychological domain, psychophysiological domain, physiological domain, and physiological-medical domain, and hence give a more in-depth analysis of the athlete’s overall condition. The PLFS-Q was created in a collaborative effort by GIH, Svenska Fotbollsförbundet (SvFF), and Föreningen
Svensk Elitfotboll (SEF). It is developed as a computer software, and thus it is limited
in its usability and availability. Therefore, to facilitate the monitoring and analysis, GIH has requested for a mobile version of the form.
1.2 Goals
To fulfill GIH’s request for a mobile version of the questionnaire, a specification sheet of the current computer version of the questionnaire was studied and a discourse was held with one of the members responsible for its creation. This was performed in order to define the necessary requirements for the mobile app. Consequently, the main goal that was established for this thesis is:
• Develop a mobile prototype of the PC-version of the Perceived Load and Fitness Scale Questionnaire system based on the defined sub-requirements. To meet the main goal, the prototype needs to implement the several functionality requirements, set by GIH, for both the athlete’s component of the app and the coach’s component of the app. The following requirements were identified:
Athlete’s component:
• Sign into a personal account as a team member under a coach’s supervision. • Be able to complete the Perceived Load and Fitness Scale Questionnaire. • View the result of the form in a table for a period of one year.
• View the result of the form in a diagram for a period of one year. Coach’s component:
• Sign into a personal account as a supervisor for a team.
• Manipulate athletes’ accounts, i.e. create, delete, and edit accounts. • View each athlete’s results of the form in a table for a period of one year. • View each athlete’s results of the form in a diagram for a period of one year. • View the whole team’s average score in a per-week table for a period of one
year.
• View the whole team’s average score in a per-week diagram for a period of one year.
Application component:
• Utilize a login system to differentiate between users and their data. • Notify the coach when an athlete completes the form.
• Notify the player when the coach creates an account for said player.
• Implement heart rate measurement functionality; either through Bluetooth and an external device or utilize the internal components.
• Store data such as accounts, account information, and athletes’ scores in a database.
• Implement a cloud-based database for proper synchronization. 1.3 Delimitations
Due to the nature of this project, time, and programming factors delimitations were set. The following delimitations are:
• The prototype will only support one mobile platform: Android with an API level of 23 (Marshmallow) and later will be supported.
• Resource management and app performance will not be optimized. • A rudimentary login system will be implemented initially.
• The cloud-based database will be deployed through a readily available service. • Software design guidelines and patterns will be ignored.
• Styling guidelines and recommendations will not be applied. • Non-breaking bugs and issues will not be addressed.
2 Theory and background
This section will comprehensively examine the problem area of this thesis. In sequential order, it will discuss the background of mHealth; its usage, design, and whether it is economically beneficial or not. After the background, a more in-depth explanation of the Perceived Load and Fitness Scale Questionnaire and its specification will be presented. Lastly, this section will give a general technical overview of simple mobile app development utilizing the most generic components of app development.
2.1 eHealth and mHealth
Technological advances have made it possible to integrate medical and healthcare practices into real-world uses [4]. The definition of electronic health (eHealth) is discussable; some use it as a specific term while others use it in a broader sense. However, scientists agree that it connects health with electronic and digital processes [4]. eHealth encompasses many aspects of the electronic-medical spectrum such as electronic health records, telesurgery, telemedicine, mobile health, and others. Nevertheless, the focus of this thesis is mHealth which is a fairly recent invention that incorporates health into mobile devices, [4–6] e.g. smartphones, tablets, and smartwatches. This invention makes it easier to monitor specific parameters of an individual’s health for either medical or personal purposes. Therefore, the ubiquity of smartphones has contributed to a significant rise in app development and usage [4,5,7] that focuses on fitness and well-being.
Smartphones are multi-feature devices with numerous built-in sensors [1,6]. The health-oriented apps use these various sensors to collect data [1]. For instance, the
Global Positioning System (GPS) is utilized to acquire data such as distance traveled
and speed [8,9]. The accelerometer is employed to fetch data such as change or force of movement [9,10]. This data is then processed through various algorithms to calculate the number of steps taken, calories burnt, distance traveled [8,9], and much more information. This information can give the end-user an insight into their health and help them to improve it [6,8,10]. Moreover, other types of apps exist that are not solely limited to the physical plane. For example, by using diverse types of questionnaires, patterns, and stratagems it is possible to collect data about the psyche [6,7]. This data can be used to calculate mood, current mental health, detect disorders [6], and much more. Basically, mHealth data is used for negative states intervention and positive states development and enhancement.
Studies have revealed that the most common types of monitoring systems that athletes employ are custom-designed self-reporting/-monitoring mHealth apps [2,3,7,11]. The coaching staff develops apps and questionnaires based on experiential stratagems in order to prevent injuries and streamline training [3]. Thus, the most generic form of layout these apps take are questionnaires, inclusive of neuromuscular practical tests [2,3,12], that consist of a few items which are graded
using the Likert scale point system [2,3]. Additionally, subjective data is the main focus of these questionnaires [2] whereas objective data is a supplement [3]. The reason for this is due to the superior sensitivity of the subjective data’s ability to reflect the athlete’s condition [2]. Furthermore, potential trends for negative states are reflected in the constant data collection and the analysis of it [2,3,13] through the app. In so doing, it is possible to create a time-efficient and concise mHealth app for the athlete.
Nonetheless, current research questions the coaches’ utilization of these apps [4,7] for valid reasons. Firstly, scientific evidence is rarely applied when such self-reporting mHealth monitoring apps are developed [3,4] by individual developers. A dearth of data and research exists that validates the utilized custom form’s efficacy as a monitoring system [3] in such apps. Secondly, the Recovery-Stress
Questionnaire (REST-Q) exists which is a form that is scientifically proven to be a
valid monitoring method [2,3]. However, coaches do not adopt it due to it being a time-consuming and broad form [3] for specific monitoring purposes. Nevertheless, shortened versions exist which would be more scientifically valid and provide reliable cross-references to wider exercise applications [2,3]. Lastly, while an abundance of such custom-designed forms exists, their authenticity as self-reporting monitoring systems has yet to be proven [2,3,7]. Rigorous research is required; however, coaches utilize various markers in their custom-designed forms, albeit with cut-off values, for negative states thresholds [2,3,7]. Nevertheless, they are confident in the form’s evaluation ability [3].
Notwithstanding the plethora of available mHealth apps, scientists argue about their efficacy and authenticity. Although it is a new-found invention, several studies have delved into this topic to confirm the plausibility of mobile health apps [7]. On one hand, Van Reijen et al have in a study established that injury intervention through an app is feasible and juxtaposed to traditional injury intervention through a booklet the difference is negligible [5]. On the other hand, Taylor et al have in a study concluded that the efficacy of health-orientated apps is questionable for the reason that most of them utilize experiential stratagems [2,3] instead of scientific literature supported ones. In contrast to these two studies, Payne et al reach the conclusion that the current research results are insufficient [7,14]. Hence, the research is inconclusive due to the lack of larger-scales studies [3] in this field and the recentness of mHealth. Therefore, scientists suggest that developers and medical- and health-educated personnel collaborate to lay a scientific evident foundation for such apps [7,14].
2.2 Sports technology and sports analytics
In professional sports, the data collection is so extensive that the coaches have difficulty utilizing a significant portion of it [9]. Sports analytics is a vast spectrum of data analysis that ranges from video information analysis to mHealth related information analysis [9]. For example, mHealth apps may be utilized in professional football to acquire GPS-related data, [8] and thus determine the player’s optimal time on the field given their current condition [9]. This data is ultimately used as a factor in key decision-making, injury intervention and prevention, athlete or team development, and more [9]. Moreover, technologically innovating the sport, sports technology, is factualizing that half of the reason for future success on the field will be due to data and technological advancements [9,15]. A tool for this is data reliant non-human decision makers; however, this is currently an unresolved and debated topic [15].
Despite the abundance of data and technology, coaches are rather adamant about using their intuition and experience over it [9]. A reason for this may be due to the high costs of analytical tools and technology [9]. However, studies have shown that sports analytics and sports technology contribute to success and higher injury intervention and prevention. For instance, AC Milan’s MilanLab, a health analytical and research center, has contributed to a 90% reduction in player injuries [9]. 2.3 Cost-effectiveness of mHealth
Sports- and exercise-related injuries are a natural phenomenon for athletes, and thus incur a high societal and individual cost. Million dollar lawsuits have been filed against sports governing bodies due to athletes receiving permanent symptoms and are forced to retire prematurely [13]. For instance, in professional sports, such as basketball, a significant portion of player time was lost to injuries which cost the club $600 million in salaries [9]. A study has revealed that a medium percentage of the increasing concussion-related emergency room (ER) visits, due to sports, are non-urgent [4]. This detrimentally affects the hospital due to overuse of the ER which may also contribute to the risk of infections and overtreatment [4]. Additionally, these non-urgent visits have an economic impact on a societal and individual level. Another study has revealed that the societal costs for medical treatment of ankle sprains justified preventive measures [5]. 4.5 million injuries struck an active populace of 12 million where two-fifths of them warranted medical attention [5]. The calculated cost of this treatment was €520 million [5].
The ubiquity of mHealth apps may suggest that health-related costs could be reduced. Dissemination of such views is marginally misleading, for now, according to current studies. Although a scarcity of such studies are available [5], scientists have tested this theory and found comparable results. In an economic analysis, Van Reijen et al juxtaposed injury intervention through an app and a booklet to review
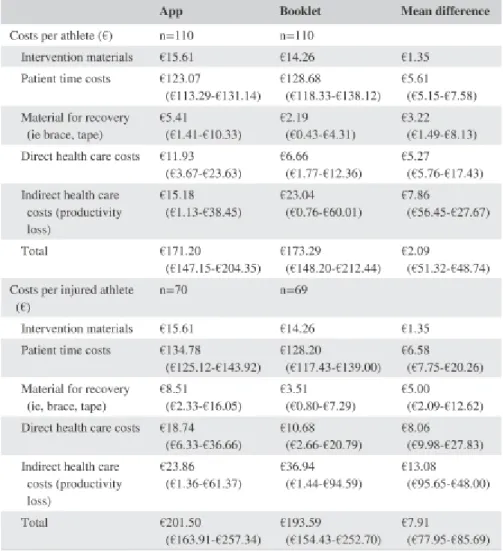
this theory. The findings indicated that the cost-effectiveness between these two intervention methods was negligible [5]. The app’s development was twice as expensive as the booklet’s; however, the price per unit might differ in the future [5]. Moreover, an app can be updated whereas a new booklet must be printed if an updated version is to be released [5]. Thus, no significant cost-effectiveness can be ascertained on a societal [5] or individual level as per table 1.
Table 1. Cost differences. Mean costs (€) per athlete and per injured athlete for the various cost categories during 1- y follow- up. Values are expressed as mean (95% confidence interval). Cost differences are calculated with the App group as the reference [5].
Similarly, Nelson et al reviewed this theory in an economic analysis of an app for acute stroke intervention where medical personnel are scarce [16]. The findings indicated that while the up-front fixed costs were large, the long-term costs were rather cost-effective [16]. If equipment costs and reimbursement rates could be reduced, the app would be more cost-effective [16]. Thus, at this moment, no major cost-effectiveness can be determined.
It is of paramount importance to note that both of the aforementioned studies analyzed apps with scientific literature supported evidence as their foundation. Thus, their cost-effectiveness could be determined as positive in the long run. The same may not apply to apps that have arbitrary or experiential evidence as their foundation.
2.4 The Perceived Load and Fitness Scale
An obvious problem in elite sports, especially metabolic demanding ones, is the potential risk of overtraining. Football is such a sport. Nonetheless, most coaches are aware of this problem and try to manage it through different means, e.g. by having variations in training intensity and quantity with strategically scheduled recovery periods.
A great amount of research has been done, in this area, to find a suitable marker for overtraining [3,7]. For instance, various forms of blood testing for biomarkers (biochemical) such as creatine kinase (CK) [2], testosterone, and cortisol have been tried as markers, however, yielding insufficient results [3]. Furthermore, this type of marker detection is time-consuming and economically unviable [2,3] considering the number of players a team consists of and how frequently the testing has to occur. Thus, at the current moment, the research has not been able to acquire a valid diagnostic marker [3].
Therefore, the question is whether simpler instruments could be developed for this case [3,7]. For example, based on the player’s experiences and the coach’s overall analysis supplemented with simple measurement a marker for risk of overtraining can be acquired [2,3,7]. In so doing, an efficient custom-designed questionnaire can be created [2]. However, this type of instrument should not be interpreted slavishly, but serve as a complement for the coach’s knowledge and observations of the player [3].
As a result, the Perceived Load and Fitness Scale (PLFS-Q) was created with the aim to provide, in combination with the coach’s analysis, a simple and affordable marker to prevent overtraining.
2.4.1 The scale’s specification
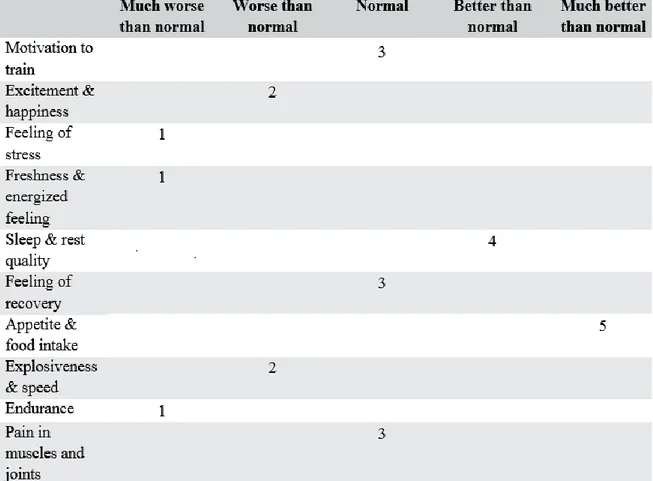
The scale consists of ten subjective key questions, as per table 2, which are split into four different health categories. Questions 1 – 4 delve into the psychological domain. Questions 3 – 7 deal with the psychophysiological factors. Questions 8 – 9 discuss the physiological aspect. Question 10 considers the physiological-medical variables. Questions 1 – 9 are summed into a total score. A total score of less than 18p should start a warning signal and a score of less than 14p should be considered alarming, especially if it recurs during a few weeks of light training. Moreover, each category’s score can be summed. In so doing, it is possible to determine if the cause lies in the
psychological plane or the physiological plane. However, lasting muscle and joint pain, that cannot be categorized as trauma, should be investigated.
Table 2. The Perceived Load and Fitness Scale Questionnaire. There are five possible answers. Normal corresponds to 3 points. Much worse than normal and worse than normal corresponds to 1 and 2 points, respectively. Better than normal and much better than normal corresponds to 4 and 5 points, respectively.
Furthermore, the scale has five more questions which are shown in table 3. These are optional and complementary, and collect objective data such as weight, resting heart rate, orthostatic pulse, handgrip strength, and countermovement jump height. This objective data should serve as a supplement to the analysis of the subjective data. Increased resting heart rate, orthostatic pulse, and weight combined with decreased handgrip strength, and countermovement jump height should raise suspicion of overtraining, infection, or other negative states.
Table 3: The Perceived Load and Fitness Scale Questionnaire. There are five optional questions. The changes in these values can raise suspicion of negative health states.
How to measure for these questions is simple. Weight is measured using a scale. Resting heart rate is measured at the individual’s most relaxed state, e.g. after waking up or after a few minutes of rest. Orthostatic pulse is measured immediately after the individual goes from a laying position to a sitting position. Handgrip strength is measured using a dynamometer and the act of clenching the hand. Countermovement jump height is measured using, e.g. contact mats, force platforms, and accelerometers and is the act of jumping straight up with, or without, the use of the arm-swing.
2.5 Technicalities of mobile apps
The most commonly used platforms for mobile app development are Android, with a userbase of 2 billion devices and counting in 2017 [1], and iOS, with 1.4 billion devices in 2019. Other, less known, platforms exist; however, they have a low userbase and some are even discontinued. Each platform requires the mobile app to be written in a certain programming language when developing for them. For Android, it is a choice between Java and Kotlin while for iOS, it is a choice between
Swift and Objective-C. Additionally, for an app to function as intended, it requires a
database where it is able to save, access, and manipulate information. There are free databases, paid databases, free services to create custom databases, and paid services to create custom databases. For instance, Amazon and Microsoft offer free and paid services to create custom databases depending on the app’s requirements. Google offers readily available databases that have a storage limit free of charge but can be upgraded for a fee.
2.5.1 Platform
As of 2005, Android has been a proprietary software of Google. Google releases one major platform update yearly [1] with security patches and bug fixes throughout the year.
The Android operating system (OS) is an open-source project with numerous contributors. The OS utilizes a modified version of the Linux kernel, [1] as its foundation, inclusive of multiple open-source software. Everything in Android, whether it be system, bundled, or third-party apps is written with the same
Application Program Interface (API) which features Bluetooth, maps, notifications,
relational databases, and much more [1]. Consequently, this makes it possible to use third-party apps instead of the default system ones. Furthermore, due to Android’s open-source nature, it is possible to create apps that are designed to function, look, and feel as imagined [1]. This has led to an expansion and a divergence in Android’s ecosystem which makes Android available on smartphones, tablets, TVs, watches, Internet of Things (IoT), and even in automobiles [1]. There are no mandatory fees for development or distribution of Android apps. Hence, Android has a flourishing developer community and is excellently documented.
2.5.2 Language
As of 2010, the programming language Java has been a proprietary software of
Oracle [17]. It is available in three editions: Java SE for client-side applications, Java EE for server-side applications, and Java ME for mobile applications [17].
Java is an extremely popular, general-purpose, and full-featured object-oriented programming language. The Java Virtual Machine (JVM), which exists in a variety of hardware and software, interprets the Java source code into Java bytecode [17]. In so doing, Java becomes portable, and thus it receives the unique attribute of being “written once and run anywhere” [17]. Java is a robust and battle-tested programming language with the default API containing an increasing pool of predefined interfaces and classes to simplify development [17]. Furthermore, external dependencies, which are packaged as Java Archives (JAR) files, can be used to introduce additional features. Build automation tools, e.g. Gradle or Maven can be used to manage external dependencies. When it comes to Android app development with Java, each app is executed through the Android Run Time (ART) which manages the memory and process resources [1].
2.5.3 Database
Google offers a few choices of databases depending on the developer’s requirements.
Cloud Firebase is the most popular one for app development with Cloud Firebase Firestore being the recommended choice.
Cloud Firebase Firestore is a cloud-native and fully managed NoSQL database that uses documents and collections [18,19]. It is a fast and feature-rich database that simplifies querying, synchronizing, and storing data. It allows for the data to be sophisticatedly queried [18,19] which gives the developer leeway in structuring the data, and thus effectuate efficient data usage. Moreover, it does not require an intermediary server for data access; [18] hence, it is a serverless solution. Firestore has a unique scaling solution [18,19] where the database grows automatically as the data grows. Additional features such as ACID (atomicity, consistency, isolation, durability) transactions, offline support, and live synchronization are integrated [18] to further simplify development. In online mode, data changes on the back-end are updated in real-time on the front-end. In offline mode, the local cache is leveraged to store the data changes and serve them for synchronization when the client is online [18]. In so doing, developing responsive and collaborative multi-user apps, that can even synchronize with individual users irrespective of network status, becomes an easier feat.
3 Method
This section will discuss the methods used to achieve the defined goals for this thesis. It consists of three phases: the theoretical pre-study phase, the developmental phase, and the evaluation phase. The first phase contributed to the acquisition of the right tools for app development. The second and third phases will discuss how the app was developed and evaluated, respectively.
3.1 Theoretical phase
Initially, during the theoretical pre-study phase, several literary studies were conducted for multiple reasons. One of the reasons for this was to establish a suitable procedure for when structuring the app and the data. Another reason for this was to identify a suitable approach for the overall app design. This was accomplished through analyzing various works that focus on app development, but also various apps in general. This analysis, therefore, became a factor in assessing in which way broad subjects such as front-end, user experience (UX), and back-end could be utilized in the task of developing an app. Hence, this was the basis for determining the most optimal procedure for the developmental phase.
Additionally, an analysis of the current PC-version of the questionnaire system was performed. This was accomplished through researching the structure and setup of the system. Thus, to determine the feasibility of porting this system to mobile, an analysis was carried out. However, due to the unavailability of the PC-version’s source code, the app had to be developed from scratch with the system’s specification sheet as the only guidance. Nonetheless, the analysis yielded sufficient results which contributed to the base procedure of the development phase. Hence, the decision-making process of choosing the app’s components became a much simpler task. 3.2 Development phase
Qualitative choices, concerning the app’s structure and the database’s structure, could be made in the development phase due to the rigorous research done in the theoretical phase. The choice fell on developing the app for the Android platform for reasons mentioned in subsection 2.4.1. Consequently, an Integrated Development
Environment (IDE) for Android had to be chosen. The options were between
Android Studio by Google and IntelliJ IDEA by JetBrains; however, the choice was clear due to Android Studio’s specialization towards Android. Moreover, pertaining to the database, Cloud Firebase Firestore was the optimal choice as a database solution for reasons mentioned in subsection 2.4.3. Java was also chosen as the programming language for the app for reasons mentioned in subsection 2.4.2 and the author’s previous experience with it. Additionally, a major factor for the choice of these components, Java excluded, was the fact that they are all proprietary software of Google. Hence, seamless integration and interaction of these components became a simple feat.
The development of the app followed a simple iterative development pattern which is illustrated in figure 1.
Figure 1: The recursive development pattern. The pattern consists of a research phase, an implementation phase, and a verification phase.
The research concerned components and their functions for the design and structure of the app and database. Various Extensible Markup Language (XML) components were investigated, different Java to XML utilization methods were researched, and how it all integrates and interacts with the database. For instance, the EditText XML component was researched to gain knowledge of its broad functionality and usage, but also how to acquire and work with the data from the XML component with Java, to ultimately have it interact with the database.
The results of the research were then implemented through the usage of the programming language Java. However, some components of the app required additional setup to be implemented and utilized properly. This was accomplished by adding their dependencies by means of utilizing the build automation tool Gradle. For example, to be able to use the Cloud Firebase Firestore database, its dependencies must be added to Gradle.
The implementation had to be verified to ascertain whether the component was implemented correctly and would work as intended or not. This was achieved through running the app via the built-in emulator in Android Studio and rigorously testing the component. If the testing yielded satisfactory results, then this process would be repeated for the next new component. However, if the testing yielded unsatisfactory results, then debugging was performed with additional research and tweaking of the component implementation until it worked as intended. In so doing, it was possible to develop the app as per the defined goals in subsection 1.3.
3.3 Evaluation phase
Ultimately, to confirm whether the prototype fulfills the defined criteria or not, it had to be carefully scrutinized. However, few evaluation methods exist and even fewer are scientifically proven to be valid [20] or credible. The existing evaluation schemes are either too general, too complex, too time-consuming, or exclusive to a specific health domain [20]. Therefore, a study took it upon itself to find a reliable and consistent mHealth evaluation criteria scheme, and thus produced the Mobile App
yielded over 300 criteria which were grouped into four categories by an expert panel of developers and health professionals and then applied in real-world tests [20]. The results of the MARS tests were satisfactory when parallelly contrasted to the current highly rated mHealth apps of quality [20].
As aforementioned, the Mobile App Rating Scale is divided into four categories whose purpose will be to highlight the strengths and weaknesses of the app [20]. These categories evaluate the app’s engagement levels, its functionality, its aesthetics, and its information quality [20]. A category for subjective data also exists [20]. MARS utilizes the Likert scale point system to calculate the score. The total mean score of the MARS gives an overview of the overall app quality. The MARS will be applied when evaluating the Perceived Load and Fitness Scale Questionnaire mobile prototype app. Afterwards, both the MARS and the PLFS-Q prototype will be sent to GIH and others for testing and evaluation purposes to assess whether the prototype fulfills the defined criteria or not. Hence, a small-scale study will be performed. A number of individuals, with distinct backgrounds, were recruited to make up the testing panel. For the GIH testers, they would consist of coaches and their respective teams and the testing would last up to two weeks due to them being the targeted audience of the PLFS-Q app. For the other testers, their background ranged from civilians to developers and the testing would last up to 48 hours. Testing would be performed in a simple manner, i.e. each user would perform the MARS after verifying that all the necessary functionality is implemented. How this is accomplished is left to the user’s discretion. In so doing, it will be possible to acquire quantitative data about how well the prototype app reflects GIH’s request and the predefined goals.
4 Results
This section will investigate the results achieved by utilizing the aforementioned methodology in subsections 3.1 – 3.3 to meet the goals defined in subsection 1.2 for this thesis. It consists of two phases: the practical phase and the evaluation phase. In the former phase, the finished prototype will be exhaustively reviewed whilst in the latter phase, the results of the Mobile Application Rating Scale survey will be presented.
4.1 The prototype – “eValuate”
eValuate is a sports analytics mHealth application that implements the Perceived
Load and Fitness Scale Questionnaire as a tool for overtraining prevention and intervention. In spite of the fact that it is a prototype in its pilot stages, it is, nevertheless, a fully functioning mobile prototype version of its PC equivalent. The app features all of the necessary functions and components required to satisfy GIH’s request and the criteria defined at the beginning of this thesis. The prototype consists of three main components: the user component which is split into a coach and player component, the questionnaire component, and the database component. Additional background components are also implemented in order to integrate the three previously mentioned components into a coherent entity.
4.1.1 User component – player section
The player component is rather simple in its design and has a minimalistic graphical user interface. Three different screens compose the entire component and few navigation options exist as per figure 2. In so doing, the component becomes monkey-proof against all potential user errors, yet efficient and task-focused. To simplify matters further, the questionnaire component is directly integrated into the player component and consists of two additional screens. Hence, the player component allows for two functions: answering the questionnaire and viewing the statistics.
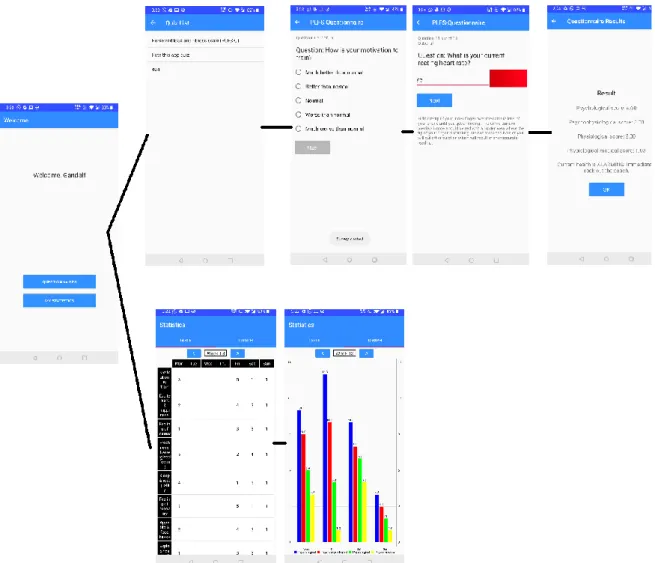
Figure 2: The player component including the PLFS-Q. The navigation flow is visualized for all of the available screens in the component.
The first screen of the player component is a simple greeting screen with two buttons, thus, allowing for two functions: go to the questionnaire and view the statistics. Consequently, following the questionnaire route will launch a screen that enables the user to choose a questionnaire, and thus gain access to the Perceived Load and Fitness Scale Questionnaire and other questionnaires. The PLFS-Q component follows the same design throughout all of the questions; questions 1 – 10 are closed-ended and require the user to choose one of the predefined answers before being able to proceed. Questions 11 – 15 are optional open-ended questions. The results of the questionnaire are then summarized in the following screen. The ability to choose a questionnaire is an additional feature; although this feature currently only supports the PLFS-Q, it shows that the prototype has room for growth and is not a one-dimensional application. In contrast, the viewing statistics route will display a seven-day table or diagram with the results of the PLFS-Q for each completed seven-day. This screen has the function to switch between weeks, and thus an overview of the player’s
statistical changes can be visualized. It is also possible to switch between viewing the statistics in a table and a diagram, on this screen, by swiping left and right.
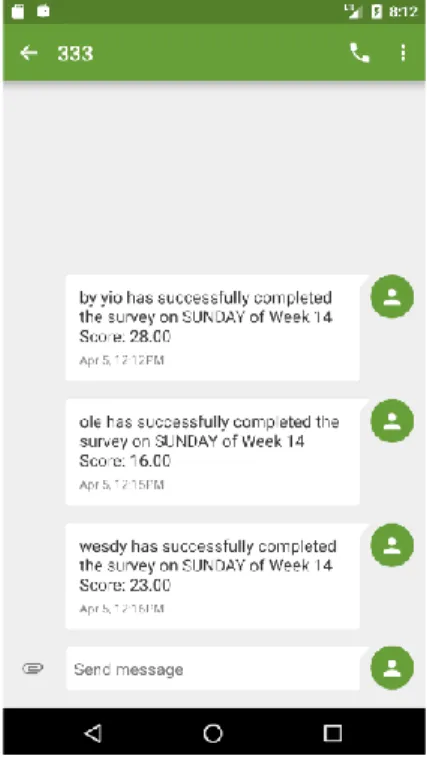
Figure 3: Notification for the coach. Receives an SMS upon questionnaire completion through the built-in SMSManager class.
Furthermore, a simple notification system is implemented into the questionnaire component of the player component. The notification system utilizes the Android built-in messaging system as a communicative tool between the player component and the coach component. In so doing, the system fetches the coach’s phone number from the database and sends a simple SMS message to the coach with specific information as per figure 3. This process is done in the background; consequently, no additional messaging screens are launched. Thus, upon completion of the Perceived Load and Fitness Scale Questionnaire, the coach will receive an SMS with information about which player completed the form, on which week and day, and how much they scored.
Additionally, a basic heart rate monitor is implemented into the questionnaire component of the player component. The heart rate monitor utilizes the camera and the flashlight to capture the heartbeat from the user’s finger. In so doing, it fetches the latest frame from the camera.PreviewCallback function and processes the YUV420SP data to extract all the red pixel values. An algorithm smooths the data in an integer array to calculate the average red pixel value. The monitor then compares the average value with the newly captured value and calculates a beat if the new value is greater than the average value. Thus, after some seconds, the user’s heartbeat will be displayed.
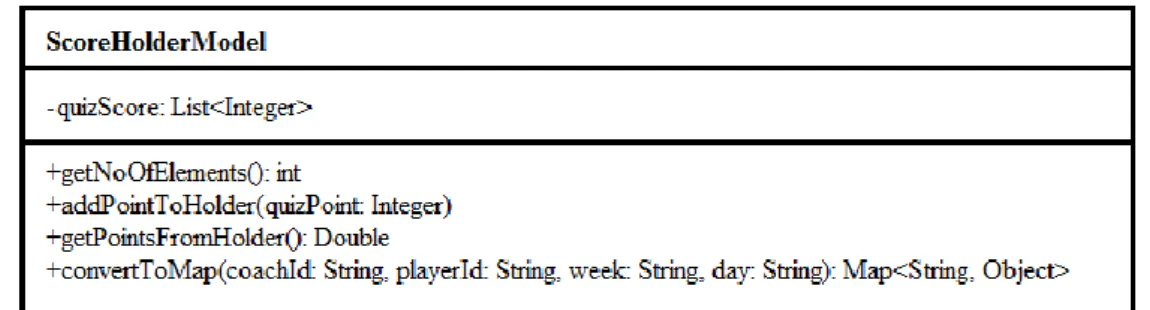
Figure 4: ScoreHolderModel class. A temporary storage and data manipulation class that is utilized in the player component.
A custom Java class is responsible for the temporary storage and manipulation of the Perceived Load and Fitness Scale Questionnaire points and point system as per figure 4. An ArrayList is utilized for this due to its superior built-in methods. Moreover, various methods are implemented in the class for score calculation and division into the distinct categories of the questionnaire, but also for simple arithmetic work on the ArrayList. Furthermore, a specific method is implemented that transforms the ArrayList into a Map-object. In so doing, it becomes possible to store the data in the database for the reason that the Cloud Firebase Firestore database accepts either Map-objects or class-objects. Hence, the ArrayList needs to be transformed into a Map.
4.1.2 User component – coach section
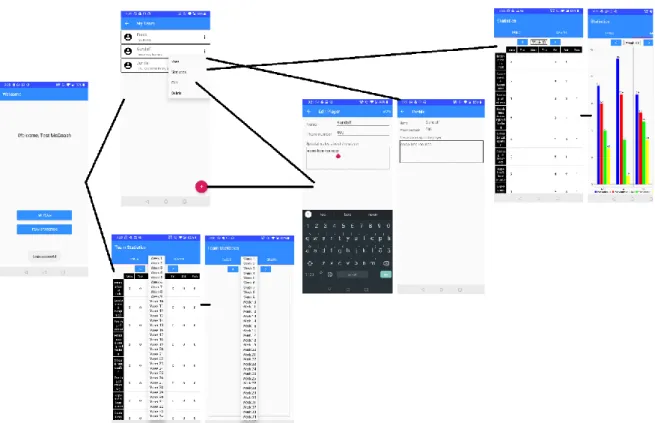
The coach component is of a more complex design; however, it also features a minimalistic graphical interface. Six different screens compose the entire component, where one of them utilizes a player component screen, and few navigation options exist as well as per figure 5. In so doing, the component becomes less complex for the user, yet efficient and task-orientated. This particular component has awareness of the player component, i.e. it can manipulate the component to some degree. The coach component allows for six functions: creating, deleting, editing, and viewing a player’s profile, but also viewing a player’s statistics and the whole team’s average statistics.
Figure 5: The coach component. The navigation flow is visualized for all of the available screens in the component.
The first screen of the coach component is a simple greeting screen with two buttons, thus, allowing for two functions: go to the team list and view the team’s statistics. Consequently, following the team list route will launch a screen where all players supervised by the coach are displayed. An overflow button (triple dot) is available for each player which allows the coach to manipulate the selected player. In so doing, the overflow button simplifies the complexity and minimizes the navigational steps. Four options are displayed in the overflow popup: view player’s profile, view player’s statistics, edit player’s profile, and delete player. The view profile option launches a screen that displays information about the player while the edit option launches the same screen, but it also grants the coach the ability to edit said information. The statistics option launches the statistics screen available in the player component and the delete option simply deletes the selected player and their scores. Moreover, an add button also exists in the team list screen that allows the coach to register players with specifically inserted information. In contrast, the view team statistics route will display a replica of the player statistics screen, however, with the average summed results of the Perceived Load and Fitness Scale Questionnaire for all of the existing players. This screen also features the functions to switch between weeks and switch between table and diagram, and thus an overview of the team’s statistical changes can be visualized.
Furthermore, similarly to the player component, a notification system is implemented into the coach component. The notification system is a replica of the one found in the player component, however, with a few slight modifications. This notification system is integrated into the create player screen, and thus it will only fire upon registering a new player. In so doing, the system fetches the newly registered player’s phone number from the database and sends a simple SMS message to said player with specific information. Thus, upon registration, the player will receive an SMS with their login credentials.
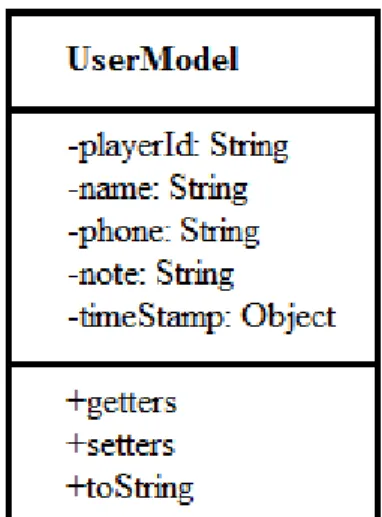
Figure 6: UserModel class. An account/profile class that is utilized in the coach component.
A custom Plain Old Java Object (POJO) class is responsible for the player account as per figure 6. It utilizes Strings as the simplest and most standard form of text manipulation. Moreover, methods for retrieving and inserting texts are implemented. Thus, this class allows for creating and editing player profiles by acting as the middleman between the database and the Android application. Additionally, due to no intricate manipulation work being done on the texts, it becomes possible to directly store this class to the database as a class-object.
4.1.3 Database component
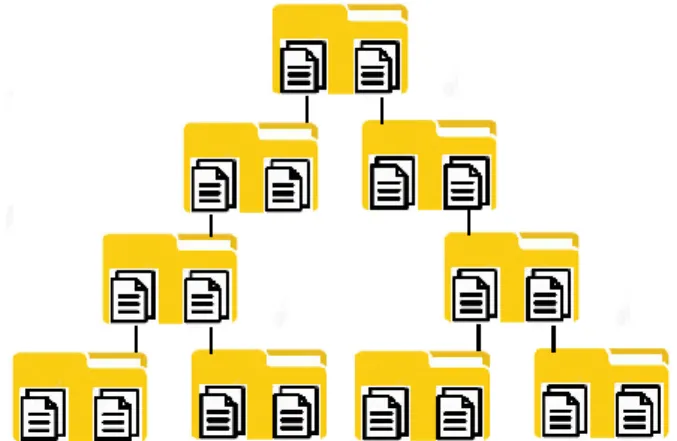
The Cloud Firebase Firestore database utilizes collections and documents as a means of storing various data. The storage concept may seem quite abstract; however, it can easily be explained in layman’s terms and is visualized in figure 7. A collection can be thought of as a simple folder that can contain multiple documents. A document, as the name may imply, can be seen as a sheet of paper with various information written in it. Additionally, a document may also possess a collection, and in so doing it becomes possible to create a nested and hierarchically structured database. This concept is more preferable than the standard table concept as it minimizes the programming complexity of the database and allows for more flexibility.
Figure 7: The database concept. The database concept visualized as described in layman’s terms.
The database is structured according to the setup of the components. The coach section of the database has an extremely simplistic setup. A root collection, referred to as the institute GIH, contains coach documents, i.e. information about the coach such as an identification key, a name, and a phone number. The coach document, in turn, has a collection that contains all its player documents. Henceforth, the more complex player section of the database begins. The player document contains information about the player such as an identification key, a name, a phone number, and notes. This document has a collection for the player’s scores. The score collection is divided into documents of weeks that, in turn, contain a collection of days. This collection contains documents that reveal the results of the Perceived Load and Fitness Scale Questionnaire. A complete schematic of the database is presented in figure 8.
Figure 8: The database. The database is visualized with both sections.
The Cloud Firebase Firestore database, unlike many other databases, has the unique attribute of being shallow. This means that any data can be queried as long as a reference to it is provided, i.e. the entire data structural path is unnecessary. To query data for the individual player’s statistics, the full path is, however, necessary. The full path contains vital information about the data structure such as which player and week this querying will pertain to; hence, it is necessary for the components’ functionality to display the desired statistics. However, the full path is not utilized in the case of the team’s total average statistics. As of writing this thesis, Firestore does not yet support the ability to query all documents in a sub-collection for all
documents in the parent-collection, and thus querying for all results for all players is impossible. Hence, utilizing the full path is ineffective. Therefore, a different approach had to be taken. A function by the name of collectionGroup is available in the Firestore Software Development Kit (SDK). This function grants the ability to query the database for all collections with the same identification name. Utilizing this function allowed to query for all existing scores, regardless of the signed in coach, in the database and by filtering the results it became possible to extract the desired data. However, in order to filter the data accordingly, additional information is inserted into the score documents such as who the coach of this player is and which week and day it was created.
4.1.4 Miscellaneous component
Figure 9: Login screen. The login screen allows for hierarchically structured components.
In order to seamlessly integrate the three aforementioned components, an account system with individualized accounts per user is deployed. Currently, to utilize the Perceived Load and Fitness Scale Questionnaire system, two different accounts are implemented: the player account and the coach account. A login system was, thus, implemented as shown in figure 9. In so doing, it becomes possible to separate the components and structure the prototype and database accordingly. Hence, the ability to hierarchically structure the account system is granted, i.e. the coach account has superiority over the player account. This approach allows for the coach account to manipulate its player accounts. On app launch, the login screen is displayed each time for the reason that no token for remembering the signed in user was implemented. This was done for two reasons. Firstly, it simplifies the testing and debugging procedures while the prototype is still in its pilot stages. Secondly, this ensures that no unauthorized tampering can occur which is especially important in case of the coach component.
Figure 10: Login screen code. A sample of the code of the query.
Despite the fact that the login screen is simple, its process is more intricate as figure 10 illustrates. A direct connection to the database is established during the sign in procedure. The background process extracts the inserted identification code and queries it against the database. A collectionGroup query is utilized in this component as well and it queries for all players in the database when a player attempts to sign in. However, a simple query is utilized for when the coach attempts to sign in for the reason that all coaches are currently stored in the same collection. In case of a match, the corresponding component will be launched, i.e. a coach identification key will launch the coach component and vice versa. However, as feedback to the user, an error message will be displayed if there is a mismatch during the query.
4.2 Evaluate eValuate
A small-scale study was performed to rigorously evaluate how the prototype reflects the defined criteria and GIH’s request. The Mobile App Rating Scale was utilized as the most appropriate means of evaluation form; however, general testing of the prototype was also performed. A panel of n = 13 individuals with distinct backgrounds, ranging from developers to health professionals and teachers to students but also civilians, made up the testing team. Due to the testing panel’s various backgrounds, the testing period had different lengths. For civilians, depending on their interest and technological proficiency, the testing period lasted between a few minutes to 48 hours. The reason for this is that some testers only casually confirmed the prototype’s functionality in contrast to the criteria while others wished to dissect the prototype to ensure full compliance with the criteria. For
the non-civilian testers, the testing period lasted up to two weeks. Hence, a full evaluation was performed, and thus feedback was acquired through the MARS. Nonetheless, out of the n testers, only four completed the Mobile App Rating Scale survey. The reason for this is due to the panel’s expertise. The panel was filtered out and only those with the appropriate background were allowed to perform the MARS. An all-around assessment of the prototype was desired, and thus a developer, a teacher, a health professional, and a student were filtered out as the appropriate backgrounds. Hence, some qualitative feedback could also be acquired; however, by word of mouth the prototype was overall well received.
“Överlag ser appen riktigt trevlig ut. Jag och Johnny satt tillsammans och titta närmare på hur appen fungerar och vad man kunde göra. Sms fungerade riktigt bra och enkelt att logga in och börja använda appen.” – Jonas Willén, PhD, Royal Institute of Technology, KTH, Department of Biomedical Engineering and Health Systems.
The results of the MARS were also positive on most sections as presented in chart 1. In the engagement section, the app scored 3.2 stars from tester one, 3 stars from tester two, 3.4 stars from tester three, and 3.2 stars from tester four with a total mean score of 3.2 stars out of 5 stars. In the functionality section, the app scored 3.75 stars from tester one, 4.5 stars from tester two, 4 stars from tester three, and 5 stars from tester four with a total mean score of 4.3 out of 5 stars. In the aesthetics section, the app scored 3 stars from tester one, 3.3 stars from tester two, 4.3 stars from tester three, and 3 stars from tester four with a total mean score of 3.4 out of 5 stars. In the information quality section, the app scored 4.25 stars from tester one, 4.5 stars from tester two, 4.5 stars from tester three, and 4.25 stars from tester four with a total mean score of 4.3 out of 5 stars. Overall, the app received a total mean score of 3.8 which is satisfactory considering that it is a prototype in its pilot stages. On the subjective questions, the testers also ticked in the box for recommending the app to others and paying for it.
Chart 1. MARS rating. Displays the mean scored MARS values for each section. 0 1 2 3 4 5 6
Engagement Functionality Aesthetics Information
Rating
5 Discussion
This section will discuss the results that this thesis concluded. The discussion will be split into two parts: the discussion of the prototype and the discussion of mHealth in general. In the first part, it will discuss the app and the development of it. In addition to that, it will also address the evaluation results of the prototype. In the second part, it will discuss mHealth in general and its effect as a (sports) analytics tool.
5.1 eValuate evaluated
The small-scale study could not be fully performed due to unforeseen events. Initially, the idea was to have a few coaches and their respective teams test the prototype for a period of time and then complete the Mobile App Rating Scale survey. In so doing, it would provide qualitative feedback from the targeted audience of the Perceived Load and Fitness Scale Questionnaire prototype. However, the current acquired feedback reflects the strengths and weaknesses of the prototype adequately. Out of the four sections of the MARS survey, the engagement section and the aesthetics section had the lowest scores while the functionality section and the information quality section had the highest scores.
The engagement section concerned itself with questions regarding entertainment, customization, interactivity, and such. The total mean score for this section was 3.2 stars. This score can be a consequence of multiple issues; however, one issue stands out the most. The prototype is barebones, as the figures show and the word prototype may suggest, i.e. it only has the necessary functionality it needs to meet the defined criteria. There are no additional features implemented that could give the user the ability to customize or change the app’s design and behavior. There are also no other interactive elements, besides buttons, input boxes, and the occasional notification, that could make the app interact with the user more. Moreover, the prototype has no strategies to make it “fun” to use by utilizing game-like patterns or similarly. It is strictly a tool for displaying statistics, in a table and a diagram, and answering the Perceived Load and Fitness Scale Questionnaire. Hence, the app is “as is” out of the box as a pure “informative tool”. Nonetheless, the prototype tries to be as engaging as possible with respect to its purpose, content, and targeted audience. It has multiple feedback messages, in the form of Toasts, that are displayed when the user triggers specific events on certain screens. There are also error messages that can be triggered when the user performs illegal actions. However, there is room for improvement.
The aesthetics section concerned itself with questions regarding layout, graphics, visual appeal, and the like. The total mean score for this section was 3.4 stars. This score can be a consequence of multiple issues; however, two issues stand out the most. Firstly, the prototype may be lackluster in the overall design department. There are only a few colors utilized in the app with the exception being the diagram,
which is multicolor, and only one color scheme is available. The icons, buttons, and other interactive elements may be inappropriately sized and misplaced as well in regard to the other elements on the screen. Furthermore, there is a fundamental lack of animations in the prototype. All elements, whether it be buttons or texts, are static with the exception being the navigation between the various screens. Secondly, aesthetics is an extremely subjective matter. It is, therefore, difficult to judge how well-received a design will be; some may find it compelling while others do not. It is a matter of each individual’s preferences. Nevertheless, the prototype’s design was designed with these factors in mind to simplify its usage and enhance intuitiveness. Hence, the design is minimalistic. The choice of colors and color scheme, texts and button sizes were made in such a way that consistency would be ensured on all the various screens. In so doing, the prototype would be less cluttered and as neutral, aesthetically speaking, as possible which is reflected in its slightly positive score. However, room for improvement exists.
The functionality section concerned itself with questions regarding performance, ease of use, navigation, and similarly. The total mean score for this section was 4.3 stars. This score is relatively satisfactory, but there may be a few minor issues; however, two key issues exist. The first major issue was that there were multiple inquiries from the testers on how to install the app and some of them even had issues installing it. Instructions regarding this issue were provided; however, the issue seems to be of the technical sort. The reason that some testers could not install the prototype despite the provided instructions is unknown and neither could it be debugged due to unavailable access to the testers’ phones.
“Den uppdaterade appen är kryssmarkerad i min Android så jag kan inte öppna den.” – Johnny Nilsson, Swedish School of Sport and Health Sciences, GIH, Department of Sport and Health Sciences.
Furthermore, no official testing method was utilized when verifying the prototype’s overall functionality, e.g. writing espresso tests. This may explain why and how this issue could have stayed undetected. However, this may also be an issue of manually installing the app. Notwithstanding this issue, the prototype does support older phones that run Android with API level 23 and has been tested on multiple devices by renowned manufacturers. Thus, this issue is unsolved until it can be debugged with the specific phone.
In addition to this issue, two minor inquiries regarding the login system and the database were made by the testers. An issue with switching users/signing out was experienced and that the results of the questionnaire could not be manipulated. The testers wished to navigate to the login screen and also be able to edit their answers in case they mistakenly answered incorrectly. Instructions on how to accomplish the former were provided and for the latter, it was deemed illogical upon further discussion with GIH.
”Dock, det som var ganska svårt och som skulle behöva ändras om det går, är någon lösning som gör att det går att komma tillbaka till inloggning på ett enkelt sett. Nu när man måste klicka sig fram och tillbaka mellan olika sidor blir det lätt förvirrande.
Om någon skulle skriva eller mata in fel hur lätt är det att komma åt och ändra datat? Går det att komma åt och ändra direkt via firebase eller måste man ändra i applikationen för coachen för att göra ändringar om någon har skrivit in fel?” – Johnny and Jonas.
However, upon further investigation, it was found out that the prototype was not as monkey-proof as it was made out to be. The two testers have collaborated on a single phone to casually test the app. This is illegal and countermeasures were designed for this, hence the issue. No “sign out”-button was implemented, and neither are there any tokens saved that would remember the user. In so doing, this would force the user to close the app and reopen it, and thus effectively restarting it. This is done for security reasons to disallow any unauthorized tampering. Similarly, editing the score is not possible through the app and was designed as such. The flaw: that users could potentially edit their scores to gain better results is high and was explained to GIH. However, the questionnaire can be retaken until midnight on the same day, and thus overwrite the old scores. After midnight, any new scores are registered on the next day. Additionally, if required, the user can request that the database administrator edit the results.
The second major issue was identified in the heart rate measuring function. Testers experienced issues with data being incorrect. For instance, an abnormally high heart rate was shown even though the user was in a state of relaxation. Upon further investigation, it was found out that the heart rate implementation is excessively sensitive. The slight movement would cause noise for the capturing mechanism, and thus cause additional beats. This issue could not be resolved due to it steaming from a hardware level. Current smartphones do not possess a heart rate sensor and must, therefore, rely on different software implementations. Hence, the acquired data may be inaccurate. However, to counter this issue, the capturing period was prolonged as a workaround which resulted in a slightly more accurate heart rate. Nonetheless, the prototype does work fully and as intended with respect to the defined criteria. The installation issue may be resolved if the app was to be put up on the Google Play Store. A logout button could also be implemented to satisfy the users. However, room for improvement exists.
The information quality section concerned itself with questions regarding credibility, information quality and visualization, evidence base, and such. The total mean score for this section was 4.3 stars. This score is relatively satisfactory, but there may be a few minor issues; however, one major issue does exist. The prototype has not been
trialled properly. As aforementioned, a small-scale study was planned for this prototype where the targeted audience, consisting of coaches and players, would also trial it. In so doing, feedback regarding many of the minor issues would have been acquired. This would have assisted in making and presenting the information with a higher degree of quality. Additionally, the current acquired feedback is unreliable. In spite of the fact that the feedback hints at the strengths and weaknesses of the prototype, the number of testers is too insignificant to draw an accurate conclusion regarding the app. Hence, the issue will stay unresolved until the prototype can be trialled properly. Nevertheless, the positive score reflects the quality of the information and the acquired feedback hints at several areas of improvement. Thus, there is room for improvement.
Notwithstanding these scores, one major factor in this project has to be considered. The Mobile App Rating Scale survey may, or may not, be an inappropriate method of evaluation. It has questions that might feel redundant when it comes to evaluating health- and fitness-related mobile apps. For instance, the engagement section is superfluous. The purpose of a mHealth app is to analyze and display information through various strategies. It is a strict business-client relationship between the app and the user. Therefore, whether an app is entertaining and/or interesting to use or not is of little significance. A mHealth app has a specific purpose and if the user is in pursuit of the functions and information it provides then interest becomes insignificant. Hence, a more appropriate section should have been created. For example, an extremely important topic to discuss regarding apps nowadays is privacy and security. This topic should have been created for the MARS and concerned itself with questions regarding the code, tracking, security, and similar. mHealth apps collect an enormous amount of sensitive and personal data about the user. Therefore, it is paramount to ensure that the user’s data does not get abused or purchased for marketing purposes. Nonetheless, the MARS does a sufficient job of assessing a mHealth app’s quality.
There are, however, some flaws with the prototype in itself that the MARS does not detect. These are of the technical sort and were a consequence of the choices made for and during the development of the prototype. For instance, the self-made account system with its login ability was an unnecessary endeavor. Cloud Firebase offers Firebase Authentication. This is a readily available account system solution and it can directly be integrated with Cloud Firebase Firestore. In so doing, it becomes an extremely powerful and versatile tool that can communicate with the database. Utilizing Firebase Authentication would have simplified the developing process and provided powerful functions to design the account system as desired. Moreover, a predefined account system with various login designs is also available in Firebase Authentication. In addition to this, the Firebase Authentication provides a proper layer of security and also enhances the Firestore database’s security. This leads to the next significant flaw. The currently implemented account system does not have