Implications
of
Financial
Reporting on Leadership’s
Strategic Choices
Authors:
Svetlin Miroslavov Mirchev
-
-
Tutors:
Philippe Daudi;
Mikael Lundgren
Program:
Leadership and Management
in International Context
Subject:
Business Administration
Level and semester: Masterlevel Autumn
Baltic Business School
Abstract
The importance of the financial markets has constantly been increasing during the last few decades. With the increase of the importance of the financial markets the popularity and importance of financial reporting have also increased dramatically.
The importance of financial reporting has logically created a need for a lot of research in the area. It is for instance important to understand the links financial reporting has with the different parts of the business and its implications on them and the business in general. Based on that the research conducted has focus on the following research issue – identify, understand and explain the implications of financial reporting on leadership’s decision making process as well as identify, understand and explain their effects on leadership’s strategic choices.
The aim of the research process is to reach some general conclusions on the issue derived from a certain context – the crisis in the financial sector originating from the US subprime mortgage crisis as well as provide basis for further research on the issue.
Table of Content
1 Rational ...4
2 Objectives...5
3 Methodology ...6
3.1 Phases of the research process...6
3.2 Major theoretical concepts applied during the research...7
3.3 Qualitative Vs Quantitative ...8
3.4 Data gathering methods...8
4 Literature Review ...9
4.1 Shareholder value - the key behind the reason for the implications of financial reporting on leadership’s decision making process and strategic choices...9
4.1.1 Introduction...9
4.1.2 The Evolution...10
4.1.3 The basic consideration ...11
4.1.4 The Reality...12
4.1.5 The basic principle remains ...15
4.1.6 The trade-off between shareholder and stakeholder value ...15
4.1.7 Short-term earnings Vs Long-term value creation – the existential question...16
4.1.8 Shortcomings ...19
4.2 Financial indicators and their link to leadership...20
4.2.1 Introduction...20
4.2.2 The basic framework ...20
4.2.3 The relevance of financial indicators to leadership...30
4.3 The Information revolution ...31
4.4 Structure of shareholding ...34
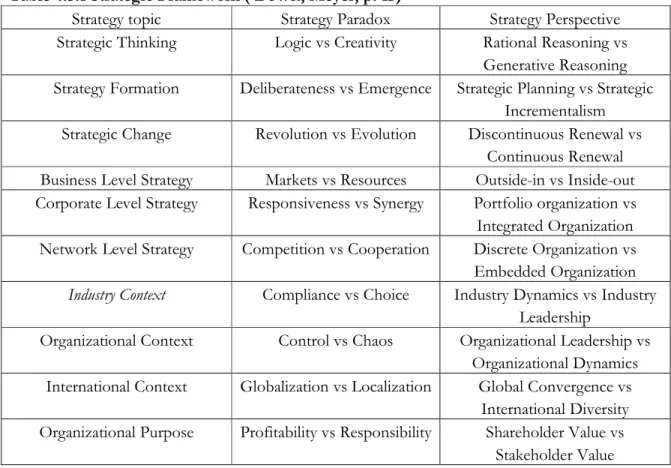
4.5 The strategy perspective...36
4.5.1 Introduction...36
4.5.2 Strategic Thinking ...37
4.5.3 Strategy Formation ...39
4.5.4 Strategic Change ...40
4.5.5 Business Level Strategy...42
5 Logical Considerations ...43
5.1 Major Drivers behind the Implications ...43
5.1.1 Shareholder Value ...44
5.1.2 The information revolution ...45
5.1.3 Structure of Shareholding ...47
5.2 Why are the implications strategic...47
5.2.1 Allocation of resources...48
5.2.2 Unrealistic value...49
6 Case Study – The UBS and its peers during the Subprime crisis...50
6.1 Introduction ...50
6.3 Structure, methods to conduct the analysis and methods of data collection ...52
6.4 The subprime crisis ...54
6.5 The role of “Wall Street”...56
6.6 A financial reporting issue...58
6.7 The UBS and its performance before and during the crisis ...60
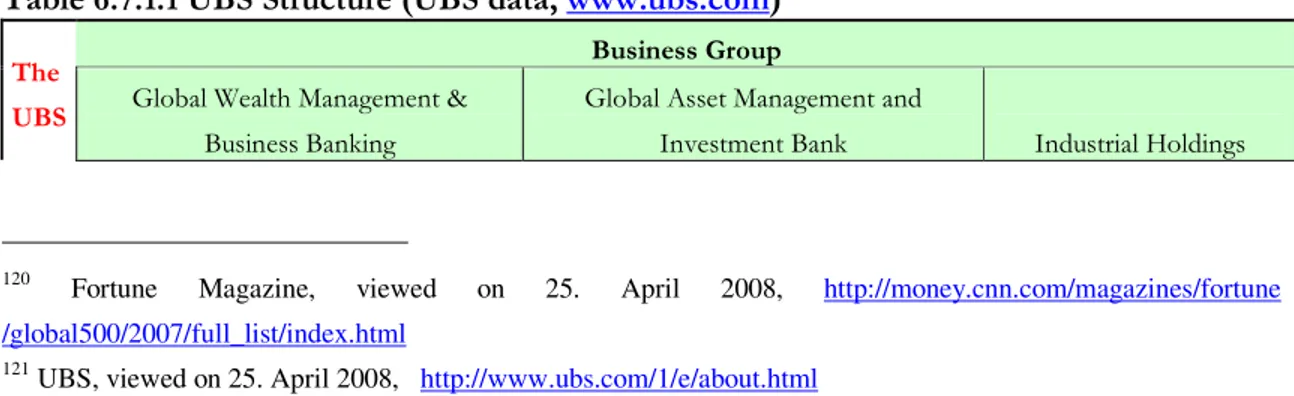
6.7.1 The UBS ...60
6.7.2 Financial performance before and after the crisis relevant to the research issue 61 6.7.3 The strategic changes subsequent to the crisis...66
6.8 The UBS’s peers ...74
6.9 Questioning the case ...76
6.10 Conclusions to the case study ...76
6.10.1 Financial reporting effects leading to the implications ...76
6.10.2 Major reasons behind the strategic developments ...77
6.10.3 The strategic implications...79
7 Conclusion...85
8 Bibliography...91
9 APPENDIXES...93
1
Rational
Leadership has always been considered one of the key, if not even the key, variables for organizational performance. The direction of development of an organization is undoubtedly influenced by the leadership style and effectiveness of leadership. The leaders are the ones determining the direction of development and the ones being at the core of the decision making process within an organization. Consequently they are the ones carrying the ultimate responsibility for the overall performance of the organization. As an organization performs in different fields, there are different indicators for the evaluation of the performance of an organization. One of those indicators is the organization’s financial performance. The financial performance of an organization is determined and evaluated via a number of financial indicators (mostly ratios). Those financial indicators or the data needed for their calculation or estimation can be found in the financial statement and reports of the organizations. This is especially true for the so called “public companies” or “publicly traded companies”. Those are the companies, whose share are publicly traded and offered to the public. They are obliged to meet certain standards so that the potential investors are not misled and offered a clear picture of the company’s financial performance. A good example of such a high standard is the so called Sarbanes-Oxley Act, which was introduced in the United States of America in 2002. The activity of reporting financial data is referred to as financial reporting.
At the core of the evaluation of an organization’s financial and very often even overall performance are two basic criteria – growth and profitability. While the influence of leadership on financial performance and financial reporting is rather clear and taken for granted the vice versa connection – the influence and immediate effects of financial reporting on leadership and the direction of development of an organization are a very interesting and kind of an intriguing issue. In other words to what extent does financial reporting affect leadership’s decision making process.
The importance and popularity of the financial markets all around the world has been constantly increasing. The number of investors as well as the number of potential investors in them has been also growing. That has also created a great deal of demand for analysis of the financial performance of the organizations so that an objective evaluation of their overall performance and future potential is achieved. As a consequence of that more and more attention is paid to the organizations’ financial reports by potential investors, analysts and media, etc. Consequently,
leadership should logically be paying more and more attention to financial reporting and is at the same time more and more concerned about the issue.
2
Objectives
The study is aiming at finding the relationship between financial reporting and leadership in terms of the influence of the first one on the latter one as determined by the strategic decision making process Shareholder value creation is becoming a major goal for the business organizations worldwide and consequently management’s primary concern. The value of the company on the other hand depends on the investors’ opinion about the organization, which is based widely (but no solely) on the way the investors perceive and evaluate the organization’s performance. As already mentioned above there are different indicators for the evaluation of the performance of an organization with one of the major ones being the organization’s financial performance. The financial performance of an organization is determined and evaluated via a number of financial indicators (mostly ratios), which can be found in the financial statements and reports of the organizations as well as in some cases different analysts reports and other sources that use those very same reports as a source. That means that especially in the case of the publicly traded companies since the financial reports issued by the company are the primary means for the evaluation of the organization’s financial performance they are also one of management’s primary concerns. Consequently a potential (drastic) change in the results reported may have very serious implications on the decision making process, direction of development and immediate performance of the organization and since they are largely determined by the organization’s leaders and leadership style they may also result in serious changes in the leadership style and even leadership in the organization. The research issue of the study is to identify, understand and explain the implications of financial reporting on leadership’s decision making process as well as identify, understand and explain their effects on leadership’s strategic choices. It is clear that the there cold be a numerous amount of implications and that those are highly dependant on the circumstance. The purpose is to come up with a set of implications within the scope of the study and provide basis for further research on the research issue.
3
Methodology
The clarification and thorough explanation of the methods and approaches used during the research process is one of its most vital parts. In this part of my work the methodology used in order to answer the research issue and in particular the relevant research techniques and model used during the research are introduced. The methods of data collection are explained and a justification of the choice of a methodological approach is provided.
3.1 Phases of the research process
The below explained four major steps are followed throughout the development of the research process:
1. Literature Review - The literature review part of the work starts with an induction of the concept of company value, shareholder value and shareholder value creation. Different aspects of the concept are discussed including its evolution, the basic consideration behind it, an overall picture regarding the concept’s application in reality as well as its shortcomings. The second section of the literature review offers a discussion regarding some key financial indicators and their link to leadership. The section begins with an outline of the basic theoretical framework from different perspectives and commences to the identification of a list of financial indicators considered most closely linked to the topic which are used in the further analysis conducted in the empirical study. The following two sections of the literature review are dedicated to short discussions of the information revolution and structure of shareholding aimed at supporting the logical considerations available in the work as well as the final conclusions. Last but not least attention is paid to the theoretical framework offered by De Wit and Meyer, which is the major strategic concept the analyses in the empirical study are based on.
2. Logical considerations – The next part of the work provides some logical consideration regarding the research issue of the paper. The part is divided into two separate parts with their respective sections. The purpose of the existence of this section is to on one hand provide the reader with some considerations on top of and based on the literature
discussed in the literature review. In addition the logical considerations provide the reader with the author’s perspective regarding the development of the work.
3. Empirical study – Based on the theoretical framework discussed in the literature review and the considerations thereafter a case study on an up to date issue will be constructed and analysed with the purpose of gaining empirical evidence with regard to the research issue. The case study will be based on the current crisis in the financial sector originating from the US subprime mortgage crisis. The case study as an empirical research has its own methodology available in the case study itself.
4. Conclusion – The purpose of the conclusion drawn is to address and answer the research issue as much as possible based on the review of the existing literature discussed in the literature review part of the paper, the logical considerations thereafter and of course the empirical study with its conclusions.
3.2 Major theoretical concepts applied during the
research
Four theoretical concepts are used during the development of the work. The selection of the theoretical concepts is based solely on their relevance to the research issue. Further explanation regarding the relevance of the concepts to the research issue is provided at the point of discussion of the concepts themselves.
1. Company value, shareholder value and shareholder value creation
2. Financial indicators and their relevance to leadership
3. The information revolution and structure of shareholding as determinants in the process of shareholder value creation
4. Theoretical framework in the field of strategy offered by Bob De Wit and Ron Meyer in their book “Strategy: Process, Content, Context--An International Perspective”
3.3 Qualitative Vs Quantitative
In terms of research methods it can be differentiated between qualitative and quantitative research methods. According to Strauss and Corbin (1990) qualitative research is any kind of research that produces findings not arrived at by means of statistical procedures or other means of quantification. Quantitative research on the other hand involves quantitative analysis of numbers and other data that can be transformed into numbers (Robson, 1993).
Both the qualitative and quantitative research methods have their advantages and disadvantages. Many examples from science as well as simply from the daily life can be given in order to illustrate those advantages and disadvantages as well as the differences between qualitative and quantitative research methods. Instead of looking at the advantages and disadvantages of the two methods though it is better to concentrate on their appropriateness based on the individual case and determine which one is more appropriate in the particular situation. The starting point for determining the appropriate research method is the research issue and the objectives of the research.
The specifics of the research issue and the objectives of the research in this case require the application of both qualitative and quantitative research methods. Consequently, both methods are used during the development of the thesis. While the financial effects of the phenomenon subprime crises are analysed by means of quantitative research methods, the leadership’s decision making process and strategic choices are analysed be means of qualitative research methods. Finally it can be concluded that the research issue has been addressed by using both the quantitative and qualitative research methods with an emphasis on the latter one.
3.4 Data gathering methods
The research process is based on analysis and interpretation of secondary data. The sources of data collection used are books, articles and websites of major news providers as well as the information available on the official websites of the companies included in the empirical research. When considering the methods of data collection it is very important to keep in mind that the research issue requires extensive knowledge in many different fields of study like finance, strategy, economics, etc. It is important to filter the data based on their relevance to the research issue. A major pitfall is the fact that in case the data are not filtered properly based on their
relevance to the research issue the analysis may include too much data and the conclusions reached may be too broad and not concrete. Another important aspect is to make sure that the data used are reliable, comprehensive and up to date.
There is a lot of research and analysis done in the fields of research associated with the research issue. Due to the specifics of the latter though it is important to select and filter only relevant and up to date literature and data for the analysis.
4
Literature Review
4.1 Shareholder value - the key behind the reason for the
implications of financial reporting on leadership’s
decision making process and strategic choices
4.1.1 Introduction
Shareholder value is according to me the key behind the reason for the implications of financial reporting on leadership. More and more companies nowadays have based their strategies on shareholder value creation. In order to be able to analyse the role of shareholder value as a key behind the reason for the implications of financial reporting on leadership we need to first gain an understanding of the concepts of company value, shareholder value and shareholder value creation. In order to do that I will review some of the familiar to me literature I consider relevant for the topic in this part of my literature review dedicated to shareholder value. The two books I will base this part on are:
1. “Valuation: Measuring and Managing the Value of Companies”, Fourth Edition by McKinsey & Company Inc., Tim Koller, Marc Goedhart, and David Wessels - McKinsey & Company Inc is one of the most renowned consulting companies worldwide. The company was founded in 1926 by James O. McKinsey. More than 75 years later, the firm has grown into a global partnership serving three of the world's five largest companies and two-thirds of the Fortune 1000.1
The company’s mission has remained the same since its foundation (with a little rewording from decade to decade): to help clients make distinctive, lasting, and substantial improvements in their performance
1
and to build a great firm that is able to attract, develop, excite, and retain exceptional people.2Since McKinsey & Company Inc is one of the most experiences and renowned consulting company in the world with exceptional experience in the consulting of companies worldwide I consider their opinion very relevant to the topic. At the same time I have some experience using the book in professional experience and it has proved its qualities.
2. “In Search of Shareholder Value: Managing the Drivers of Performance” by Andrew Black, Philip Wright, and John E. Bachman – In addition to McKinsey & Company Inc’s perspective, which will be the basis of this review I will also add the perspective offered by Andrew Black, Philip Wright, and John E. Bachman in their book “In Search of Shareholder Value: Managing the Drivers of Performance”. The book offers some very interesting ideas, which add up to the ones of McKinsey & Company Inc and will contribute to a more exhaustive review of the concepts of company value, shareholder value and shareholder value creation. I admire the ideas from this book, which will be included in my review.
4.1.2 The Evolution
Many things have changed throughout the development of the current business environment. On one hand as the economy in the different parts of the world has been growing with a different pace the expectations of the investors’ regarding their investments in the respective economies have been adjusting. On the other hand as the needs of the people around the world have been changing and the intensity of investment in the different industries and sectors of the economy, the latter have also recorded different paces of growth and the investors’ expectations regarding their investments in them have also been adjusting accordingly. At the same time as a consequence of the introduction of new technologies, accounting scandals and other external developments, the regulations of the financial markets all over the world have also undergone different changes – new legislation has been introduced, old one has been changed, etc. Those are just three of the many, many things that have been constantly changing thus affecting the current state of the global business environment. As pointed out in McKinsey Ironically one thing that
2
did not change was the market’s obsession with quarterly earnings. This focus continues to confront business leaders with the dilemma of often having to choose between short-term results and the long-term health of the companies that they lead.3
I think that this quote taken from McKinsey’s famous book is a perfect tool to set the stage for the upcoming further debate.
Together with the changes in the global business environment and all the existing uncertainty in the markets the number of methodologies for valuating companies and thus calculating the true shareholder value have increased and the methodologies have become more and more complicated. More and more investors, analysts, and investment bankers are turning to fundamental financial analysis and sophisticated discounted cash flow (DCF) models as the touchstone of corporate valuation.4 The reason behind the increase in number and complication, which is also accompanied by a great deal of debate about their accuracy in different situations is to make sure that the true shareholder value to the investors.
4.1.3 The basic consideration
The basic consideration behind creating value for the shareholders or the so called shareholder value is that especially starting with the US and the UK. At least in ideology and legal frameworks the United States and the United Kingdom have given the most weight to the idea that shareholders are the owners of the corporation, the board of directors is their representative and elected by them, and the objective function of the corporation is to maximize shareholder value.5
It is worth mentioning here that the principle is one, which is very close to the principle of representative democracy used in many of the democratic states nowadays. On a political level the people elect the politicians, who represent them in the lawmaking body of the nation, while in the corporation the shareholders elect their representatives in the respective executive body (board of directors, etc), who defend their interests and promote their idea for future development of the business. There are of course differences. Unlike most of the democratic political systems where one voter represents one vote this is not the case with the corporate governance. There are different types of shares and the
3
McKinsey & Company Inc. by Tim Koller, Marc Goedhart, and David Wessels, Fourth Edition, 2005, “Valuation: Measuring and Managing the Value of Companies”, page 3
4
McKinsey & Company Inc. by Tim Koller, Marc Goedhart, and David Wessels, Fourth Edition, 2005, “Valuation: Measuring and Managing the Value of Companies”, page 4
5
McKinsey & Company Inc. by Tim Koller, Marc Goedhart, and David Wessels, Fourth Edition, 2005, “Valuation: Measuring and Managing the Value of Companies”, page 19
voting power is not equally distributed among the shareholders. At the same time the right to have more voting power is not granted to the shareholders due to a similarity between them like the citizenship, but on the basis of the basis of the amount of capital invested by them and the risk they are willing to take. Both principles have their advantages and shortcomings, but this is not the topic of this work.
It is also at this stage important to mention what are the factors contributing to the growing awareness towards shareholder value. According to Black, Wright, and Bachman in their book “In Search of Shareholder Value: Managing the Drivers of Performance” there are three forces contributing to the growing awareness towards shareholder value. Three forces in particular have contributed to a growing awareness of the importance of SHV and value-based management. They are: The spread of private capital; the globalization of markets; and the information revolution.6
4.1.4 The Reality
Here is the point to mention a few interesting points regarding the investor relations of a business, which must be discussed regarding the concept of shareholder value, and why they are so important. It is undoubtedly truth that especially the value of a publicly traded company is closely associated with the opinion and expectations the different analysis, stakeholders and especially the potential shareholders have about the future performance of a company.
• The complication with the publicly traded companies
A very accurate point about the fact that the complication with the publicly traded companies actually comes from the fact that management must deal with outside investors and analysts is given again by McKinsey and Co in their book “Valuation: Measuring and Managing the Value of Companies”. They state that: When a company enters the financial (or capital) market, the real market competition rules are essentially unchanged, but life becomes more complicated because management must simultaneously deal with outside investors and analysts.7Here I would just like to mention that narrowing
6
Andrew Black, Philip Wright, and John E. Bachman, 2000, “In Search of Shareholder Value: Managing the Drivers of Performance”, page 8
7
McKinsey & Company Inc. by Tim Koller, Marc Goedhart, and David Wessels, Fourth Edition, 2005, “Valuation: Measuring and Managing the Value of Companies”, page 51
down the complication solely to management is probably the most objective alternative when it comes to formal power in the organization, but otherwise I would like to also mention that the image of the organization it is not solely the result of the management’s efforts and performance, but the result of the efforts and performance of all the leaders of the organization – both formal and informal.
• The investors pay for the performance that they expect the company to achieve
Here is a short explanation of how it works technically in simple words offered again by McKinsey and Co in the same book: The trading activity between investors and speculators sets for those shares. Each investor determines a value for the shares and trades based on whether the current price is above or below that estimate of the intrinsic value. This intrinsic value is based on the company’s ability to generate cash flow in the future. This means, essentially, that investors are paying for the performance that they expect the company to achieve in the future, not what the company has done in the past and certainly not the cost of the assets in the company.8
This again according to me puts the emphasis on the future performance of leadership, because if they do not manage to perform better in the future and do not manage to convince the potential investors in the fact that hey will then the value of the company and thus the shareholder value will inevitably suffer.
• The returns that the shareholders earn depend more on the changes in expectations than the actual performance of the company
Let us now use a short example from the same book and author in order to try to illustrate the process. After an initial price is set, the returns that shareholders earn depend more on the changes in expectations about the company’s future performance than the actual performance of the company. For example if a company is expected to earn 25 percent on its investment, but only earns 20 percent, its stock price will drop even though the company is earning more than its cost of capital.9
• The potential for future growth and returns must be inferred
8
McKinsey & Company Inc. by Tim Koller, Marc Goedhart, and David Wessels, Fourth Edition, 2005, “Valuation: Measuring and Managing the Value of Companies”, page 52
9
McKinsey & Company Inc. by Tim Koller, Marc Goedhart, and David Wessels, Fourth Edition, 2005, “Valuation: Measuring and Managing the Value of Companies”, page 54
At the same time we need to mention that historic financial data is an indicator of the company’s historic financial performance. Unlike the company’s potential or future growth and returns the company’s historic financial performance is based on clear existing data and is relatively easy to anaylise and measure. Since only a company’s historic growth and returns on capital – not its future performance – can be measured directly, the potential for future growth and returns must be inferred.10
• Information about the true prospects plays an important role
With resects to everything mentioned above we can conclude that the value of the company and respectively the shareholder value is largely dependant on the flow of information regarding the company’s performance and future prospects. According to McKinsey the market’s expectations about the company’s future performance can deviate from intrinsic value can deviate largely form the intrinsic value “if the market is less than fully informed about the company’s true prospects.11
It is probably worth mentioning here that especially in today’s world and after all the accounting scandals we have seen apart from being not fully informed the market can also be improperly informed about the company’s health and future prospects.
• Managers need to educate their investors
To conclude this point we need to point out that it is not only the potential investors’ as well as analysts’ and stakeholders’ sole responsibility to inform themselves about their current or potential investments’ prospects and learn to understand the data. According to McKinsey, after educating themselves about shareholder value from both theoretical and practical perspective, in order to be able to link the concept with their strategies, educating their internal and external constituencies, installing management systems that encourage real value creation, not merely short term – accounting results hey have one more very important task (McKinsey page 5). “Finally they need to educate their investors about how and when the company will create value.12
10
McKinsey & Company Inc. by Tim Koller, Marc Goedhart, and David Wessels, Fourth Edition, 2005, “Valuation: Measuring and Managing the Value of Companies”, page 384
11
McKinsey & Company Inc. by Tim Koller, Marc Goedhart, and David Wessels, Fourth Edition, 2005, “Valuation: Measuring and Managing the Value of Companies”, page 54
12
McKinsey & Company Inc. by Tim Koller, Marc Goedhart, and David Wessels, Fourth Edition, 2005, “Valuation: Measuring and Managing the Value of Companies”, page 5
A good contribution to the debate is brought up again by Black, Wright, and Bachman: Especially, investor communications must aim at ensuring that investors understand your company’s value-based strategies and goals, and are confident in management’s ability to implement those objectives and deliver on them.13
4.1.5 The basic principle remains
Another extremely important fact pointed out by McKinsey is that the overall stock market performance from a long-term perspective tracks the fundamental performance of the economy and the companies. Deviations from fundamentals occur when companies, investors and bankers ignore the principles of economics or assume that they have changed.14
What I would like to explicitly mention is that after all the scarce resources and the competing needs is what we all have to take into consideration. Some leaders’ better or worse performance at certain periods of time reflects on the business, but the fundamental principles of economics are always valid. It is also worth mentioning here that especially in some moments not everything depends solely on the leaders’ abilities and knowledge, but also the external events and circumstances play a very important role.
4.1.6 The trade-off between shareholder and stakeholder value
The opinion that by creating shareholder value the leaders actually destroy stakeholder value is very widely spread around. The point of this work is not to discuss this issue though. For the sake of sticking to the topic I would just like to mention that the this argument is indeed somewhat controversial and there are according to me reasonable arguments supporting both views – that by creating shareholder value the leaders very often destroy stakeholder value and that there is actually no trade-off between the two. According to McKinsey there is certainly no trade-off between the stakeholder and shareholder value. As an example of that we can mention for instance the fact that for instance the employees of a company are also its stakeholders. A company that tries to fatten its profits by providing a shabby work environment, underpaying employees, and
13
Andrew Black, Philip Wright, and John E. Bachman, 2000, “In Search of Shareholder Value: Managing the Drivers of Performance”, page 90
14
McKinsey & Company Inc. by Tim Koller, Marc Goedhart, and David Wessels, Fourth Edition, 2005, “Valuation: Measuring and Managing the Value of Companies”, page 5
skimping on benefits will have trouble attracting and retaining high-qualified employees.15 That is to say that if we imagine the whole process the vise-versa connection of destroying stakeholder value and compensating it with shareholder value will, or at least should, not work. In order to support their view McKinsey give an example stating that: When examining employment we found that the United States and European companies that created the most shareholder value in the past 15 years have shown healthier employment growth.16
4.1.7 Short-term earnings Vs Long-term value creation – the
existential question
Slowly, but surely we are going deeper into the issue of shareholder value and shareholder value creation, At this point I would like to mention a very important aspect of the issue.
There is no doubt that the truly successful companies are the ones, who focus on the long-term sustainable development, which leads to stable long-term cash flows, which in term determine the companies’ value and consequently shareholder value The question though is whether the companies really do it. Another question is if they do it the right way and if they actually realize what they do and tackle the issue.
According to McKinsey the companies that focus on the long-term sustainable value creation are the ones, who contribute the most to the overall economic development and the wellbeing of the stakeholders. They are also the ones the capital markets indeed reward the most. It is unfortunate, but truth, however, that managers are under pressure to achieve short-term results at the expense of long term value creation. Many succumb. In a recent survey of 401 executives, 55 percent of them said they would delay or cancel a value – creating project to avoid missing the consensus analysts’ forecast for the current quarter’s earnings.17
The major drawback of those managers’ decisions to sacrifice optimal development and success for the sake of short-term results is that by doing so they drive the businesses into an unsustainable path of development. At the same time they create an unsustainable competitive environment
15
McKinsey & Company Inc. by Tim Koller, Marc Goedhart, and David Wessels, Fourth Edition, 2005, “Valuation: Measuring and Managing the Value of Companies”, page 19
16
McKinsey & Company Inc. by Tim Koller, Marc Goedhart, and David Wessels, Fourth Edition, 2005, “Valuation: Measuring and Managing the Value of Companies”, page 19
17
McKinsey & Company Inc. by Tim Koller, Marc Goedhart, and David Wessels, Fourth Edition, 2005, “Valuation: Measuring and Managing the Value of Companies”, page 21
and the other companies are prompted to deviate from their own optimal paths of development in order to sustain their existence in the short-run.
Here we can add Black, Wright, and Bachman’s point of view in their book “n Search of Shareholder Value: Managing the Drivers of Performance” – Understandably, boardrooms and middle managers are suspicious of the stock market. A superficial glance at the behavior of share prices in the market might lead you to think that short-termism has priority over long-term evaluation. Companies are convinced that investors are driven by short-term targets and do not therefore understand management strategies.18
Paradoxically, the misunderstanding between management and investor concerning the short and the long term arises because of the enormous immediate effects on value of announcements made by companies, even concerning short term results, if these change the market’s perception of their long term cash flows.19
McKinsey also explain that: The pressure to show short-term results often occurs when the companies start to mature and begin a transition from high to low growth. Investors clamor for high growth. Managers are tempted to find ways to keep profits growing in the short term while they try to stimulate longer-term growth. Usually, the short-term efforts make achieving long-term growth even more difficult, spawning a vicious cycle.20
What I would like to add to the statement above is that basically all companies go through this process. After that they are under pressure, because the expectations towards them as mature companies are even higher.
There is one more very interesting opinion expressed by McKinsey, which I personally fully support. According to them the accounting scandals in the recent years can largely be attributed exactly to the fact that management was trying to make sure that the short-term results look better. Perhaps no action was more disappointing and damaging than the wave of accounting fraud that managers resorted to in the late 1990s and early 2000s to improve the appearance of their short-term results.21
18
Andrew Black, Philip Wright, and John E. Bachman, 2000, “In Search of Shareholder Value: Managing the Drivers of Performance”, page 13
19
Andrew Black, Philip Wright, and John E. Bachman, 2000, “In Search of Shareholder Value: Managing the Drivers of Performance”, page 13
20
McKinsey & Company Inc. by Tim Koller, Marc Goedhart, and David Wessels, Fourth Edition, 2005, “Valuation: Measuring and Managing the Value of Companies”, page 21
21
McKinsey & Company Inc. by Tim Koller, Marc Goedhart, and David Wessels, Fourth Edition, 2005, “Valuation: Measuring and Managing the Value of Companies”, page 21
Overall I would also point out and completely agree with McKinsey’s foreword looking statement: Stock markets will always clamor for short-term results, just as coaches push athletes to achieve higher level of performance. That pressure will always be there, and it is not all bad. It is also up to managers to sort out the trade-offs between short-term earnings and long-term value creation and be courageous enough to act accordingly. Perhaps even more important, it is up to corporate boards to investigate sufficiently and be active enough to judge when managers are making the right trade-offs – and to protect them when they choose to build long-term value.22
I would also like to mention that according to me the success of a business is the result of the efforts and performance of all the leaders of the organization – both formal and informal. Unlike management who have the official power in the company there are also many other individuals within the organization who posses a great deal of informal power and are quite influential within it. Those individuals also contribute to the success or failure of a company by influencing the decision making process.
There is though one fact that is according to me indisputable. That is also clearly supported by McKinsey throughout the whole book. As an example of their opinion I will offer the following quote taken from the book: Managing for value creation requires many mangers to break with the perspective that many of their peers typically use. Value managers are a special breed: They focus on long-term cash flow rather than on quarter – to – quarter earnings. They judge businesses by returns above opportunity cost, not by size, prestige, and other emotional issues. Most important, they recognize that managing for value means instilling the philosophy of value creation throughout the organization.23
In this I would like to clearly state my 100% support for McKinsey’s view and promote it to the readers of this work. I think that indeed the only way to create value is to focus on the long-term sustainable performance of the organization and its ability to deliver long-term stable cash flow.
Based on Black, Wright, and Bachman’s opinion: In a company structured to maximize SHV, the divisional manager will have to be more aware of what the shareholders want - which is nothing but better returns.24
22
McKinsey & Company Inc. by Tim Koller, Marc Goedhart, and David Wessels, Fourth Edition, 2005, “Valuation: Measuring and Managing the Value of Companies”, page 21
23
McKinsey & Company Inc. by Tim Koller, Marc Goedhart, and David Wessels, Fourth Edition, 2005, “Valuation: Measuring and Managing the Value of Companies”, page 23
24
Andrew Black, Philip Wright, and John E. Bachman, 2000, “In Search of Shareholder Value: Managing the Drivers of Performance”, page 14
4.1.8 Shortcomings
At the end of this part of my work I would like to pay some very special attention to the some of the corner stones in measuring financial performance and shareholder value.
The first one is regarding the objectivity of the officially published data and how reliable it is for analysis. As pointed out by McKinsey the financial matrixes used by management for measuring financial performance are subjective. That is based on the fact that accountants make judgments about when to record revenues and costs. Often this judgment is colored by personal incentives (e.g. their boss wants the current quarter to look good.25
The second and more important issue is “that historical financial metrics cannot capture the trade-offs, managers constantly make between achieving and short-term financial results and investing for the future.26
In support of this view is also Black, Wright, and Bachman view: Profit, in other words, is an opinion rather than an established fact. (In Search of Shareholder Value: Managing the Drivers of Performance page 12)”.27
In fact whatever the data we see it can hardly be 100% percent objective, because it is always induced by somebody, who has his/her personal preferences, frames of references and level of knowledge and experience. It would be nice to be able to always isolate the biases in the data, but unfortunately is hard to capture them.
There is for instance the very popular trick of using one-time gains and losses to smooth operating performance or hit operating targets. Net income and EPS also are subject to one-time gains and losses. While these gains and losses are real, too often companies use one-gains and losses to smooth out their operating performance or hit earnings targets.28
25
McKinsey & Company Inc. by Tim Koller, Marc Goedhart, and David Wessels, Fourth Edition, 2005, “Valuation: Measuring and Managing the Value of Companies”, page 385
26
McKinsey & Company Inc. by Tim Koller, Marc Goedhart, and David Wessels, Fourth Edition, 2005, “Valuation: Measuring and Managing the Value of Companies”, page 385
27
Andrew Black, Philip Wright, and John E. Bachman, 2000, “In Search of Shareholder Value: Managing the Drivers of Performance”, page 12
28
McKinsey & Company Inc. by Tim Koller, Marc Goedhart, and David Wessels, Fourth Edition, 2005, “Valuation: Measuring and Managing the Value of Companies”, page 390
4.2 Financial indicators and their link to leadership
4.2.1 Introduction
The financial ratios are among some of the most important and widely used indicators for measuring a company’s financial performance. The financial ratios are either directly available in a company’s publicly available (financial) reports or they can be calculated by using the financial data published by a company. This is exclusively truth for the companies whose shares are publicly traded, because even though there are differences in the reporting standards from country to country the companies whose shares are publicly traded need to report to the public the data regarding their financial performance regularly. It is very rarely the case that all the relevant financial ratios are available and do not need to be separately calculated by the analysts, potential investors or stakeholders, who are interested in them. I must even say that it is sometimes the case that some of the data needed for the calculation of the ratios is not publicly available, because the reporting standards of the country where the company’s shares are listed do not require it.
What I would like to do now is pay some attention to the most widely used financial indicators and in particular the ones having the most relevance to evaluating a company’s leadership. Even though there is no doubt that a company’s overall financial performance is certainly dependant on its leadership and consequently all of its financial results are highly influenced by leadership’s overall performance we must admit that the influence of leadership on some of the financial indicators is much more direct and consequently the responsibility of leadership associated with the results reported on them is a lot more directly linked to leadership’s performance by the investors, analysts and stakeholders than the results reported on the others.
The purpose of this section is to provide an overall overview of the theoretical framework and a basis for further analysis. The final product of this section is applied in the empirical study conducted at a later stage of the development of the work. That is when the specific indicators used are considered in more detail and explanation to them is provided.
Before starting to go deeper into the issue I would like to first explain what a financial ratio is. There are many different definitions and explanations of what a financial ratio is. I personally prefer the one given by Bill Webster in his book “Accounting for Managers” – A ratio is a number that expresses a mathematical relationship between two quantities, such as items on balance sheets and income statements.29
In fact a financial ratio is a number that expresses the relationship between two financial figures. Those are usually Income statement, balance sheet or cash flow statement items.
Webster also states very clearly and accurately the importance of financial ratios concepts. Financial ratio concepts are important for managing cash, capital investment, profitability, and risk. They are the primary way to speak with depth and precision about management job performance and achieving enterprise goals.30 Here we need to remember that the financial indicators are not only ratios. They can as well be nominal figures taken from the company’s financial statement. Those are for instance one-time gains or losses, value of certain assets, etc. Not to mention the share price itself.
Another very important point regarding financial ratio analysis pointed out by Webster is that: A ratio draws meaning through comparison with other data and standards. By itself, a financial ratio is not worth much. In context, a manager or outside analyst can tease out meaning to develop an understanding of a company?s situation and developing trends.31
In order to emphasize this statement I would also like to add Dr Andrew Temte’s statement in his book “Financial statement analysis”: A financial ratio is not meaningful when analyzed individually. It should be noted that financial ratios are interrelated - requiring the analyst to evaluate a ratio relative to other ratios. Ratios alone do not answer questions. They are designed to assist the analyst in determining where to look and what questions to ask in conducting financial statement analysis.32
Another thing we need to explicitly mention is that there is no 100% comprehensive and standard set of financial indicators that can be considered relevant for the evaluation of any company’s financial performance. While some of the indicators are always considered relevant others are rather industry specific, important based on geographic position, time specific, market
29
Webster, William,2003, “Accounting for Managers”, page 65
30
Webster, William,2003, “Accounting for Managers”, page 65
31
Webster, William,2003, “Accounting for Managers”, page 65
32
specific and so on and so on. Before we state something concrete about a financial indicator we need to first make sure that it makes sense. After all, the performance of a business is always relevant to certain circumstances. This is especially truth nowadays when the business environment is becoming more and more complex and globalized.
In order to complete the picture I will add another very clear and accurate statement made by Webster. There’s a ratio for almost any question you’d care to ask - and a couple you might not dare. The ratio formulas are valuable for the questions they answer. In some cases, they’re more valuable because of the additional questions they raise.33
The complete picture drawn up to now is very important to understand, because it plays a very important role in the analysis, which will be done at a later stage of this work. A the conclusion reached are very closely associated to the circumstances they take place in and while they certainly answer a lot of questions they do raise many new ones, whose concrete answer is very difficult to find without raising even more questions whose answers are also quite subjective and difficult to find.
There are different ways and categories, which the large number of financial ratios available in the global financial world could be found in. The categorization depends on the purpose of the analysis, the criteria selected and sometimes even the author’s personal preferences. As mentioned by Webster the grouping of the ratios into categories brings some order and helps us gain an understanding about the different parts of a company’s finances and operations.34
Two different types of categorizations – one offered by William Webster in his book “Accounting for Managers” and one offered by Dr Andrew Temte in his book “Financial statement analysis” are offered. I consider both of them very adequate and appropriate for the occasion.
In his book “Accounting for Managers” Webster points out and shortly explains the most commonly used ratios by dividing them into four major categories:
Liquidity ratios (solvency ratios)
33
Webster, William, 2003, “Accounting for Managers”, page 67
34
Current ratio – This is the standard measure of any business?s financial health. The current ratio measures the ability of the firm to pay its current bills.35
Current ratio = current assets/current liabilities
Quick Ratio: “Acid Test” – The quick ratio is similar to the current ratio, but it’s a tougher measure of liquidity than the current ratio, because it excludes inventories.36
Quick ratio = (current assets – inventory)/current liabilities
Net Working Capital (NWC) – Net working capital is not really a ratio in the strictest sense; it’sjust a number. You simply subtract the balance sheet currentliabilities from the current assets.37
Net Working Capital = current assets - current liabilities
Activity ratios –
Activity ratios measure how well a company conducts its business operations.38Average Collection Period (ACP) - This ratio, also known as days sales outstanding, shows how quickly a company converts accounts receivable into cash.39
Average collection period = accounts receivable(sales / 360 days)
Average Payment Period (APP) – This ratio, also known as the accounts payable turnover ratio, tells how quickly a company is paying its bills, how often its payables turn over during the year.40
Average payment period = accounts payable/(purchases/360 days)
Fixed Assets Turnover (FAT) Ratio – This ratio measures how efficiently a company uses its fixed assets to generate sales: the higher the better.41
35
Webster, William,2003, “Accounting for Managers”, page 67
36
Webster, William,2003, “Accounting for Managers”, page 69
37
Webster, William,2003, “Accounting for Managers”, page 70
38
Webster, William,2003, “Accounting for Managers”, page 70
39
Webster, William,2003, “Accounting for Managers”, page 71
40
Fixed Assets Turnover (FAT) Ratio = sales/fixed assets
Total Assets Turnover (TAT) Ratio – This ratio measures how well a company generates sales from assets. It’s similar to the fixed assets turnover but includes all assets - current, fixed, other long-term.42
Total assets turnover = sales/total assets
Inventory Turnover (IT) Ratio – The inventory turnover ratio shows how often a company replaces its inventory. This is a key management performance indicator for retail businesses.43
Inventory turnover = cost of goods sold/total inventory
Inventory to Net Working Capital – This ratio tells how much of the company’s funds are tied up in inventory.44
Inventory to net working capital = inventory/net working capital
Debt Ratios
– Debt ratios measure the extent to which a firm relies on debt to finance its operations.45Debt-to-Assets Ratio – This ratio, sometimes known simply as debt ratio, shows the extent to which a company is financed with debt.46
Debt-to-Assets Ratio = total liabilities/total assets
Debt-to-Equity Ratio – This ratio measures the percentage of debt tied up in the owner’s equity. Generally, this calculation uses only long-term debt.47
41
Webster, William,2003, “Accounting for Managers”, page 71
42
Webster, William,2003, “Accounting for Managers”, page 72
43
Webster, William,2003, “Accounting for Managers”, page 73
44
Webster, William,2003, “Accounting for Managers”, page 74
45
Webster, William,2003, “Accounting for Managers”, page 74
46
Webster, William,2003, “Accounting for Managers”, page 74
47
Debt-to-Equity Ratio = long-term debt/total equity
Times Interest Earned – Times interest earned, sometimes called the interest coverage ratio, measures the creditworthiness of a company, the ability of the company to meet its debt payments.48
Times Interest Earned = earnings before interest and taxes (EBIT)/interest
Fixed Payment Coverage Ratio – The fixed payment coverage ratio includes the principal plus interest amount owed to creditors. It’s another measure of the ability to repay debt.49
Fixed Payment Coverage Ratio = EBIT/ interest + (principal + preferred dividends) x [1-( 1 / tax rate)]
Profitability Ratios
– The profitability ratios track how well the firm generates a profit through its operations. …profitability is the core measurement of a going concern.50Gross Profit Margin (GPM) – The gross profit margin subtracts the costs of goods sold as a measure of sales to give the first indication of how much profit is left to cover overhead and other cash items.51
Gross Profit Margin = (sales – cost of goods sold)/sales
Operating Profit Margin (OPM) – The operating profit margin indicates how effective a company is at controlling the costs and expenses of its operations.52
Operating Profit Margin = EBIT/sales
Net Profit Margin (NPM) – Net profit margin is one of the key performance indicators. The higher the net profit margin, the more effectively the company is converting revenue into profit.53
Net Profit Margin = net profits/sales
48
Webster, William,2003, “Accounting for Managers”, page 75
49
Webster, William,2003, “Accounting for Managers”, page 75
50
Webster, William,2003, “Accounting for Managers”, page 75
51
Webster, William,2003, “Accounting for Managers”, page 76
52
Webster, William,2003, “Accounting for Managers”, page 76
53
Return on Investment (ROI) – Return on investment shows how well a company uses its assets to generate profits.54
Return on Investment = total asset turnover*net profit margin
Return on Assets (ROA) – This ratio tells how effectively a business has been making its assets work. The ROA measures the use of capital to make profit (before interest and income tax).55
Return on Assets = EBIT/net operating assets
Return on Equity (ROE) – This ratio measures the return earned by a company on its equity.56
Return on Equity = net profits/shareholder equity
Earnings per Share (EPS) – The earnings per share measures the dollar (or in this case in units or currency) return per share to owners of a company.57
Earnings per Share = total earnings/shares outstanding
Ratios relevant to investing activities
There are also a number of other very widely used ratios in the world of business., which are used rather for investment purposes then for the purpose of managing a business. This opinion is also shared by Webster –There are a number of other valuable ratios that haven’t been covered here. Among these we could mention price/ earnings ratio, price-to-sales ratio, and price-to-book-value ratio, primarily because they’re more relevant to investing activities than to managing a business.58
The fact that those ratios are used very widely in investing activities, and are an integral part of the basis used by investors and analysts in their decision-making process is exactly the reason why I am going to pay an extremely special
54
Webster, William,2003, “Accounting for Managers”, page 77
55
Webster, William,2003, “Accounting for Managers”, page 77
56
Webster, William,2003, “Accounting for Managers”, page 77
57
Webster, William,2003, “Accounting for Managers”, page 78
58
attention to those ratios. For the sake of clarity exactly the three ratios mentioned by Webster - price/ earnings ratio, price-to-sales ratio, and price-to-book-value ratio, are the ones, which I will include in my analysis.
As I have already mentioned above the financial ratios used in investing activities are an integral part of the basis used by investors and analysts in their decision-making process. These ratios play an instrumental role in the process of shareholder value creation. They are one of the key factors behind the investors’ decisions whether to buy certain shares or not. My personal professional experience in investment banking indicates that first of all they play a very important role in the valuation of a business and second that they are the first place where the potential investors look in order to start a consideration about investing in a company or keeping they interest in it. The reason why they are so respected by the investors and analyst is because they provide them with an indication based on both historic and current financial data of what their investments are or would be worth compared to certain measures. Since the financial Ratios relevant to investing activities are indicators financial indicators and because there could be a lot of different circumstances where they could be applied I would like to here once again state that there is no 100% comprehensive and standard set of financial indicators that can be considered relevant for the evaluation of any company’s financial performance. After all, as the great Albert Einstein once said – everything in this world is relative. This is especially truth in the case of the ratios relevant to investing activities. There could be many different ratios relevant to investing activities that investors could come up with, Some of them are very important and widely used while others a much more rarely used and considered important under certain circumstances. For the sake of clarity and sticking to the main topic I will focus my attention on four of the most important and widely used ones. The theoretical frame wok will be taken from www.investopedia.com – One of the most widely used and reliable source allowing the investors to find reliable and up to date information at no time, which allows them to be always up date when they need it.
Price-Earnings Ratio (P/E Ratio) – A valuation ratio of a company's current share price compared to its per-share earnings.59
59
The P/E is sometimes referred to as the "multiple", because it shows how much investors are willing to pay per dollar of earnings. If a company were currently trading at a multiple (P/E) of 20, the interpretation is that an investor is willing to pay $20 for $1 of current earning.60
Price-Earnings Ratio = market value per share/earnings per share (EPS)
Price-To-Sales Ratio (Price/Sales): A ratio for valuing a stock relative to its own past performance, other companies or the market itself. Price to sales is calculated by dividing a stock's current price by its revenue per share for the trailing 12 months.61
The price-to-sales ratio can vary substantially across industries; therefore, it's useful mainly when comparing similar companies. Because it doesn't take any expenses or debt into account, the ratio is somewhat limited in the story it tells.62
Price-To-Sales Ratio = share price/revenue per share
Price-To-Book Ratio (P/B Ratio) – A ratio used to compare a stock's market value to its book value. It is calculated by dividing the current closing price of the stock by the latest quarter's book value per share. Also known as the "price-equity ratio".63
A lower P/B ratio could mean that the stock is undervalued. However, it could also mean that something is fundamentally wrong with the company. As with most ratios, be aware that this varies by industry. This ratio also gives some idea of whether you're paying too much for what would be left if the company went bankrupt immediately.64
Price-To-Book Ratio (P/B Ratio) = stock price/(total assets-intangible assets and liabilities)
60
Investopedia, viewed 03. March, 2008, www.investopedia.com
61
Investopedia, viewed 03. March, 2008, www.investopedia.com
62
Investopedia, viewed 03. March, 2008, www.investopedia.com
63
Investopedia, viewed 03. March, 2008, www.investopedia.com
64
In his book “Financial statement analysis” Dr Andrew Temte points out ten ratios appropriate for interpreting how well management operates a business and assessing the overall operating performance.65
1. Total asset turnover – net sales/average total assets66
2. Fixed asset turnover = net sales/average net fixed assets67
3. Equity turnover = net sales/average equity
4. Owners’ equity = common stock + paid-in capital + retained earnings 5. Net profit margin = net income/net sales
6. Gross profit margin = gross profit/net sales
7. Operating profit margin = operating profit/net sales = EBIT/net sales 8. Return on assets = (net income + interest expense)/average total assets
9. Return on owner’s equity = (net income – preferred dividends)/average owners’ equity 10. Return on total equity = net income/average total equity
Looking at the above mentioned list we can notice that Dr. Temte actually offers two new financial indicators, which he finds relevant and important for measuring management performance compared to the ones offered by Webster. Those are equity turnover and owners’ equity. Looking at the other eight indicators offered by Dr. Temte we can notice that they are either the same or quite similar to the ones offered by Webster. The differences are either in the wording or the formula used, which is mathematically different, but produces the same result or the exact method of calculation. In addition Webster offers the more general indicator shareholders equity while Dr. Temte breaks it down to return on owner’s equity and return on total equity. The meaning of the indicators is essentially the same.
Another extremely important perspective that I would like to add is the one of one of the most respected and used in the business world data providers. This is the perspective of Thomson Reuters – the leading source for intelligent information for businesses and professionals. According to them the ratios relevant for measuring management effectiveness are:
• Return On Assets
65
Temte, Andrew (Editor), 2005, ”Financial Statement Analysis” page 119
66
Temte, Andrew (Editor), 2005, ”Financial Statement Analysis” page 114
67
• Return On Investment • Return On Equity68
4.2.3 The relevance of financial indicators to leadership
There is no doubt that all the above mentioned financial indicators are very important and widely used in the field of finance and investment, As mentioned above though their appropriateness varies from situation to situation. This occasion is certainly not an exception. Exactly on the contrary. In order to make sure that the analysis makes sense the most appropriate for the occasion ratios need to be selected.
Based on the theoretical frameworks offered by Webster, Dr. Temte, www.investopedia.com and my personal experience in the field of investment banking I would like to offer a selection of the financial indicators I personally consider most appropriate for the occasion.
There are in general two basic criteria, which are most closely watched by the investors and analysts and based on which the performance of leadership is evaluated. Those are growth and profitability. That automatically leads to the conclusion that especially since they are the most widely used and popular ones all the financial indicators indicating a company’s profitability mentioned above are of interest to the research. In addition to that the trends throughout time indicating the growth (both positive and negative) are also of primary interest to the research.
There is no doubt that the three ratios relevant to investing activities mentioned above need to be included in our list of appropriate for the occasion ratios. They are an integral part of the basis used by investors and analysts in their decision-making process and play an instrumental role in the process of shareholder value creation.
In addition to the profitability ratios and the ones relevant to investing activities I would like to point out two others I consider relevant to the topic.
68Thomson Reuters, viewed on 05.05.2008, http://stocks.us.reuters.com/stocks/ratios.asp?
symbol=UBS#Management%20Effectiveness
• The Total Assets Turnover (TAT) Ratio – As a key indicator of how well a company generates sales from assets.
• The Debt-to-Equity Ratio – As a key indicator of the percentage of debt tied up in the owner’s equity and a key driver behind the cost of capital of a company
There are of course also other financial indicators mentioned above, which one could argue are relevant to the topic. The inventory turnover for instance is a very important indicator of management’s performance in the retail business. The fixed assets turnover is a very important indicator for management’s performance in industries like airline where the amount of fixed assets is immense. The reason for me to not include them in my list is the fact that the purpose of this work is to come up with a general framework to serve as basis for analysis. The introduction of such ratios to the further analysis of this paper may lead to a bias, which is not desirable in this case.
That leads us to the following list of financial indicators and the trends they indicate throughout time:
1. Gross Profit Margin (GPM) 2. Operating Profit Margin (OPM) 3. Net Profit Margin (NPM) 4. Return on Investment (ROI) 5. Return on Assets (ROA) 6. Return on Equity (ROE) 7. Earnings per Share (EPS)
8. Price-Earnings Ratio (P/E Ratio) 9. Price-To-Sales Ratio (Price/Sales) 10. Price-To-Book Ratio (P/B Ratio)
11. Total Assets Turnover (TAT) Ratio – As a key indicator of how well a company generates sales from assets.
12. Debt-to-Equity Ratio – As a key indicator of the percentage of debt tied up in the owner’s equity and a key driver behind the cost of capital of a company.