ACTA UNIVERSITATIS
UPSALIENSIS UPPSALA
Digital Comprehensive Summaries of Uppsala Dissertations from the Faculty of Science and Technology 1257
Raman Spectroscopy and
Hyperspectral Analysis
of Living Cells Exposed to
Nanoparticles
LINNEA AHLINDER ISSN 1651-6214 ISBN 978-91-554-9250-2Dissertation presented at Uppsala University to be publicly examined in Häggsalen, Ångströmlaboratoriet, Lägerhyddsvägen 1, Uppsala, Thursday, 4 June 2015 at 09:00 for the degree of Doctor of Philosophy. The examination will be conducted in English. Faculty examiner: Professor Ioan Notingher (The University of Nottingham).
Abstract
Ahlinder, L. 2015. Raman Spectroscopy and Hyperspectral Analysis of Living Cells Exposed to Nanoparticles. Digital Comprehensive Summaries of Uppsala Dissertations from the Faculty of Science and Technology 1257. 72 pp. Uppsala: Acta Universitatis Upsaliensis.
ISBN 978-91-554-9250-2.
Nanoparticles, i.e. particles with at least one dimension smaller than 100 nm, are present in large quantities in ambient air and can also be found in an increasing amount of consumer products. It is known that many nanomaterials have physicochemical properties that differ from physicochemical properties of the same material in bulk size. It is therefore important to characterize nanoparticles and to evaluate their toxicity. To understand mechanisms behind nanotoxicity, it is important to study the uptake of nanoparticles, and how they are accumulated. For these purposes model studies of cellular uptake are useful. In this thesis metal oxide and carbon-based nanoparticles have been studied in living cells using Raman spectroscopy. Raman spectroscopy is a method that facilitates a non-destructive analysis without using any fluorescent labels, or any other specific sample preparation. It is possible to collect Raman images, i.e. images where each pixel corresponds to a Raman spectrum, and to use the spectral information to detect nanoparticles, and to identify organelles in cells. In this thesis the question whether or not nanoparticles can enter the cell nucleus of lung epithelial cells has been addressed using hyperspectral analysis. It is shown that titanium dioxide nanoparticles and iron oxide nanoparticles are taken up by cells, and also in the cell nucleus. In contrast, graphene oxide nanoparticles are mainly found attached on the outside of the cell membrane and very few nanoparticles are found in the cell, and none have been detected in the nucleus. It is concluded that graphene oxide nanoparticles are not cytotoxic. However, a comparison of Raman spectra of biomolecules in cells exposed to graphene oxide, unexposed cells and apoptotic cells, shows that the graphene oxide nanoparticles do affect lipid and protein structures. In this thesis, several multivariate data analysis methods have been used to analyze Raman spectra and Raman images. In addition, super-resolution algorithms, which originally have been developed to improve the resolution in photographic images, were optimized and applied to Raman images of cells exposed to submicron polystyrene particles in living cells.
Keywords: Raman spectroscopy, Hyperspectral analysis, Multivariate data analysis,
Nanotoxicology, Graphene oxide, Iron oxide, Titanium dioxide, Cells
Linnea Ahlinder, , Department of Engineering Sciences, Box 534, Uppsala University, SE-75121 Uppsala, Sweden.
© Linnea Ahlinder 2015 ISSN 1651-6214 ISBN 978-91-554-9250-2
Raman, är det en kollega
till dig eller?
List of Papers
This thesis is based on the following papers, which are referred to in the text by their Roman numerals.
I Ahlinder, L., Ekstrand-Hammarström, B., Geladi, P., Österlund, L. (2013) Large uptake of titania and iron oxide nanoparticles in the nucleus of lung epithelial cells as measured by Raman imaging and multivariate classification. Biophysical Journal, 105(2):310–319
II Ahlinder, L., Wiklund Lindström, S., Lejon, C., Geladi, P., Österlund, L. (2015) Super-resolution Raman mapping of living cells exposed to submicron polystyrene particles. Submitted to
Analytical Chemistry
III Hellman, B., Ahlinder, L., Ekstand-Hammarström, B., Österlund, L. (2015) Evidence of nuclear uptake and increased DNA damage in human lung epithelial cells after low dose exposure to reactive titanium dioxide nanoparticles.
Manuscript.
IV Ahlinder, L., Henych, J., Wiklund Lindström, S., Ekstrand-Hammarström, B., Stengl, V., Österlund, L. (2015) Graphene oxide nanoparticle uptake and its toxicity on living lung epithelial cells. Submitted to ACS Nano.
V Andersson, P., Lejon, C., Ekstrand-Hammarström, B., Akfur, C., Ahlinder, L., Bucht, A., Österlund, L. (2011) Polymorph- and size-dependent uptake and toxicity of TiO2 nanoparticles in
living lung epithelial cells. Small, 7(4):514-523
Reprints were made with permission from the respective publishers.
Comments on contribution
I Conducted all confocal Raman spectroscopy measurements and PCCS measurements, performed all multivariate data analysis and analysis of TEM images, wrote the main part of the paper and took part of the design of the study.
II Conducted all confocal Raman spectroscopy measurements of submicron particles and cells, conducted all PCCS
measurements, performed all multivariate data analysis and image analysis, wrote the main part of the paper and took the main part of the design of the study.
III Conducted all confocal Raman spectroscopy measurements, performed all analysis of Raman spectra, performed analysis of the TEM images and wrote parts of the paper. Hellman and Ahlinder contributed equally to the work.
IV Conducted all Raman spectroscopy measurements and performed all analysis of Raman spectra and TEM images, wrote parts of the paper and took part of the design of the study.
V Conducted confocal Raman spectroscopy experiments for multivariate data analysis, performed all multivariate data analysis of Raman spectra and wrote parts of the paper.
Papers not included in the thesis
Wilkinson, K., Ekstrand-Hammarström, B., Ahlinder, L., Guldevall, K., Pazik, R., Kępiński, L., Kvashnina, K., Bustorin, S., Brismar, H., Önfelt, B., Österlund, L., Seisenbaeva, G., Kessler, V. (2012) Visualization of custom-tailored iron oxide nanoparticles chemistry, uptake and toxicity. Nanoscale, 4(23):7383-7393
Summary in Swedish: Ramanspektroskopi och
hyperspektral analys av
nanopartikelexponerade celler
Nanopartiklar definieras vanligen som partiklar som är mindre än 100 nm i minst en dimension. De finns i stora mängder i luften omkring oss. De kan komma från naturliga källor, som bränder eller vulkanutbrott, eller från mänskliga aktiviteter, som trafik eller förbränningsprocesser. De kan också vara så kallade tillverkade nanopartiklar som är medvetet tillverkade för att vara små. Nanoteknologin är ett växande forskningsfält och det kan därför förväntas att tillverkade nanopartiklar, vilka redan nu finns i produkter som t.ex. solkrämer, kläder, ytbeläggningar och mikroelektronik, kommer att användas i allt fler produkter framöver. Nanomaterial har inte nödvändigtvis samma egenskaper som samma material i bulkstorlek. Storlek, förmågan att framkalla reaktiva syreradikaler, specifik yta och morfologi är några egenskaper som har visat sig vara särskilt viktiga för att förklara toxiska effekter hos dessa material. Att karaktärisera nanopartiklar och utreda små partiklars eventuella toxicitet är därför mycket viktigt.
En grundläggande del för att förstå mekanismerna bakom nanotoxicitet är kunskap om hur och i vilken utsträckning nanomaterial tas upp av celler. Detta är något som vanligen studeras i transmissionselektronmikroskop, där tunna snitt av nanopartikelexponerade celler studeras i hög förstoring. En annan vanlig metod är att märka in organeller och nanopartiklar med fluorescerande markörer för att sedan studera proverna i mikroskop. I den här avhandlingen har Ramanspektroskopi, använts för att analysera levande celler exponerade för metalloxidnanopartiklar och kolbaserade nanopartiklar. Det är en förhållandevis ny metod som inte tillämpats i så stor utsträckning inom biologiska vetenskaper. Ett mål med projektet har varit att studera nanopartikelupptaget i celler och att undersöka om celler kan nå in i cellkärnan. Kunskap om huruvida nanopartiklar kan komma in i cellkärnan kan också ge mer kunskap om vilka mekanismer som är involverade i eventuella genotoxiska effekter. Det är också viktig kunskap vid design av läkemedelstransportörer.
Till skillnad från transmissionselektronmikroskopi kräver Ramanspektroskopi ingen speciell provberedning och cellerna behöver inte snittas före avbildning. Det krävs heller inga fluorescerande markörer eller
infärgningar. En annan fördel, särskilt för studier av biologiska prover, är att vatten endast ger en svag Ramansignal.
Ramanspektra innehåller information från Ramanaktiva vibrationsmoder i molekyler eller fasta kroppar. Ramanspektroskopi kan således användas för att detektera och analysera en lång rad substanser och prover. Ramanavbildning, det vill säga insamlandet av bilder där varje pixel motsvaras av ett Ramanspektrum, är en särskilt användbart för att studera komplexa och heterogena prover.
Vid sidan av detektion av nanopartiklar i levande celler är det möjligt att analysera den spektrala informationen från biomolekyler i cellen. Ramanspektra av biomolekyler kan användas för klassificering av mätningar inuti celler och kan därmed användas för att urskilja cellkärnan eller andra organeller. Med den informationen är det möjligt att dra slutsatser om och var nanopartiklar finns i cellen. Det är också möjligt att jämföra Ramanspektra från biomolekyler uppmätta inuti nanopartikelexponerade celler och kontrollceller, d.v.s. icke exponerade celler, och på så sätt analysera biokemiska förändringar orsakade av nanopartiklar. Båda metoderna har testats i det här arbetet.
En nackdel med Ramanspektroskopi är dock att den spatiala upplösningen är låg jämfört med många andra metoder, särskilt transmissionselektronmikroskopi. I det här arbetet har upplösningen förbättrats genom att applicera superupplösningsalgoritmer. Dessa algoritmer har ursprungligen utvecklats för analys av fotografier. I den här avhandlingen har ett antal algoritmer istället använts för att förbättra Ramanbilder. Innan de testade superupplösningsalgoritmerna kan tillämpas är det nödvändigt att reducera den spektrala informationen i Ramanspektra till ett fåtal variabler som karaktäriserar provet. Detta eftersom superupplösningsalgoritmerna endast kan hantera en eller ett fåtal parametrar, medan Ramanspektra kan innehålla hundratals eller tusentals parametrar (d.v.s. olika vågtal). Olika tillvägagångssätt för att minska antalet variabler, såsom principalkomponentanalys och multivariat kurvupplösning med alternerande minstakvadratanpassning, har testats i det här arbetet.
Klassificering av pixlar, jämförelse mellan spektra som samlats in från olika grupper av celler, såväl som variabelselektion är alla exempel på multivariata dataanalysmetoder. Multivariat dataanalys är viktiga verktyg för att utvinna information ur Ramanspektra och i det här arbetet har dessa metoder använts för att studera hur nanomaterial växelverkar och tas upp i levande celler, vilket bl.a. kan ge en större förståelse för risker med nanomaterial, men också möjligheter, t.ex. för medicinsk diagnostik eller läkemedelsutveckling. Ramanspektroskopi föreslås här som ett intressant komplement till etablerade metoder för att avbilda nanopartikelexponerade celler och också som en intressant metod för att studera biokemiska förändringar i celler.
Contents
Introduction ... 9
Hyperspectral imaging ... 10
Nanotoxicology ... 11
Nanoparticle uptake and genotoxicity ... 13
Materials and methods ... 15
Raman spectroscopy - fundamentals ... 15
Confocal Raman spectroscopy and spatial resolution ... 18
Spectral pretreatment ... 21
Transmission electron microscopy and other methods to study nanoparticles in cells ... 24
Particle characterization ... 25
Hydrodynamic diameter and photon cross correlation spectroscopy .. 28
Particles ... 29
Iron oxides ... 29
Titanium dioxide ... 31
Polystyrene ... 31
Graphene oxide ... 32
Cells and exposure conditions ... 32
In vitro assays ... 33
Hyperspectral data analysis ... 35
Methods ... 36
Principal component analysis ... 36
Multiple linear regression ... 37
Projection to latent structures ... 37
Multivariate curve resolution alternating least squares ... 39
Applications ... 40
Variable selection and visualization ... 40
Analysis of spectral differences ... 41
Design of experiments ... 42
Super-resolution ... 43
Results and discussion ... 46
Nanoparticle uptake (Paper I, IV) ... 46
Nanoparticles in the cell nucleus (Paper I, III) ... 49
Comparison of control cells and cells exposed to nanoparticles (Paper
IV, V) ... 57
Conclusions and outlook ... 61
Acknowledgements ... 63
Abbreviations
AFM Atomic force microscopy ALS Alternating least squares CCD Charge coupled device
CCF Central composite face-centered DLS Dynamic light scattering
EDS Energy-dispersive x-ray spectroscopy EELS Electron energy loss spectroscopy IEP Isoelectric point
IR Infrared
LDA Linear discriminant analysis
MCR-ALS Multivariate curve resolution alternating least squares MLR Multiple linear regression
MVDA Multivariate data analysis NA Numerical aperture NIR Near infrared
NMR Nuclear magnetic resonance spectroscopy NPC Nuclear pore complex
OPLS Orthogonal projection to latent structures PCA Principal component analysis
PCCS Photon cross correlation spectroscopy PLS Projection to latent structures
PLS-DA Partial least squares discriminant analysis PSF Point spread function
ROS Reactive oxygen species SEM Scanning electron microscopy SLS Static light scattering
SNR Signal-to-noise ratio
SUS Shared and unique structures SVD Singular value decomposition TEM Transmission electron microscopy TV Total variation
UV Ultraviolet XRD X-ray diffraction
Introduction
Raman spectroscopy and Raman imaging, i.e. collection of spatially resolved images where each pixel corresponds to a Raman spectrum, are very useful methods when studying complex and heterogeneous samples1–24. Some key advantages are that Raman spectroscopy is nondestructive and usually requires very little sample preparation1. Another advantage, especially for biological samples, is that water gives only a weak Raman signal1.
Raman spectra contain information from Raman active vibrational modes in molecules and Raman active phonon modes in crystalline materials and it can thus be used for detection and analysis of a broad range of substances and samples25.
In this thesis, Raman spectroscopy and Raman imaging have been used to analyze living cells exposed to metal oxide nanoparticles and carbon based nanoparticles. One goal of the project has been to study the uptake of nanoparticles in cells and to investigate if nanoparticles can enter the cell nucleus. Nanoparticles present in the cell nucleus can give more insights in mechanisms involved in possible genotoxicity26,27.
Besides detection of nanoparticles in living cells, it is possible to analyze the spectral information from biomolecules2–13,21–23. Raman spectra of biomolecules can be used for classification on a subcellular level10,11 and it is thus possible to draw conclusions if nanoparticles are inside the cell nucleus. It is also possible to compare Raman spectra of biomolecules in cells exposed to nanoparticles and Raman spectra of biomolecules in control cells and thus analyze biochemical modifications induced by the particles2–9. Both approaches have been used in this thesis.
Drawbacks with Raman spectroscopy are possible laser-induced damaging effects28 and the spatial resolution, which is low compared to many other imaging methods, especially transmission electron microscopy (TEM)29. In this thesis, the resolution has been improved by application of super-resolution algorithms30–33. These algorithms, which originally have been developed for analysis of photographs, have here been optimized and applied to Raman images. Before employing super-resolution, it is necessary to reduce the number of variables, i.e. wavenumbers, since these super-resolution algorithms are developed to only handle one, or a few, wavenumbers, while Raman spectra contain hundreds or thousands of wavenumbers34. Approaches for variable selection, such as principal
component analysis (PCA)35–37 and multivariate curve resolution alternating least squares (MCR-ALS)24,38,39 have all been tested in this thesis.
Classification of pixels, comparison of spectra acquired from control cells or cells exposed to nanoparticles as variable selection are all examples of multivariate data analysis (MVDA) methods. MVDA is very advantageous to extract information from Raman spectra and in this thesis, these methods are applied to Raman images for a rather new application, i.e. nanotoxicology and with potential use in medical technology, diagnostics, and drug delivery2–23. Raman spectroscopy is here proposed as a non-destructive, label-free method which gives complementary information to established methods for imaging of cells exposed to nanoparticles, such as TEM, which requires a vast sample preparation29,40, and fluorescence microscopy, which requires fluorescent labels and dyes29.
Hyperspectral imaging
A hyperspectral image is an image where each pixel corresponds to spectral data1,24. An illustration is in Figure 1, which shows a video image and a Raman image of a cell exposed to nanoparticles. In contrast to photos, where each pixel contains information of the levels of red, blue and green, i.e. three wavenumbers, each pixel in hyperspectral images can contain hundreds or thousands of wavenumbers1,24. The spectral data can be used for detection of substances as well as for classification and prediction2–24 The spatial information gives additional information and facilitates analysis of the composition of the sample and the spatial distribution of different components in the sample14–19,24.
Figure 1. A hyperspectral Raman image of a A549 cell and corresponding video image with mapping positions marked by +. The pseudo-color map shows the intensity for the strongest Raman band from goethite nanoparticles, marked by an arrow.
Raman images are usually collected by mapping, which means that pixels are collected sequentially by moving the sample in pre-defined steps1. Imaging, on the other hand, refers to the case when all pixels of the image are collected simultaneously, usually one wavenumber at a time 1.
Raman mapping, the spatial resolution of Raman images and how to visualize and analyze spectral data in Raman images are discussed in more detail in this thesis.
Nanotoxicology
Nanoparticles are defined as all particles with at least one dimension smaller than 100 nm27,41–46. Sometimes they are, incorrectly, also defined as particles less than 1 µm in diameter in the literature47,48.
Nanoparticles can be particles in ambient air, originating from natural sources, such as fires or volcanic eruptions, or originate from anthropogenic sources, such as traffic or combustion processes48. They can also be in form of so called engineered nanoparticles that are intentionally designed to be small48. Nanoparticles are often used in products such as food, sun screens, clothes, microelectronics and many more49.Nanotechnology is a growing field of research and engineered nanoparticles can therefore be expected to be used in an increasing number of products and processes50. It is therefore important to evaluate the toxicity of these materials50.
The size is one of the key characteristics behind nanotoxicity27,42,48,51–54. Nanoparticles are small enough to be transported in the body through other routes than larger particles, and they are also small enough to enter cells48,51,52. Nanoparticles can therefore interact with cells and organelles, which larger particles are not able to access48,51,52 and they can also act like a “Trojan horse” and deliver toxic substances into cells or dissolve and form toxic ions41,43,44,51,53,55. Besides the size of the primary particles, particle agglomeration is important48. Macrophages are able to clear large particles more effectively than small ones and agglomerated particles may, thus, be less toxic48.
An important mechanism behind nanotoxicity is the formation of reactive oxygen species (ROS)26,43,48,51, such as free radicals that contain oxygen or electrophilic molecules such as hydrogen peroxides42. Nanoparticles which contain transition metals, such as iron nanoparticles, are especially reactive and can induce ROS41. There are also several observations on toxic effects of nanoparticles contaminated with transition metals41. One example of that is manganese, which often is used in the synthesis of graphene oxide56. Graphene oxide contaminated with manganese is reported to be cytotoxic, to reduce the metabolic activity and to cause membrane injury56, while chemically pure graphene oxide is biocompatible57. Many nanoparticles form ROS directly on the surfaces via Fenton-type reactions48 or by
reactions where nanoparticles act as a catalyst43,48,51,53. ROS can also be induced if nanoparticles interact with cell structures such as mitochondria26,43,48,51. The effects of ROS, if they are not neutralized by antioxidants, is an imbalance, i.e. oxidative stress, and an ensuing inflammatory response, where cytokines are released48,51. Eventually, oxidative stress may lead to cell death, which is something that generally occurs after exposure to quite high doses26,51. At lower doses, oxidative stress may lead to more subtle, but still harmful, effects, such as DNA damage26,48, protein denaturation43,48, effects on signaling functions48 and gene transcription48. Other examples of complications are membrane damage43 and inflammation that may lead to fibrosis and cancer47.
Another key characteristic of nanoparticles is the surface area27,42–44,48,54. Nanoparticles have large specific surface area compared to larger particles, and they have therefore many possible sites for chemical reactions27,48,49,51 and many atoms and molecules adhered to the surfaces41,48,50,51,54. Proteins bound to the surfaces, referred to as the protein corona, have been reported to play a key role in the uptake and toxicity of nanomaterials and something that can alter many properties, such as the surface properties, the dissolution and the agglomeration behavior43,44,53. The protein corona can also contain toxic molecules41,43. A large surface area can thus both give toxic effects via the characteristics of the surfaces themselves and via toxic surface-bound molecules41,43. Adverse effects can also arise if reactive nanoparticles bind to proteins and unfold them53.
It is reported that particle morphology plays an important role in the toxicity of nanoparticles41,44,48,51,53,54,58. One example is asbestos fibers, especially the crocidolite form of asbestos, which have rod-like shape and cannot be engulfed completely by phagocytic cells48,51,54. The asbestos fibers persist in the lung and release toxic substances in the so called frustrated phagocytosis process48,51,54.
Even though it is questioned if nano-specific toxicity exists41, it is obvious that small particles can have physicochemical properties which the same material in bulk size does not have and it is therefore relevant to evaluate the toxicity of nanoparticles43,51. Raman spectroscopy facilitates studies of nanoparticles in cells, with very little sample preparation14–19. For example, staining, using fluorescent labelling techniques, or embedding the cells for sectioning, become redundant14–19. More importantly, Raman spectroscopy does not introduce potential artefacts due to sample preparation14–19. Moreover, living cells can be monitored1–24. Raman spectroscopy is thus a good complement to other, established, methods for in vitro nanoparticle-cell interaction studies14–19.
Nanoparticle uptake and genotoxicity
Cellular uptake mechanisms can be divided into energy-dependent uptake mechanisms, such as endocytosis, and passive uptake48. The most common uptake mechanism is endocytosis43, where vesicle-enclosed nanoparticles are delivered to the cytosol59. Nanoparticles which are able to disrupt the vesicles by adsorption of protons may also appear free in the cytosol after endocytosis59. Only particles which are smaller than ca 100 nm can be taken up via the most common types of endocytosis43,59.
The nanoparticle uptake is dependent on cell type43 and cell cycle phase60. An obvious example on cell type dependence is phagocytic cells, which are the only cells that can engulf nanoparticles via phagocytosis, a specific form of endocytosis43. Red blood cells are another example of cell type dependency43. They are not able to take up nanoparticles via endocytosis, but have, on the other hand, been shown to take up nanoparticles via passive diffusion43.
It is suggested that positively charged particles are taken up more easily by cells because of the negatively charged cell surfaces53,56. Particles in biological systems are, however, surrounded by the protein corona, which usually gives a negative zeta potential53, i.e. a measure of the surface charge42. There are however reports on protein-coated particles, i.e. nanoparticles dispersed in serum, that are taken up to a larger extent compared to particles dispersed in serum-free medium42. It is probable that the protein corona affects the uptake by changing the dispersion properties of the particles42,61 and/or by interaction with receptors at the cell surface42,48.
Cells are able to excrete particles from their interior to the exterior59. This is a slow process, especially for large particles59, and considered to be of minor importance60. The amount of nanoparticles inside cells is, however, varying dependent on the cell cycle phase60. This is because nanoparticles are split between daughter cells when the cell divides60. Rather than being transported out of the cells, nanoparticles are diluted as an effect of cell division60.
Transport of nanoparticles to the cell nucleus is considered unlikely26, even though there are several reports on nanoparticles in the cell nucleus62–66. The transport route for nanoparticles to the cell nucleus is via nuclear pore complexes (NPC)67. The transport can be either passive diffusion, or active transport67. Passive diffusion is limited to very small particles because NPCs are only 8-9 nm in diameter26,63. Particles up to 39 nm in diameter can be transported through NPCs through a signal-mediated pathway63. There are also reports on nanoparticles in the cell nucleus after exposure to particle agglomerates with a diameter of 285 nm62 and 70 nm66. The mechanism behind the uptake of that large particle agglomerates is unknown. One suggested explanation is that nanoparticles enter the cell nucleus during mitosis68.
Genotoxicity can be divided into primary and secondary genotoxicity42. Secondary genotoxicity, which is regarded as the main mode of action, refers to the case when DNA damage is caused by oxidative stress26,27,42,48,69. DNA damage can also occur as a consequence of a direct interaction between nanoparticles and DNA26,27,42,69. This requires however that nanoparticles gain access to DNA, either during mitosis or by transport of particles to the cell nucleus26,27.
The spatial distribution of nanoparticles in cells is partly determined by uptake mechanisms, i.e. if particles are enclosed in vesicles, which is the case in endocytosis43,48,70, nanoparticles will be membrane bound and therefore not able to interact directly with proteins, organelles or DNA43,48,70. Even though it is known that most particles are taken up by endocytosis, there are, however, also examples of nanoparticles taken up by diffusion or adhesive interactions70, and also several reports on nanoparticles in the cell nucleus62–66.
Studies of the nanoparticle uptake and the spatial distribution in cells are important to get more information about mechanisms involved in possible toxicity, but knowledge about nanoparticle uptake is also of interest for studies of particles which are designed to interact with cells40, e.g. nanoparticles used for drug delivery65,71.
As demonstrated in this thesis, Raman spectroscopy and hyperspectral data analysis are useful methods to follow chemical modifications in cells and to detect nanoparticles inside cells. In the Materials and methods section, the theory and basic principles behind Raman spectroscopy, and especially confocal Raman spectroscopy, are presented. Also, the nanoparticles studied in this thesis are described and an overview of relevant particle characteristics and analytical methods for nanoparticle characterization are given. The Materials and Methods section also gives an introduction to nanotoxicity testing in vitro. The section Multivariate data analysis gives an overview of multivariate methods which have been used for variable selection, classification and optimization in this thesis and gives a short presentation of other applications where these methods can be of special interest. Finally, in the Results and discussion section, the main findings in Paper I-V are summarized.
Materials and methods
Raman spectroscopy - fundamentals
Light scattering from a material in which the energy of the scattered light is preserved is called elastic light scattering or Rayleigh scattering, but in 1928, Raman and Krishnan discovered that light also can scatter with a shorter or longer wavelength than the incident light, i.e. inelastic light scattering72. The discovery had previously been theoretically predicted by Smekal and was independently confirmed by Landsberg and Mandelstam shortly after the discovery by Raman and Krishnan72.
Inelastic light scattering, called Raman scattering or the Raman effect, is a rare phenomenon that is observed when a photon is scattered after excitation of an electron from a vibrational energy state to a so-called virtual energy state25. The special case when the photon is excited to an electronic state is referred to as resonance Raman scattering and it can sometimes result in a strong signal enhancement73. Resonance Raman requires that the incident light is close to an electronic transition73.
Only about 1 photon out of 106 - 108 is scattered inelastically25. The excitation can either be from a vibrational state or an excited vibrational state25. The first-mentioned results in a photon that is scattered with a lower
Figure 2. a: Rayleigh scattering. b: Stokes scattering. c: Anti-Stokes scattering. e: Resonance Raman scattering.
energy than the incident photon, referred to as Stokes scattering, and the latter results in a photon that is scattered with a higher energy than the incident photon, referred to as anti-Stokes scattering25. The final vibrational state is hence either higher (Stokes) or lower (anti-Stokes) than the initial vibrational state25. Anti-Stokes scattering is much weaker than Stokes scattering because fewer electrons are in an excited vibrational state than in a ground vibrational state25. Figure 2 depicts schematically Rayleigh scattering, Stokes scattering, anti-Stokes scattering and Resonance Raman scattering.
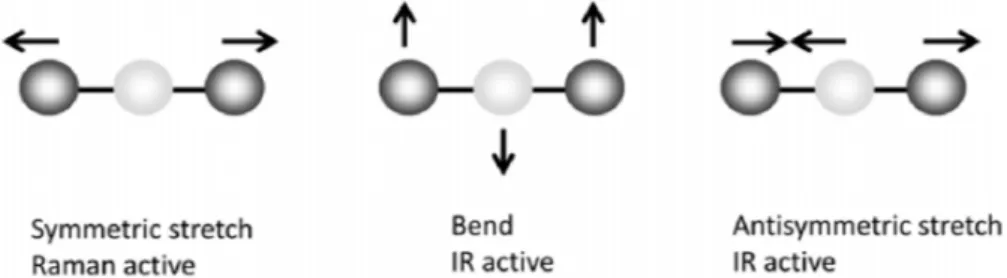
Molecules can vibrate in many different ways, i.e. for a molecule with N atoms there are 3N-6 normal vibrational modes, except for linear molecules, which have 3N-5 vibrational modes74. Vibrational modes consists of molecular bonds that stretch, bend, rock, wag or atoms that are subject to out-of-plane vibrations74. Combinations of normal modes completely describe all vibrational modes of a molecule74. These can be analyzed by vibrational spectroscopy, e.g. Raman spectroscopy or infrared (IR) spectroscopy, which are by far the most used techniques to probe vibrational modes25. All vibrations are, however, not Raman active or IR active25. The selection rule for Raman is that the polarizability must change when the molecule vibrates, i.e. the charge distribution of the atoms projected onto the vibrational mode (or formally the normal modes which describe the vibration) must change as the molecule vibrates25. For IR, on the other hand, the selection rule is that the electric dipole moment must change as the molecule vibrates25. The two methods are often complementary, e.g. all Raman active vibrational modes in molecules with a center of symmetry are silent in IR25. Many vibrational modes that are weak in IR are strong in Raman 1. One example is water, which is a weak Raman scatterer1. Figure 3 shows examples of Raman active and IR active vibrational modes.
Raman scattering can also be observed in crystals25. In that case, lattice vibrations with quantized energy, i.e. phonons, are inelastically excited (absorption process) or de-excited (emission process) by photons (see Figure 4)25. These modes have low energy and are found in the far infrared region25. Many molecular vibrations from molecules in cells are, on the other hand, in
the spectral region 800 cm-1 – 1800 cm-1, which is commonly called the fingerprint region5,75. It is thus possible to both detect metal-based nanoparticles and biomolecules simultaneously by using Raman spectroscopy.
Raman spectra show the shift between the incident light and the Raman scattered light25. Intensity, expressed in counts per second or arbitrary units, is usually plotted against wavenumber, expressed in reciprocal centimeters (cm-1)25. Peaks in Raman spectra correspond to the vibrational modes in the measured material, which give an unique fingerprint of the material25. Spectra can thus be used for detection of a wide range of materials, and these spectra are also very suitable for MVDA24. Examples of applications of Raman spectroscopy are cancer diagnostics76, forensic analysis77, detection of explosives78, material characterization79, analysis of pharmaceuticals 80 and toxicology studies2,3,7,8.
The experimental setup for Raman spectroscopy includes an excitation laser, optics and a detector, which usually is a charge coupled device (CCD)1,81. Before reaching the detector, Rayleigh scattering, i.e. the excitation wavelength, is suppressed by notch filters, which facilitates measurements of both anti-Stokes and Stokes shifts, or edge filters, which suppress all signal below a certain threshold and therefore only facilitates measurements of Stokes shifts1.
The excitation wavelength, i.e. the laser wavelength, which is used to excite vibrations in a molecule or a material, does in general not change the resulting Raman spectrum82. The excitation wavelength does, however, affect the intensity of the Raman signal82,83. The intensity of the Raman signal is proportional to λ-4, where λ denotes the excitation wavelength, i.e. a
short wavelength gives spectra with better signal-to-noise ratio (SNR)82,83. The excitation wavelength also significantly affects how much fluorescence that is generated due to electronic excitations from constituent compounds or defects in a material83. Fluorescence gives a non-specific broad background to Raman spectra and can saturate the detector and even completely obscure Raman bands83. An excitation wavelength in the near infrared (NIR) region
can be advantageous if the sample is fluorescent, since excitation wavelengths in NIR are too weak to electronically excite molecules83. Limitations with excitation wavelengths in NIR and IR are, however, that CCD:s are silicon-based and not always compatible with these wavelengths 1 and also that long wavelengths give weaker Raman signal due to the λ-4
scattering dependence 82,83.
Raman spectroscopy exists in numerous variants, ranging from microscope setups for spatially resolved analysis2–23 to setups for stand-off measurements84. Small, handheld instruments are available85, as well as specialized setups such as coherent anti-Stokes Raman spectroscopy (CARS), which take advantage of non-linear processes that give strong signal enhancement86, or surface enhanced Raman spectroscopy (SERS), which exploits electric field enhancement in the vicinity of nanostructured noble metals for signal enhancement87. There are setups where fiber-optic probes are used to collect Raman signal76, and there are special setups for medical applications, such as in vivo measurements of skin88. Confocal Raman spectroscopy, or Raman microspectroscopy, was used in Paper I-V. This method is sometimes (erroneously) called Raman imaging, even though the complete image is not generated at one time. We discuss the distinction in the next section. We can however conclude that confocal Raman spectroscopy is a setup which allows measurements of small measurement spots inside samples and facilitates collection of Raman images81,89.
Confocal Raman spectroscopy and spatial resolution
In confocal Raman spectroscopy, the laser light is focused on a small spot in the sample by an objective lens and the scattered light is collected through the same objective, usually in a in a back-scattered geometry1. Before the light reaches the detector, the light passes through a confocal hole (a pinhole), which filters light scattered out-of-focus from light scattered from the focal plane1,81. Figure 5 shows a schematic picture over the principle of confocality.
Confocal Raman spectroscopy is a very promising method for measurements of biological samples1–24. The confocal setup facilitates measurements of small measurement volumes focused inside transparent samples, such as cells, i.e. there is no need to embed and section cells to study their interior75. Since confocal Raman spectroscopy is non-destructive, it is even possible to measure living cells, provided that the system is not photo-sensitive or that the laser flux can be adjusted to be sufficiently small75. Examples of applications where confocal Raman spectroscopy has been used for analysis of cells are toxicity analysis2–9, visualization of organelles10,11, interaction of cells and drugs12,13, uptake studies14–19, measurements of cells on 3D matrices20, cancer cell identification21 and determination of cell cycle phase22,23.
Confocal Raman spectroscopy facilitates the collection of Raman images, i.e. images where each pixel corresponds to a Raman spectrum1. With confocal Raman spectroscopy it is, thus, possible to both collect spectral and spatial information, which is very advantageous for analysis of heterogeneous samples1. Raman images are usually collected by mapping, which means that pixels are collected sequentially by moving the sample in pre-defined steps, either using a motorized table, which typically allows step sizes down to 0.1 μm, or by a piezoelectric controlled table, which allows step sizes down to a few nm75. There is also an implementation where the laser beam, instead of the sample stage, is moved by using piezo-controlled mirrors81. This implementation, called the DuoScan configuration in the Horiba JobinYvon instrument, was employed in Paper II. With confocal Raman spectroscopy, it is also possible to collect three-dimensional images by moving the focus, i.e. moving the objective up or down1,83,90,91. The procedure to sequentially collect pixels, each of them corresponding to a Raman spectrum, is referred to as mapping, while imaging refers to the case when all pixels are collected by an array detector, one wavenumber at a time1. The latter is not compatible with a confocal setup, since the whole sample area is illuminated1,81.
The spatial resolution, i.e. the level of details that can be distinguished in an image, is related to the separation between the pixels, here referred to as the step size, and the measurement volume, which in turn is related to the laser illuminated spot1,81,92 In 1873, Ernst Abbe described the diffraction limit for a microscope as:
d =2NAλ (1),
where λ is the wavelength, and d is the radius of the focused light94
. NA is the numerical aperture:
𝑁𝑁𝑁𝑁 = 𝑛𝑛 sin 𝜃𝜃 (2),
where n is the refractive index of the medium and θ is the half angle of the maximum cone of light that can enter or exit the objective81,93. In a confocal setup the diameter of the focused light can be described by the Airy disc diameter:
dAiry disc=1.22λNA (3),
where λ is the excitation wavelength81,93. According to the Rayleigh criterion, two objects can be resolved laterally if they are separated by the radius of an Airy disc90. The Rayleigh criterion is however not an accurate description of the true resolution in a Raman image because it does not take into account that spectra from sample spots separated by the Airy disc radius have spectral profiles contaminated with spectral information from its neighbors95. Furthermore, in reality, and especially for transparent samples, light is also collected from areas out-of-focus1,83,90,93. An apparent example is CaF2, which is a commonly used sample substrate and which is a much
stronger Raman scatterer than e.g. cells75. The characteristic Raman band from CaF2, at 322 cm
-1
, is often evident in the spectra of cells on CaF2 even
if focus is several μm above the CaF2 surface. The real measurement
volume, especially in the axial direction in the microscope, is thus difficult to quantify and is sample specific90. The collection of light from areas out-of-focus can, to some extent, be minimized by the use of objectives with high NA90. Simple approximations are also not appropriate for the axial direction since spherical aberration can introduce severe artifacts90,93. If the objective does not match the refractive index of the sample, the focus is shifted deeper into the sample and the depth is thus incorrectly depicted90,93.
To minimize these problems, objectives with NA 0.9 were used in Paper I-V. Moreover, all measurements of cells were performed with a water immersion objective, which matches the refractive index much better than objectives which are designed to be used in air90. Still, CaF2 is apparent in all
measurements from cells. This is difficult to avoid, since CaF2 is a much
under the cell. It is not likely that nanoparticles outside the cell give the same spectral contribution as CaF2, partly because the cells were thoroughly rinsed
before analysis so that there are negligible amounts of free particles in the suspension and partly because the particle agglomerates are comparatively small and few, especially at the low concentration used in Paper I-V, and give very little out-of-focus contribution to spectra, if any. In Paper V, mappings in the axial direction of cells showed that the contribution from titanium dioxide nanoparticles outside the cells were negligible. However, in paper IV, an unusual large fraction of the spectra acquired from cells exposed to graphene oxide nanoparticles showed Raman bands from nanoparticles. It was suspected that a large fraction of the cell surfaces were covered with these particles. This was also confirmed in TEM. The same extensive particle adhesion seen for graphene oxide was not observed for any other of the particles which were studied in Paper I, III or V.
Besides the laser illuminated spot, the spatial resolution is also dependent on the step size1,81,92. When a small sample is mapped, the options are to either avoid large overlaps in the laser-illuminated areas, i.e. to make sure that each pixel only contains information from a specific measurement volume, or by measuring with smaller step sizes1,81,92. The latter method gives Raman images with higher resolution1,81,92. Small step sizes will, however, lead to a long measurement time. For photosensitive samples, such as cells28, it may therefore be difficult to collect enough pixels to achieve a good spatial resolution. An alternative which was tested in Paper II, is to use resolution, i.e. image processing algorithms that finds a super-resolution image from one, or a sequence of, low super-resolution image(s) and a blur function30–34.
Spectral pretreatment
Raman spectra can contain noise and artefacts, originating from the instrument as well as the sample83. Examples of instrument effects are detector effects, such as defective pixels, cosmic rays or frequency shifts83. Many of them can easily be corrected, e.g. by subtracting the shift, calculated from a known, well-defined peak in the spectrum, or by replacing anomalous pixels with interpolated values24.
An example of a sample effect is sample heating, which can introduce severe artefacts, such as sample degradation83. To not damage living cells during Raman measurements, it is critical to optimize the excitation wavelength, laser power and measurement time28. Examples of signs of photo-damage are blebs or cells that are detaching from the substrate96. Cells in Paper I-V were inspected for such signs before and after measurements and they had most often normal shape after measurement times around 1 h and employing a laser with excitation wavelength 514 nm and 10-13 mW on the sample.
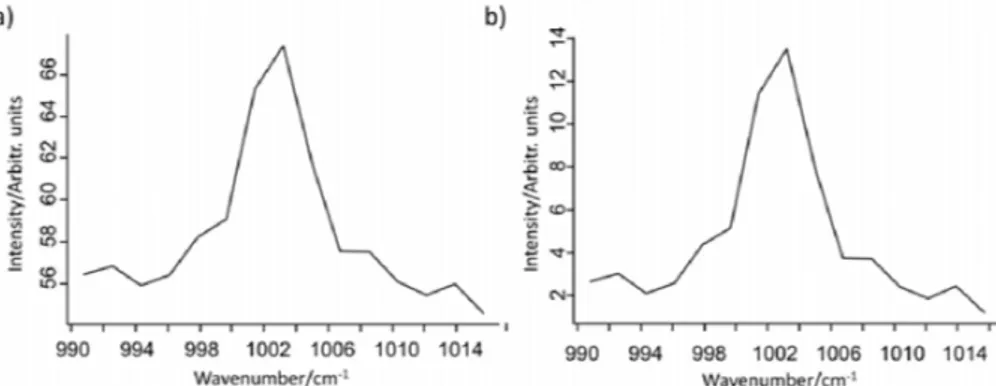
Another sample effect is fluorescence, which often contribute with a complicated background, especially in biological samples and especially for excitation lasers in the visible wavelength region83,97,98. Several instrumental setups allow for suppression of the fluorescence. One method is to use time-gating83. Raman scattering happens instantly since vibrational coupling is very efficient, while fluorescence takes several nanoseconds, and sometimes even longer, and is determined by the life-time of electronic states83. This approach requires pulsed lasers and specialized optics and is therefore not straightforward to apply83. Fluorescence can instead in many cases be removed with background-correction algorithms24,83,97–99. Popular background correction algorithms use polynomial fitting to calculate the fluorescence background, which has a much slower intensity variation than the Raman spectrum24,83,98,100. Other methods use the wavelet transform97 or derivatives97 to correct the background. Another option is to use wavelets for peak detection and width estimation before fitting a background97. Care must be taken so that the amplitude of the Raman peaks is not decreased when employing background-correction algorithms99. Figure 6 shows a Raman spectrum before and after background-correction. As depicted in Figure 6, the amplitude of the Raman band at 1005 cm-1 (due to the phenylalanine ring breathing mode5), which is a well-defined and sharp Raman band from cells, has approximately the same amplitude before and after background correction97.
Noise originates from many sources. One of them is the readout noise of the CCD detector1. By using an electron multiplying CCD, the number of electrons is multiplied before the readout noise is added and weak signals are thus enhanced in relation to the readout noise1. Other noise is related to sample characteristics1. A low SNR is common for biological samples, which often have a weak Raman signal and at the same time are sensitive for
Figure 6. Raman spectra of a A549 cell a) before and b) after background-correction with an algorithm that uses wavelets for peak detection and width estimation and thereafter fit a background with penalized least squares. The Raman band is the ring breathing mode of phenylalanine, which usually is strong and well-defined in Raman spectra from cells.
photo damage and allow for a limited measurement time28. Poor spectral quality can sometimes be reduced by application of noise reduction algorithms such as Savitzky-Golay filters, which finds smoothed values by fitting neighboring data points to a polynomial24. This approach was used in Paper II to improve the spectral quality prior background correction in a Raman image of polystyrene submicron particles. This image had unusual poor spectral quality due to a short measurement time. For other data analyses in this thesis it was considered unnecessary to employ smoothing prior data analysis.
The intensity of Raman bands can change over time, depending on fluctuations of laser power101 or ambient temperature101. If data is collected over long time, for example a measurement series that spans over several measurement days, it may be necessary to normalize data101. A simple normalization method is normalization against the Euclidean norm, i.e. vector normalization98 . Figure 7 shows a Raman spectrum of a cell before and after application of background correction, frequency calibration and vector normalization.
Figure 7. Mean spectrum from A549 cells. a) raw data b) after background-correction, frequency calibration and normalization.
Transmission electron microscopy and other methods to
study nanoparticles in cells
TEM, which allows studies of nanoparticles at high magnification, has hitherto been the most commonly used analytical tool for visualization of nanoparticles in cells29,102. With TEM, images are generated by transmitting a beam of electrons with high energy, typically around 100 kV, through ultrathin (typically < 100 nm) sections of the sample102. Depending on sample thickness and cross section for electrons in the sample atoms, which in turn depends on atomic number of the element, regions of the sample will be depicted dark or light in the images in so called bright field imaging mode102. For high resolution TEM, it is possible to resolve individual particles102. Visualization of individual nanoparticles in cells may however be challenging, since the cell contribute to a complicated background102. The resolution is, moreover, dependent on particle characteristics102. It can be difficult to analyze materials with low electron-density, such as carbon based nanoparticles, with good resolution29,102,103. Even for electron dense particles, such as metal nanoparticles, it can be difficult to distinguish small particles from the background102,104. When employing TEM, electron-beam damaging may be an issue, and the method is not well-suited for collection of large amount of data for statistical analysis29. Another drawback is the sample preparation, which is laborious and involves embedding and sectioning with a microtome, i.e. an instrument equipped with glass or diamond knives, used to cut the sample into ultrathin sections102. Toxic stains is also necessary in the sample preparation102. Contaminants can be introduced in many of the sample preparation steps102 and can sometimes be mistaken for nanoparticles104. TEM equipped with analytical accessories for elemental analysis is a good tool to chemically identify nanoparticles in TEM29. Energy-dispersive x-ray spectroscopy (EDS), and electron energy loss spectroscopy (EELS) are examples of such techniques29,104. Even though TEM is difficult to use for quantitative analysis, it is still arguably the best, and most used, analytical tool for studies of nanoparticles in cells with respect to the spatial resolution102. TEM was used in Paper I, III-V for visualization of nanoparticles in cells.
Other popular methods for visualization of nanoparticles in cells are based on fluorescence, e.g. confocal microscopy, where fluorescent labeled nanoparticles and cells are studied29,40,59,70. The method has most often low spatial resolution, compared to e.g. TEM,59 even though there have been recent advancement in super-resolution microscopy based on fluorescent molecular detection, such as super-resolved fluorescence microscopy (awarded Nobel prize in chemistry 2014)105. A limitation which is common for all methods that are based on fluorescence is that most particles do not have intrinsic fluorescence and therefore have to be labelled by elaborate synthetic methods to be detected 29. Further, added fluorescent markers will
change the physicochemical properties of the particles and may thus change important characteristics behind nanotoxicity29. Flow cytometry, such as fluorescence-activated cell sorting (FACS) is another fluorescence-based method used for studies of nanoparticle uptake29,106. FACS facilitates a rough estimation of the nanoparticle uptake by analysis of the scattered light and the fluorescence from cells in a flow chamber106.
Confocal Raman spectroscopy, which facilitates a label-free and spatially resolved detection of nanoparticles14–19, is a good alternative for fluorescence microscopy and a good complement to TEM. Even though the spatial resolution is far from the one that is achieved for TEM, it is still useful for studies of nanoparticles in cells. With confocal Raman spectroscopy it is possible to identify organelles such as cell nucleus (Paper I) and mitochondria107 and it is possible to unambiguously detect metal-based nanoparticles (Paper I, III, V) as well as carbon-based nanoparticles (Paper II, IV).
Particle characterization
To be able to address toxicological effects of nanoparticles, it is of utmost importance to characterize primary particle size distribution, chemical composition, surface area, surface chemistry, surface charge and agglomeration size54. In addition, aspect ratio is important for non-spherical particles such as nano-fibers54. Solubility, stability in ultraviolet (UV) and thermal stability are important metrics to evaluate biopersistence54.
Since the relationship between physicochemical characteristics and toxicity is complex, it is necessary to thoroughly characterize nanomaterials in relevant medium54. Parameters such as pH and ion strength, affect the ions and molecules associated with the particles and hence the agglomerate size108. To avoid particle agglomeration and particle aggregation, it is recommended to use a dispersion medium which contains proteins, for example bronchoalveolar lavage fluid or serum61,108. In Paper I-III and V, particle sizes were evaluated in cell medium supplemented with serum, which gives a much more relevant particle size distribution than particle size distributions received after measurements of particles in e.g. phosphate buffered saline. Key physicochemical properties which have been characterized in this thesis are primary particle size, particle size distribution, specific surface area, zeta potential (surface charge), composition and shape42,45,51–54.
The size determines the reactivity as well as the number of surface-bound molecules27,42,48,51–54. Shape is connected to reactivity 41 and plays also a role in the ability of particles to dissolve44. There are numerous analytical methods available for size measurements45,46. The primary particle size of dry particles can for example be measured with electron microscopy45,46
(Paper I, III-V), either scanning electron microscopy (SEM) or TEM. In SEM, images are acquired by detection of the back scattered electrons that are received when performing raster-scans with a focused electron beam over the sample109. Particles can be studied in SEM after deposition of a low concentration of particles on a filter or similar, while particles must be deposited on conductive grids, such as copper grids or gold grids, for TEM analysis109. Particle sizes are obtained from the electron microscopy images by image analysis tools109. In addition to particle size, it is possible to determine the particle shape by employing these techniques46.
Another option for primary particle size determination and shape determination is X-ray diffraction (XRD)46 (Paper I, V). In XRD, the particle sizes are calculated by an analysis of the intensity and angels of the diffracted beams which are scattered when x-rays hit the material110. The thin graphene oxide nanosheets which were studied in Paper IV were also measured with atomic force microscopy (AFM), where the surface is analyzed by scanning the sample with a probe111. The force between the probe and the sample facilitates measurements of the topography of the sample111. In Paper IV, this method was used to determine the thickness of the particles.
Nanoparticle suspensions are rarely stable and nanoparticles most often appear in agglomerates42,43,45,46. Sometimes, the particle shape is of minor significance because of the particle agglomeration53. The particle size distribution must therefore be considered for complete characterization of the nanoparticle size45,46. Agglomeration can be avoided with the use of surfactants, but they change “true” exposure conditions, and may also be cytotoxic, and should therefore be avoided for toxicity measurements43,54. It is instead common to use ultrasonication baths, or a ultrasonication probes to break apart agglomerates54.
Examples of analytical methods for particle size distribution measurements in suspension are dynamic light scattering, (DLS), static light scattering (SLS) and photon cross correlation spectroscopy (PCCS)109,112. Analysis of the data from these methods assume that the particles are spherical109,112, which may not always be the case; e.g. goethite nanoparticles (Figure 10 a, Paper I). Below, each method is described in more detail.
SLS, also known as laser diffraction, was used in Paper V. In SLS, particle size is determined from the diffraction pattern that is obtained when the particles are illuminated by a laser109. Models derived from Mie scattering theory are used to calculate particle size109. These models cannot account for multiple scattering, i.e. light scattered more than once, and SLS can therefore not be used for opaque samples109.
DLS was used in Paper V and PCCS was used in Paper I-III and V. DLS and PCCS measure the hydrodynamic diameter, sometimes referred to as Stokes diameter44,109,113. This is not equal to the diameter of particles in the suspension, but is the diameter of a sphere that has the same diffusion rate as
the measured particle109. That is, for particles in suspension, both the particle agglomerates as well as the molecules and ions associated to the surface (Figure 8)109. More details of these methods are in the section Hydrodynamic diameter and photon cross correlation spectroscopy.
The specific surface area is a reactivity measure of the number of surface sites and hence the number of surface-bound molecules27,42–44,48,54. A characterization is usually done with isothermal adsorption of N2 at
cryogenic temperatures, using the Brunauer–Emmett–Teller theory114. This theory was used to calculate the specific surface area of particles in Paper V.
Zeta potential is a measure on the surface charge, or, more correctly, the potential between the dispersion medium and the loosely bound ions surrounding the particle (Figure 8)115. The zeta potential is strongly dependent on pH since it affects the ions surrounding the particle115. A plot of the zeta potential as a function of pH gives the isoelectric point (IEP), i.e. the pH where the zeta potential is 0 115. At this point, the suspension is unstable115. Zeta potential and isoelectric point can be measured with electrophoretic light scattering, i.e. measurements of the velocity of particles in a suspension with an employed electric field115.
It is important to determine the chemical composition of nanomaterials, especially since contaminants can introduce false positives in toxicity tests41,56. The chemical composition can be measured by elemental analysis methods such as EDS and EELS29,104, which often are used in combination with TEM, or combustion elemental analysis, where the organic samples are
combusted completely and quantitative analysis is made of the combustion products116. Combustion elemental analysis was employed in Paper IV for purity analysis of graphene oxide. The functional groups in the graphene oxide sample were also analyzed with IR spectroscopy and 13C-nuclear magnetic resonance spectroscopy (NMR)117. 13C-NMR exploits the interaction of 13C nuclei with a static magnetic field and gives information of chemical structure of organic molecules in the sample117.
Hydrodynamic diameter and photon cross correlation
spectroscopy
PCCS is a special implementation of DLS112, which can be used to measure the hydrodynamic diameter, Dh109. Both methods analyze the speckle
patterns that are obtained when light scattered from particles in the measurement volume cause constructive and destructive interferences109. The Brownian motion, i.e. the random movements of small particles, affects the fine structure of the diffraction pattern109. These fluctuations can be analyzed in the time domain by a correlation function (DLS) or cross correlation function (PCCS)109,112. From the decay of these correlation curves it is possible to calculate the translational diffusion coefficient, Dt. Dt is in
turn related to Dh via the Stokes-Einstein equation:
Dh=3πηDkBTt (4),
where kB is the Boltzmann constant, T is the temperature and η is the
viscosity109. A limitation with DLS is that it cannot account for multiple scattering, i.e. light scattered more than once112. This method is therefore only useful for diluted samples112.
In PCCS, two speckle patterns of the same measurement volume is obtained by using two laser beams112. A schematic picture of the instrumental setup is shown in Figure 9. Contributions from multiple scattering are eliminated by using a crosscorrelation function instead of a
Figure 9 Schematic picture of the PCCS setup. The speckle patterns are detected by separate detectors. The setup also contains two photomultipliers and a correlator.
correlation function112. It is hence possible to measure opaque samples with PCCS, as long as enough light reaches the detector112.
PCCS was used to characterize nanoparticles in Paper I-III and V. Titanium dioxide nanoparticles as well as polystyrene nanoparticles are spherical and, hence, the Stokes-Einstein equation is valid. For the rod-shapes goethite nanoparticles, on the other hand, the hydrodynamic diameters do probably not reflect the true size of the particle agglomerates.
Particles
Table 1. Physicochemical properties of particles studied in Paper I. Particle Surface area
(m2 g-1) Primary particle size (nm) Hydrodynamic diameter (nm) Isoelectric point Goethite 100 8.1 × 31.8 a 11 × 62 b 110, 2200 (28, 290) c 9.4 Titanium dioxide 50 Diameter: 21 a,20-80 b 110, 1800 (18, 190) c 6.3 Polystyrene 300 nm 328.3 c Polystyrene 500 nm 525.2 c Graphene oxide Lateral dimensions: 200 – 3000 d Thickness: 0.9 e
a Measured with XRD. b Measured with TEM. c Measured with PCCS. Most abundant mode in bold. Diameter after sonication with a ultrasonication probe in parentheses. d Measured with SEM. e Measured with AFM.
Iron oxides
Iron oxides are naturally occurring everywhere around us, in the soil and the atmosphere, and they are also manufactured for use as color pigments and in biomedical applications48,118. Large amounts are emitted from brake linings, combustion processes and traffic, which makes iron oxides one of the most common nanoparticles in urban air119. Iron oxide exists in several phases, such as goethite (α-FeOOH), magnetite (Fe3O4), hematite (α-Fe2O3) and
maghemite (γ-Fe2O3) 118
Goethite nanoparticles in a mixture with titanium dioxide nanoparticles were studied in Paper I. Goethite nanoparticles are rod-shaped (see Figure 10 b and Figure 11 c) and are naturally occurring in the environment118. It is one of the major products in many mineral transformations due to its thermodynamic stability118 and its reactivity makes them useful for catalysis applications120. The goethite nanoparticles in Paper I were synthesized in a synthesis process where iron nitrate was mixed with potassium hydroxide120,121. Some physicochemical characteristics120 are in Table 1.
Figure 10. TEM image of a) goethite nanoparticles b) titanium dioxide nanoparticles, ca 80:20 antase:rutile.
Figure 11. Crystal structures of a) anatase (titanium dioxide), b) rutile (titanium dioxide), c) goethite.
Titanium dioxide
Titanium dioxide is manufactured in large quantities (several millions of tons122) and is mainly used as a color pigment in products, such as paints, papers, cosmetics and toothpastes48,123. Two of the most common forms of titanium dioxide are anatase and rutile123. The latter has higher refractive index and lower light absorption, which make it the most used form for use as color pigment123. The anatase form, which is regarded as more reactive than the chemically inert rutile form58,122, is used in more specialized applications, such as photocatalysis and renewable energy applications58,123.
For many years, titanium dioxide has been regarded as a low-toxic particle and it has been used as a negative control in many particle toxicity studies122. It is, however, recognized that small titanium dioxide particles have other physicochemical properties, such as larger specific surface area, than larger titanium dioxide particles122. In recent years, nano-sized titanium dioxide has been subject to a numerous nanotoxicology studies122. A majority of them concludes that the anatase form is cytotoxic and/or genotoxic122.
Commercially available titanium dioxide nanoparticles were studied in Paper I, III and V. In Paper V, several forms of titanium dioxide were studied, but only a mixture of ca 80 % anatase and 20 % rutile (sometimes referred to as P25, which is its commercial name) was subject to the MVDA which is covered in this thesis. The titanium dioxide particles used in Paper I were also studied in mixture with goethite nanoparticles.
Figure 10b shows a TEM image of titanium dioxide and some physicochemical properties58 are in Table 1. The crystal structure of anatase and rutile is depicted in Figure 11 a and b.
Polystyrene
Polystyrene particles are spherical particles made from polymerized styrene124. It is possible to manufacture them in well-defined and uniform diameters and they are therefore commonly used as size standards124.
The purpose in Paper II was to compare super-resolution algorithms applied to Raman images and it was therefore necessary to measure a sample with a known pattern. A sample of commercially available polystyrene submicron particles with a known and uniform diameter was prepared for this purpose. In addition, cells were exposed to slightly lager submicron polystyrene particles and mapped with confocal Raman spectroscopy. Some physicochemical properties of these particles are in Table 1.
Graphene oxide
Graphene consists of one atom-thick graphite layers125. This virtual two-dimensional material has special properties, such as excellent electric conductivity, which makes it a promising material in many technical applications, such as microprocessors, batteries and sensors125. Graphene oxide is the oxidized form of graphene. In contrast to graphene, graphene oxide is water soluble. Graphene oxide is usually synthesized from graphite in a synthesis where sodium nitrate, sulfuric acid and potassium permanganate are mixed126. Graphene oxide has been evaluated in a number of nanotoxicity tests and a majority suggests that the chemical pure material is biocompatible103, but there are also reports on cytotoxicity of graphene oxide contaminated with manganese56.
In Paper IV, graphene oxide nanoparticles were prepared by reduction of graphene, instead of graphite. This process requires comparatively small amounts of sulfuric acid and potassium permanganate. Combustion elemental analysis showed that the graphene oxide was pure after purification with dialysis. Some physicochemical properties are in Table 1.
Cells and exposure conditions
In vitro assays are important complements to in vivo studies of ethical and practical reasons29,127. Translation of in vitro studies to in vivo studies or, even more important, real exposure to human, is, however, difficult42,53,127. It is also difficult to translate doses for in vitro studies to doses for in vivo studies128. Efforts have been made by comparing the surface area of the proximal alveolar region, where particle are likely to deposit after inhalation, to the surface area of a culture dish128. It is also suggested that the surface area of particles is a better dose metric than mass43,48,54,128. An advantage of using surface area, rather than mass, is that both number and volume is possible to derive from the surface area and also that it is not influenced by the density43,54. Calculation of surface area is, however, not straightforward and mass is still the most common dose metric122. Other dose metrics are number per volume43, surface area per volume42,48,54, surface area per number of cells42 or surface area per surface area of culture dish42. In Paper I-V, doses are expressed in mass per volume. A typical particle dose employed in the Raman experiments in Paper I-V is 10 µg ml-1. This corresponds to the lowest, or one of the lowest, doses which are commonly used in toxicity tests122.
The results from toxicity tests can differ dependent on cell type used in the study43,129. Differentiated cells seems to be more sensitive than stem cells43 and differences have also been observed between primary cells and
cell lines42,43. The main entry route for nanoparticles is inhalation51 and it is therefore relevant to use lung models when studying nanotoxicity in vitro. The lung epithelial cell line A549 was used in all Raman spectroscopy studies in Paper I-V. This is an adherent cell that was considered robust and suitable for the Raman experiments.
All Raman measurements were performed on CaF2 substrates, which only
have one Raman band that not interfere with Raman signals from cells or nanoparticles studied in Paper I-V. In addition, CaF2 is non-toxic and
transparent75. Cells were measured without fixation and without sectioning or staining. Before and after measurements, it was studied if the cells had signs of blebs or if they were about to detach, i.e. signs of possible photodamage96. Normally, the cells were unaffected after about 1 h measurement with 514 nm excitation laser (10-13 mW on the sample).
In vitro assays
Numerous in vitro tests are available for toxicity testing. Roughly, they can be divided into viability tests, which test proliferation, necrosis or apoptosis, and mechanistic tests, which test DNA damage or oxidative stress29. It is also important to evaluate the ability of nanoparticles to induce inflammation42. It is not possible to measure inflammation directly in vitro since the inflammation is complex and involves several cell types42. It is however possible to perform in vitro measurements of markers for gene expression or proinflammatory signaling which are involved in the inflammation. Examples of markers are cytokines and chemokines such as interleukins and monocyte chemoattractant protein-1 (MCP-1), which can be measured in vitro by using enzyme linked immunosorbent assay (ELISA)42. Interleukins and chemokines were analyzed by ELISA in Paper V.
Several popular viability tests use dyes, for example tetrazolium salts, which are reduced to formazan dyes by cells with normal metabolic activity29,42. A measure of the metabolic activity, and hence the viability, is obtained by measuring the absorbance29,42,47. Cell viability was tested with the nitroblue tetrazolium assay in Paper V. In Paper IV, cell viability was tested by exposing cells to resazurin, which is reduced to the fluorescent dye resorufin by viable cells29. Cell viability is measured by fluorescence measurements29. There are also assays where stained cultures are manually counted to give a direct measure on the number of viable cells42,47.
Oxidative stress, induced by ROS, is one important mechanism behind nanotoxicity26,43,48,51. Examples of ROS are free radicals that contain oxygen atoms and electrophilic molecules such as hydrogen peroxide42. The ability of particles to induce ROS can be measured in cell-free assays as well as assays for cellular ROS by using fluorescent dyes or electroparamagnetic resonance with probes for ROS42.