FACTORS IN DIFFERENTIAL SAFETY PERFORMANCE ACROSS
DIFFERENT INCOME LEVELS
Luana Ozelim
University of Alabama, Department of Civil, Construction, and Environmental Engineering 1105b Bevill Building, Tuscaloosa, AL, United States of America
Phone: +1 (205) 348-9925 E-mail: ldozelim@eng.ua.edu
Samwel Zephaniah, University of Alabama, Department of Civil, Construction, and Environmental Engineering; Emmanuel Kofi Adanu, University of Alabama, Department of Civil, Construction, and Environmental Engineering; Randy Smith, University of Alabama, Department of Computer Science; Steven Jones, University of Alabama, Department of Civil, Construction, and Environmental Engineering.
ABSTRACT
Roadway safety has been explored numerous times as an effort to identify problems and implement countermeasures to improve conditions. A clear understanding of the causes of crashes is not yet available; therefore, factors that may be related to crash occurrence are analyzed. Prior studies most often focus on the physical design characteristics of the transportation infrastructure, vehicle characteristics and exposure as factors influencing crash frequency and severity. Socio-demographic characteristics are considered in a few studies, but they are typically limited to gender, age, and race or ethnicity. This study builds upon previous studies and explores factors related to vehicle characteristics, physical infrastructure, and environmental conditions all in a socio-demographic and cultural context, as explanatory factors for differential crash frequency and severity across regions. Data from 2009 to 2013 for each county in Alabama are evaluated in this analysis. Three groups of study are identified based on income level: low, medium, and high income levels, and analyzed in relation to crash rates and fatality rates. Results of the analysis show that the low income group has lower crash rates than the higher income group, but the low income group has higher fatality rates than the higher income group. This study applies charts and GIS maps to evaluate the extent to which characteristics such as age, race, gender, driver license status, employment status, alcohol test results, speed at impact, safety equipment, lighting conditions, road surface type, environmental contributing circumstances, curvature and grade, primary contributing circumstance, EMS response delay, police arrival delay, health insurance coverage, and educational level might explain the differential safety performance between income levels. This study is a description of safety in Alabama counties and provides information to create research questions related to the topic; the authors understand that the results are not developed at the level to implement policies and data should be further analyzed in the future through statistical methods.
2(28)
1. INTRODUCTION
Deaths and injuries attributable to roadway crashes are a major global health concern. More than 1.2 million lives are lost every year as a result of crashes worldwide. Road crashes are predicted to become the fifth leading cause of death globally (resulting in some 2.4 million fatalities annually) if no action is taken (WHO, 2015). To begin addressing the problem, the United Nations General Assembly adopted a resolution in 2010 that established the (2011 – 2020) Decade of Action for Road Safety (WHO, 2011) and the resulting Global Plan of Action with a goal to reduce road traffic fatalities around the world. The Decade provides a timeframe for political and resource commitments to integrate road safety into their policies (UN, 2011). The Global Status Report from the World Health Organization (WHO, 2015) states how international attention to the urgency of road safety has increased recently. In addition to the Decade of Action, a resolution was adopted by the General Assembly of the United Nations in 2015 to promote sustainable development in the world. One of the goals of the 2030 Agenda for Sustainable Development is to reduce road traffic fatalities and injuries by 50% by 2020. (UN, 2015[2]).
In 2015, the Second Global High-Level Conference on Road Safety was held in Brasilia, Brazil. The conference adopted the Brasilia Declaration, which welcomed the inclusion of the targets set by the 2030 Agenda for Sustainable Development of halving the number of global deaths and injuries from road traffic accidents by 2020 and of ”providing access to safe, affordable, accessible and sustainable transport systems for all, improving road safety, notably by expanding public transport, with special attention to the needs of those in vulnerable situations, women, children, persons with disabilities, and older persons”. The Brasilia Declaration also provided recommended actions for strengthening road safety management and improving legislation and enforcement, to promote safer roads and the use sustainable modes of transportation, to protect vulnerable road users, to develop and promote the use of safer vehicles, to increase awareness and build capacity of road users, to improve post-crash response and rehabilitation services, and to strengthen cooperation and coordination towards global road safety (UN, 2015).
The African Region has the highest road traffic fatality rates in the world, 26.6 fatalities per 100,000 population, while the lowest rates are in the European Region, 9.3 fatalities per 100,000 population. The Eastern Mediterranean Region is the only region where high-income countries have a higher fatality rate than low and middle income countries. (WHO, 2015).
In the United States, some 5.8 million police-reported motor vehicle crashes occurred in the United States in 2013, resulting in 2.31 million injuries and 32,719 fatalities (NHTSA, 2015). The fact of the matter is that most roadway crashes and subsequent deaths and injuries are both predictable and preventable. Observational studies are typically applied to traffic safety as an attempt to explain possible factors that influence crash frequency and severity. Prior studies typically focus on traffic volume, physical design of roadway facilities, weather, and policies such as speed limit enforcement and seat belt use laws. Socio-demographic characteristics are considered in a few traffic safety studies, but are usually limited to age, gender, and race. As an effort to improve safety, recent studies have included socio-demographic and culture factors as keys to reduce crash frequency and severity.
Many previous research and programmatic efforts have attempted to identify and target underlying causes with the intent of developing countermeasures to prevent and/or reduce the severity of crashes. Some key early work (e.g., Treat et al, 1979) suggested that these underlying causes contributing to crashes were attributable to three categories of contributing factors and combinations thereof as shown in Figure 1.
Figure 1 – Categories of Factors Contributing to Roadway Crashes (Adapted from Treat et al., 1979)
As Figure 1 indicates, an overwhelming majority (93%) of crashes are attributable to driver-related factors. Often, traffic safety science focuses on driver-related factors such as specific behaviors (speeding, impaired driving, distracted driving, etc.) that immediately and directly contribute to crash occurrence.
Several safety programs have been implemented in recent years with a goal of eliminating deaths attributable to crashes. Programs such as Sweden’s Vision Zero, the Sustainable Safety approach developed in the Netherlands (OECD, 2008), and the U.S. Towards Zero Deaths program (TZD, 2014) have catalyzed international efforts to reduce road fatalities to zero. These programs are attempts to challenge the conventional, roadway/vehicle-oriented approach to road safety by more explicitly addressing the role of human factors in the occurrence of fatal crashes.
These programs recognize the human factors that contribute to crashes (fatal and otherwise) extend beyond simply driving behavior and ultimately include underlying socioeconomic factors that affect a) overall safety culture, b) vehicle characteristics and conditions, c) level of roadway infrastructure, and, even, d) access to emergency response/medical care. All of the factors listed above vary across geography, leading to regional disparities in traffic safety and related health outcomes (Clark and Cushing, 2004; Traynor, 2008; Rakauskas et al, 2009).
The objective of the current study is to conduct an initial, descriptive analysis of key socioeconomic factors (i.e., some of the 93% in Figure 1) as they relate to traffic safety in Alabama. The study specifically focuses on income as key socioeconomic factors and examines its relationship along with other characteristics on crashes and severities across the State. The purpose of the study is to identify initial trend and relationships that will form the basis for research questions in future confirmatory, quantitative analyses. It is hoped that documenting the process of the descriptive study and how it is used to inform more rigorous future analysis will be of use to researchers performing similar studies in other locations.
4(28)
2. BACKGROUND
A brief review of relevant literature is presented in the following sections. The review focused on establishing the role that safety culture plays in the occurrence and severity of roadway crashes and how it relates to various socioeconomic factors, particularly income. A brief summary of the traffic safety situation in Alabama is also presented to provide additional context.
2.1.
Traffic Safety Culture and Socioeconomics
There has been an increasing emphasis on the idea of “safety “culture” (e.g., Guldenmund, 2000; Choudhry et al, 2007; Haukelid, 2008; Edwards et al, 2013) within the traffic safety community (e.g., Zaidel, 1992; Girasek, 2001) and is rooted in the fundamentals of organizational safety culture (e.g., Hopkins, 2006; Brinkman, 2007). Traffic safety culture, then, has been defined as related to the value and priority specific social groups give to safety through policies, actions, accepted behavior, and actions towards individuals that violate safety-related norms. The American Automobile Association (AAA) put forth the need to understand and develop positive traffic safety culture as a major research and programmatic initiative (AAA, 2007). Since, emphasis on culture has been a focus of major efforts to understand and improve traffic safety (e.g., Factor et al, 20007; Factor et al, 2008; Albrecht, 2013; Edwards et al, 2014; AAA, 2015)
To the extent that different socioeconomic and demographic characteristics influence cultures, several researchers have explicitly addressed how traffic safety varies across cultural differences. For example, Lund and Rundmo (2009) performed a comprehensive comparison of traffic safety across Norwegian and Ghanaian cultures to determine the transferability of behavioral-related traffic safety countermeasures. Nordfjaern et al (2014) studied differences in traffic safety culture across Norway, Russia, India, Ghana, Tanzania, Uganda, Turkey and Iran.
Linkages among traffic safety culture, related health outcomes, and socioeconomic characteristics are well established. In particular, however, a specific focus on the relationship of economic standing (typically measured as income) has been well documented (e.g., Cubbin and Smith, 2002; Lindqvist et al, 2003; Bishai at al, 2006; Harper et al, 2015), Some studies in the literature show that total crashes are directly proportional to income (Aguero-Valverde, 2013); however, involvement in severe crashes is often inversely proportional to income (Noland and Quddus, 2004; Aguero-Valverde and Jovanis, 2006; Huang et al., 2010). The impact of income on traffic safety outcomes relates safety culture (i.e., behaviors, attitudes, etc.) to geographically variable parameters such as education/employment levels and, ultimately, roadway and infrastructure conditions, trip making characteristics, and access to emergency medical services (EMS).
2.2.
Traffic Safety in Alabama
Alabama has a population of some 4.5 million people and one of the highest per capita rates of vehicle miles traveled (VMT) at more than 14,000 vehicle travelled annually per person. There were some 5 million registered vehicles and just under 4 million registered drivers in the State as of 2013. In 2013 (the latest year of officially reported data), there were 757 fatal crashes resulting in 852 deaths. There were 44 traffic-related injuries for each traffic death. The majority (75%) of crashes occurred in urban areas while most fatalities (55%) happened in rural areas. (ALDOT, 2013).
Traffic safety performance measures in Alabama need to be investigated, as fatality rates are higher than the national averages. The fatality rate per 100 MVMT in Alabama is 1.26 while the national average is 1.09. The fatality rate per 100,000 population is 16.9 compared to the national average of 10.2. (NHTSA, 2014). The USDOT Transportation and Health Tool indicated that Alabama ranked roughly 42 among 50 states in terms of traffic safety outcomes - Alabama has a score of 44/50 in road traffic
fatalities per 100,000 residents; 43/50 in road traffic fatalities exposure rate; and 42/50 in terms of DUI fatalities per 100,000 residents, etc. (USDOT, 2015).
Alabama is in the process of updating its Strategic Highway Safety Plan (SHSP). The most recent edition of the plan, from 2012, explicitly noted the importance addressing the safety culture in the State in order to improve traffic safety, through changing the attitudes and focus of transportation professionals, managers of transportation organizations, governmental leaders, and general public. (State of Alabama, 2012). This study is intended to contribute to the development of the next Alabama SHSP.
3. METHODOLOGY
3.1.
Data Description
The current study used crash data from 2009 to 2013 for all the 67 Alabama counties. Data were obtained from the Critical Analysis Reporting Environment (CARE), developed by the Center for Advanced Public Safety (CAPS) at the University of Alabama. CARE is a data analysis software package containing crash information for the state of Alabama, and it was mostly designed for road traffic problem identification and countermeasure development. (CAPS, 2015). The data for this study included information for 637,477 crashes. The data indicate that approximately 80 percent of crashes in Alabama occur within 25 miles of driver residence. This result was consistent with evidence presented in the literature showing that most crashes, particularly rural crashes, occurred within the same (or similar) region as to that of the driver residence (e.g., Blatt and Furmann, 1998; Donaldson et al, 2008). As such, it was deemed reasonable to assume that county-level findings and characterizations are largely representative of regional and sub-regional phenomena. In addition, socioeconomic data from the U.S. Census were obtained for each county in Alabama. Both the 2010 Census (U.S. Census Bureau, 2010) and the 2009-2013 American Community Survey from Census (U.S. Census Bureau, 2013) were used in this study.
Alabama counties were divided in three income level groups for analysis as shown in Table 1. The distribution of income data was not normal and outliers could be a problem if mean and standard deviation were applied to define income level groups. Therefore, the median value of income ($49,431) and the median absolute deviation ($4,785) were used to develop income level categories for classifying counties.
Table 1 – Income Groups in Alabama
Income level Range
Low $34,847 to $44,646 Middle $44,647 to $54,216 High $54,217 to $88,027
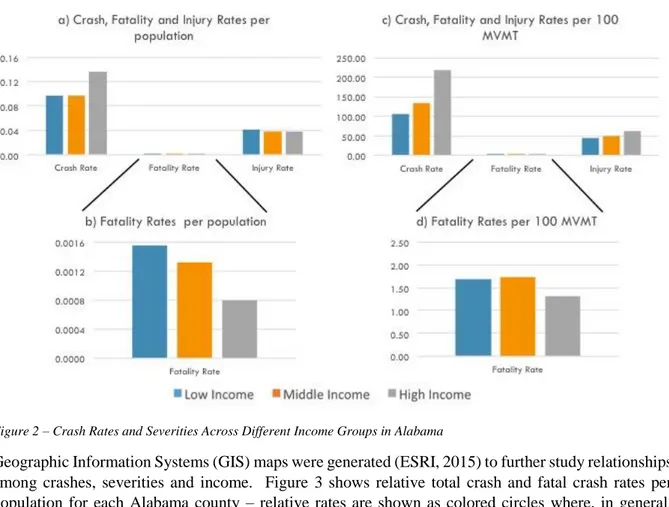
Figures 2a-2d summarize an initial examination of crashes and severities among the three income groups used set out in Table 1. Total injury and fatal crash are shown for each income level for two exposure rates – population and mobility expressed as 100 Million Vehicle Miles Traveled (MVMT). The figure indicates that higher income groups experience higher overall crash rates (regardless of exposure measure) as expected since higher incomes typically connote higher mobility levels. More interestingly, however, Figure 2 indicates that lower incomes are associated with higher crash severities. Figure 1d shows low and middle incomes experience similar fatal crash rates when mobility
6(28)
Figure 2 – Crash Rates and Severities Across Different Income Groups in Alabama
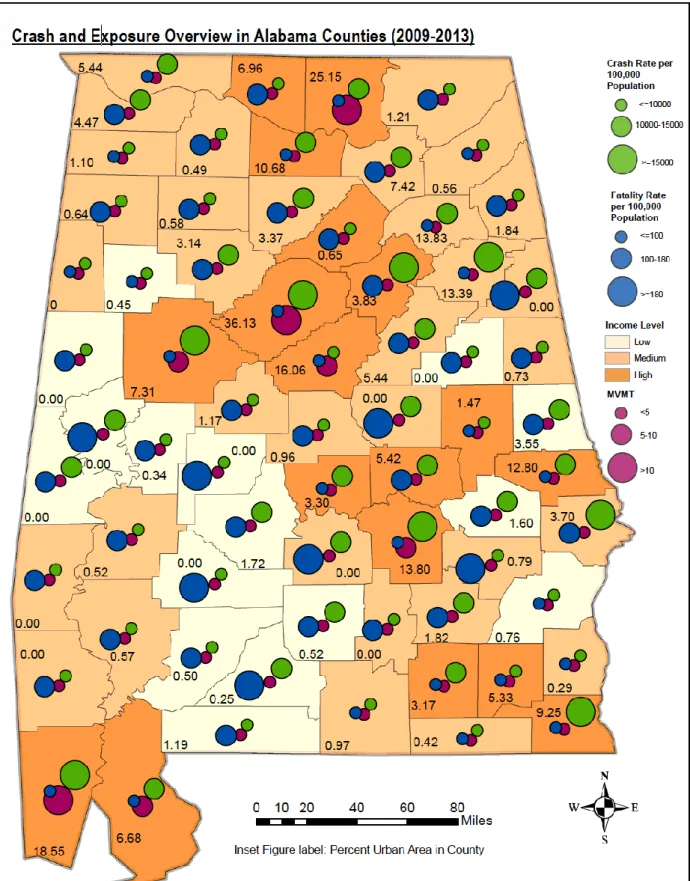
Geographic Information Systems (GIS) maps were generated (ESRI, 2015) to further study relationships among crashes, severities and income. Figure 3 shows relative total crash and fatal crash rates per population for each Alabama county – relative rates are shown as colored circles where, in general, larger circle connotes larger rates. The relative scales for the rate circles were selected to show based on the data to best illustrate the overall trends observed in the crash data when viewed across income groups (and geography). Also, the total number of crashes (fatal crashes) in each county is presented as a number on in each county on both maps. And finally, each county is color-coded to indicate to which income level category it belongs.
At first glance, Figure 3 confirms the conclusions drawn from Figures 2a and 2b. Further inspection, however, reveals interesting geographic trends. For example, the low income counties in the southwest portion of the State exhibit relatively high fatal crash rates compared to their total crash rates. Two of these low income counties contain interstate highways which may contribute to increased fatalities due to higher posted speed limits (typically 70 mph or 120 kph). The remaining low income counties are some of the poorest in the State (indeed, the entire U.S.) and are apparently overrepresented in terms of fatal crash rates. Interestingly, no high income counties exhibit relatively high fatal crash rates (i.e., none have large circles). Whereas middle income counties show a full range of fatal crash rates with three exhibiting the highest level. One of these contains an interstate highway, another (the northerly) most contains a major non-interstate highway, and the third is a very rural county as shown in Figure 4 in which total and fatal crash rates by population are shown for each county along with VMT and the percentage of each county that is classified as urbanized.
Figure 3 – Total Crash Rates and Fatality Rates by County across Alabama
8(28)
The county-level income maps of other related socioeconomic characteristics from crash records and census data form the basis of several descriptive analyses intended to explore initial relationships among socioeconomic factors affecting crashes and severities. These analyses and preliminary results will guide future in depth analyses.
4. DESCRIPTIVE ANALYSES
The literature review confirmed the relationship between income and traffic safety. Initial correlations analyses were performed to identify basic relationships among crash rates and 30 crash variables across the 67 counties. Pearson correlation coefficients were determined for fatal crash rates per 100,000 population. The results confirmed that income was indeed negatively correlated (-0.56, p < 0.0001) to fatal crash rates – in other words, higher fatality rates are associated with lower incomes. Other interesting correlations that were shown to be significant included: speeding (0.28, p = 0.0255); brake failure or tire blowout (0.3140, p = 0.0097); and police and EMS arrival delays (0.53, p < 0.0001). Portions of the correlation results were used to guide the initial descriptive analyses presented in the following sections.
4.1.
Socioeconomic and Vehicle Characteristics
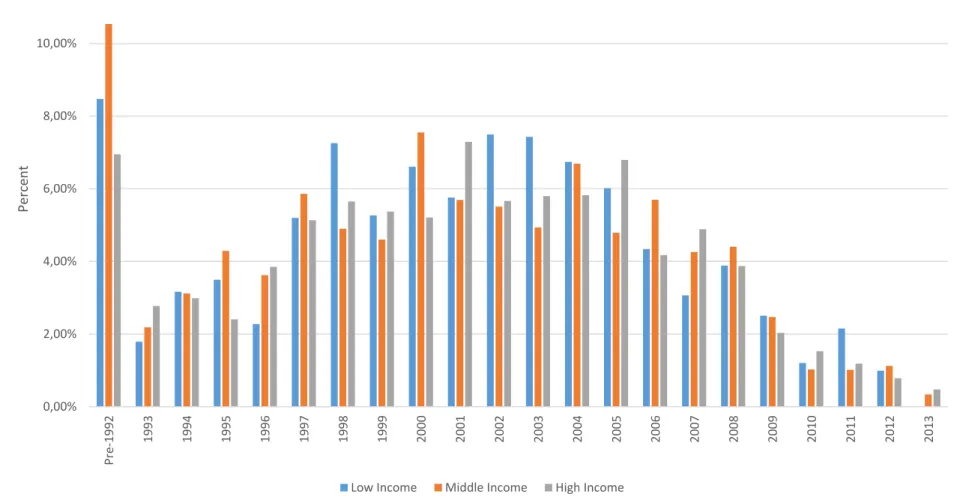
More than 50% of total crashes were caused by passenger cars and this portion was consistent across income groups. Figure 5 shows the distribution of total crashes, by income group, according to vehicle model year. In general, older vehicles are associated with lower income groups as expected. In particular, higher percentage of crashes involving pre-19921 vehicles occurred among low and middle
income groups. Further analysis of the crash data confirmed that an airbag was not present in almost 10% of crashes in both low and middle income counties, while less than 5% of crashes in high income counties involved vehicles without airbags.
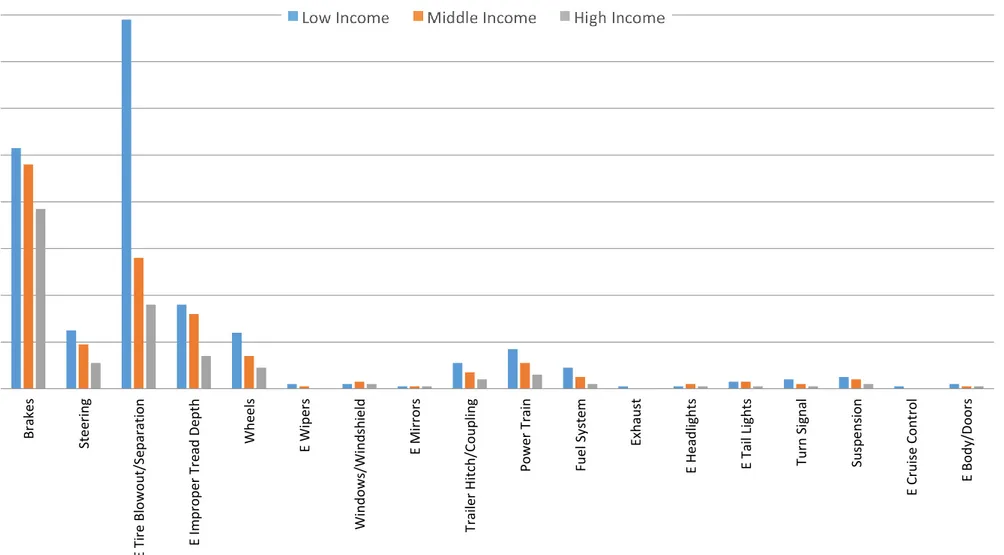
Figure 6 shows the range of vehicle defects reported as contributing to crashes across income groups. Three vehicle defects associated with basic maintenance (brakes, tire blowout/separation, and tread depth) are clearly overrepresented among low income groups. Clearly such vehicle defects can lead to catastrophic crashes. Figure 6 shows the relationship among vehicle defect-attributable crashes and county level income across the State – where larger purple circles indicate higher percentage of these types of crashes.
Additionally, the relative level of education attainment is shown in Figure 7 to elucidate any underlying relationships implying wherewithal/awareness of vehicle maintenance – the larger the green circle, the higher the percent of the county population with at least a college degree. In general, it can be observed that counties with lower education levels (small green circles) generally exhibit higher percentages of crashes attributable to vehicle defect (large green circles) across income levels.
In addition to each county being color-coded according to income level, “hatching” has been added to each to reflect the calculated fatality risk for each. The fatality risk is intended to be qualitative indicators to allow sub-regional comparisons across income levels. It was determined using Kernel Interpolation within the Geostatistical analyst tool in ArcGIS. The county level fatality risk is estimated using fatal crash rates per population as the dependent variable and straight line distances between points (i.e., fatal crashes and county boundaries) as independent variables.
1The 1991 Intermodal Surface Transportation Efficiency Act mandated that all future vehicles sold in the U.S. be
10(28)
Figure 5 – Distribution of Crash Vehicles by Model Across Income Groups
0,00% 2,00% 4,00% 6,00% 8,00% 10,00% 12,00% Pre -1992 1993 1994 1995 1996 1997 1998 1999 2000 2001 2002 2003 2004 2005 2006 2007 2008 2009 2010 2011 2012 2013 Perc en t
Figure 6 – Relative Percentage of Vehicle Defects Contributing to Crashes Among Income Groups Brak e s Ste erin g E Ti re Blo w o u t/S ep ar at ion E I m p ro p er Tre ad Dep th Wh ee ls E W ip ers Win d o w s/Win d sh ie ld E M irror s Tra ile r H itch /C o u p lin g Po w er Tra in Fu e l Sy stem Exh au st E H e ad lig h ts E Tail L ig h ts Tu rn Si gn al Su sp e n sion E Cru is e Co n tro l E Bo d y/ Doo rs
12(28)
4.2.
Socioeconomic and Roadway/Environment Characteristics
In addition to affecting vehicle condition, the relationships among socioeconomic characteristics and roadway/environment conditions contributing to crashes and severities were examined. For example, general analyses revealed the following key observations:
A higher percentage of total crashes occurred on two-lane road in lower income counties than the others and more crashes in lower income counties occurred in horizontal and vertical curves. Lower income counties also recorded a much higher percentage of crashes occurring where
existing traffic control was no functioning properly.
Some 20% of crashes in low income counties occurred on roadways with no lighting present as opposed to 10% in high income counties.
Lower income counties exhibited more than 2% of total crashes on unpaved roads – twice that of middle income counties and more than three times that of high income counties. There is considerable variation among conditions (terrain, level of urbanization, etc.) among counties regardless of income. As stated previously, some counties classified as other than low income may well have a wide dispersion of incomes (and levels of urbanization).
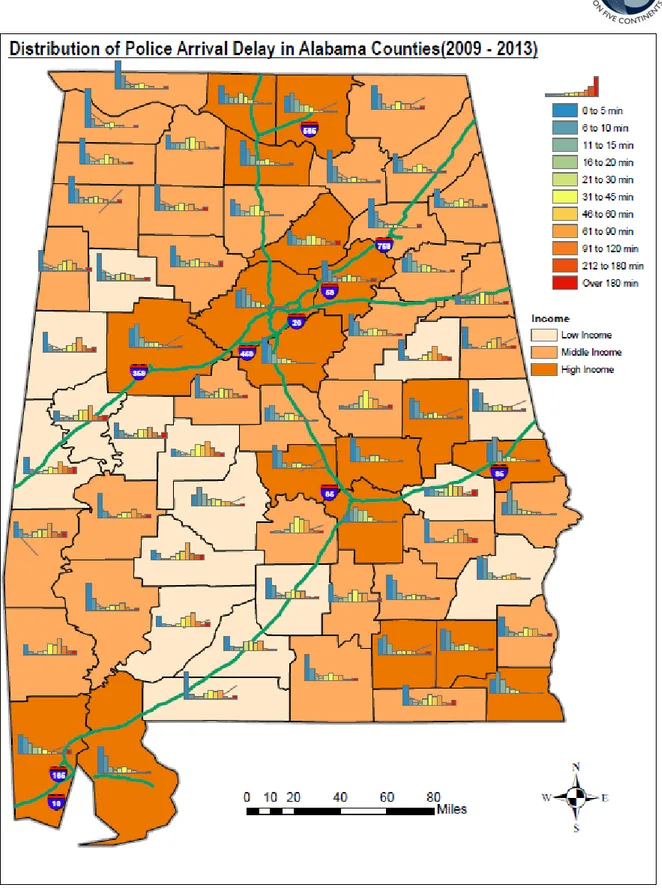
Although not part of the physical roadway environment, the ability of emergency services (e.g., police, ambulances) to reach crash scenes in a timely manner and, ultimately, for crash victims to reach medical care can be viewed as part of the traffic safety infrastructure. As such, the ability of emergency services to respond to crash can also be seen to vary across geography and, as related, income. Figures 8 and 9 show the average arrival times for police and emergency medical service (EMS) across income levels.
Figure 8 – Distribution of Police Response Times Across Income Levels
0 5 10 15 20 25 30 0 to 5 6 to 10 11 to 15 16 to 20 21 to 30 31 to 45 46 to 60 61 to 90 91 to 120 121 to 180 O ve r 180 Perc en t
Arrival Time (Minutes)
Police Arrival Delay
14(28)
Figure 9 – Distribution of EMS Response Times Across Income Levels
Clearly, both police and EMS arrivals times are longer in lower income counties. Both of these response time issues may relate to the health outcomes associated with crashes. In most cases, the lower income counties correlate to lower levels of urbanization.
Figures 10 and 11 shows the distribution of police and EMS delays for each county in Alabama. It can be seen that the higher income counties exhibit arrival time distribution skewed to the left, representing earlier arrivals. Lower income counties, however, typically exhibit irregular distributions with peaks in the middle or skewed to the right, representing late arrival times.
0 1 2 3 4 5 6 7 8 0 to 5 6 to 10 11 to 15 16 to 20 21 to 30 31 to 45 46 to 60 61 to 90 91 to 120 121 to 180 O ve r 180 Pe rce n t
Arrival Time (Minutes)
EMS Arrival Delay
16(28)
Figure 11 –EMS Arrival Delay among Alabama Counties
4.3.
Socioeconomic Characteristics and Safety Culture
Relationships among socioeconomic/demographic factors and traffic safety are complex. Figure 12 shows the relationship among crashes and gender across counties by income level.
18(28)
In general, Figure 12 shows a similar representation among total crashes between men and women in high income counties with higher rates of male involvement in crashes in low and middle income counties. Males, however, are overrepresented among fatal crashes across all income levels. Again, there appears to be a geographic clustering in the southwestern low income counties of male-involved fatal crashes.
In addition to gender, the data allowed exploration of factors that appeared to cluster around other demographic characteristics such as race. For all income groups, younger male drivers caused the majority of crashes. A more detailed examination of crashes involving males showed that many young men were in involved in crashes while driving under the influence (DUI) of alcohol. Figure 13 shows the relationships among crashes caused by young white males (purple circles) and fatal DUI crashes caused by white males (green circles). Figure 13 also shows a “W” or “D” in each county to indicate which are Wet (i.e., allow alcohol sales) and which are Dry (no alcohol sales prohibited). Clearly, there is an overrepresentation of young men involved in DUI crashes in rural parts of the State across income levels in the low and middle income areas of the State. And the relationship between the availability of alcohol and relative DUI crashes appears to vary more with geography (i.e., region al culture) than income levels. Figure 14 shows statewide relationships between registered blood alcohol content (BAC) in DUI related fatal crashes. The figure shows higher percentages of DUI involvement (at higher BAC rates) in fatal crashes among lower income populations.
The issue of DUI crashes is put into perspective with other driver behavior-related crashes (fatigue and distracted driving) in Figure 15. Figure 15 also reports the percentage of overall crashes by county that occurred at speeds over 35 mph. In general, distracted driving crashes appear to be more prevalent among higher income counties than DUI crashes. Figure 16 shows the impacts of a key driving behavior, speeding, across the State in terms of both total and fatal crashes.
Figure 17 shows the relationship among income levels and seat belt usage among African Americans across the State. The green circles represent the relative portion of crashes caused by African American drivers in each county and the pink circles indicate the proportion of these crashes in which a seat belt was in use. Once again, the clustering of correctable safety culture issues is evident in the southwest (especially low income) parts of the State.
The information in Figures 13 through 17 is shown for illustrative purposes and represents some of the known “problem issues” in safety culture in Alabama. It is intended that viewing these issues spatially can help focus targeted educational and enforcement efforts where they are most needed. Examination of other socioeconomic characteristics yields additional insights such as how higher income areas exhibit higher levels of helmet usage reported in motorcycle-related crashes. On the other hand, lower income areas exhibit higher crash rates associated with unlicensed drivers. And Figure 18 indicates that fatal crashes caused by unemployed drivers is spread across countywide income levels.
20(28)
Figure 14 – BAC Test Results in Fatal Crashes among Income Groups 0,00% 2,00% 4,00% 6,00% 8,00% 10,00% 12,00% 14,00% 16,00% .01 to .039 .04 to .079 .08 to .099 .10 to .199 .20 to .249 .25 to .299 .30 to .349 .35 to .399 .40 o r O ve r Perc en t
22(28)
Figure 17 – Seatbelt Usage and Crash Rates among African Americans
24(28)
5. DISCUSSION
The main goal of this initial, descriptive is to provide information for future investigation by creating contextual understanding of how socioeconomic characteristics across various regions of Alabama affect safety performance. While the lack of confirmatory (i.e., quantitative) analyses may initially be viewed as a weakness of the work, it is believed that the overall “big picture” generated by relating traffic safety and income with other socioeconomic characteristics in such a graphical manner provides a richer spatial context for future analyses of specific variables as predictive/descriptive models are developed. Some of the key observations (i.e., questions) raised by the analyses are listed below.
To what extent do risky behaviors such as drink driving cluster regionally among income groups and how does that relate to the availability of alcohol?
Do other risky driving behaviors (speeding, distracted, fatigue) exhibit patterns within certain socioeconomic groups and/or geographical areas?
Is lack of basic preventative vehicle maintenance (and indeed lack of awareness thereof) attributable to a deficient safety culture among certain economic groups?
Do regional and socioeconomic “pockets” exist where certain behavioral aspects of safety culture (e.g., safety restraint usage) are identifiable?
Do issues associated with police and EMS arrival delays disproportionately impact certain socioeconomic groups?
Going forward, additional combinations of variables can be “mapped” to create new research questions. All of the questions can then be followed by one overarching question – what specific countermeasures (e.g., education or enforcement campaigns, early outreach interventions) can be employed to target the underlying relationships where they will be most effective?
It is worth noting that the current study considered crash rates by population to compare safety performance across counties with a wide range of total populations. It is understood that this approach may lead to issues resulting from emphasizing relatively high crash rates among small populations. Appropriate techniques should be applied during quantitative analyses to correct for any bias such rate instability might introduce.
6. CONCLUSIONS AND RECOMMENDATIONS
It is known that more than 90 percent of crashes are caused by human factors many of which are reflected in underlying socioeconomic characteristics. To identify priority areas and countermeasures to be applied, it is necessary to recognize which factors influence crash frequency and severity across geography.
This study provided an overview of crash frequency and severity among three different income groups across the 67 counties in Alabama. The results were in line with findings form previous researchers on the underlying relationships among socioeconomic factors and safety outcomes. The analyses presented herein were intended only to be descriptive and largely comprise GIS maps that allow visual inspection of relationship among several parameters, including any spatial clustering that may occur. Ultimately these type of analyses and results will be used to guide more detailed, confirmatory studies on which predictive models and countermeasure evaluations can be based.
7. ACKNOWLEDGEMENTS
26(28)
REFERENCES
Aguero-Valverde. (2013). Multivariate spatial models of excess crash frequency at area level: Case of Costa Rica. Accident Analysis and Prevention, 59(2013), pp. 365-373.
Aguero-Valverde, J. and Jovanis, P. P. (2006). Spatial analysis of fatal and injury crashes in Pennsylvania. Accident Analysis and Prevention, 38(2006), pp. 618-625.
Alabama Department of Transportation (ALDOT). (2013). Alabama Department of Transportation 2013 Crash Facts. Available at <http://drivesafealabama.org/uploads/files/ALDOT-2013CrashFactsBook.pdf>
Albrecht, C., Li, W., Gkritza, K. (2013). Improving Traffic Safety Culture in Iowa – Phase II. InTrans Report No. 11-398. Center for Transportation Research and Education, Iowa State University, Ames, IA.
American Automobile Association (AAA). (2007). Improving Traffic Safety Culture in the United States: The Journey Forward. AAA Foundation for Traffic Safety, Washington, DC.
American Automobile Association (AAA). (2015). 2014 Traffic Safety Culture Index. AAA Foundation for Traffic Safety, Washington, DC.
Bishai, D., Quresh, A., James, P., Ghaffar, A. (2006). National road casualties and economic development. Health Economics, 15, pp. 65-81.
Blatt, J., Furman, S. (1998). Residence location of drivers involved in fatal crashes. Accident Analysis and Prevention, 30(6), pp. 705–711.
Brinkmann, S. (2007). Culture as practices: A pragmatist conception. Journal of Theoretical and Philosophical Psychology, 27, pp. 192–212.
Center for Advanced Public Safety (CAPS). (2015). Critical Analysis Reporting Environment (CARE). Available at <http://care.cs.ua.edu/care.aspx>
Clark, D., Cushing, B. (2004). Rural and urban traffic fatalities, vehicle miles, and population density. Accident Analysis and Prevention, 36(2004), pp. 967-972.
Choudhry, R., Fang, D., Mohamed, S. (2007). The nature of safety culture: A survey of the state of the art. Safety Science, 45, pp. 993–1012.
Cubbin, C., Smith, G. S. (2002). Socioeconomic inequalities in injury: critical issues in design and analysis. Annual Review of Public Health, 23, pp. 349-375.
Donaldson, A., Cook, L., Hutchings, C., Dean, J. (2006). Crossing county lines: The impact of crash location and driver’s residence on motor vehicle crash fatality. Accident Analysis and Prevention, 38(2006), pp. 723-727.
Edwards, J., Davey, J., Armstrong, K. (2013). Returning to the roots of culture: A review and re-conceptualisation of safety culture. Safety Science, 55, pp. 70–80.
Edwards, J., Freeman, J., Soole, D., Watson, B. (2014). A framework for conceptualising traffic safety culture. Transportation Research Part F, 26, pp. 293-302.
Environmental Systems Research Institute (ESRI). (2015). Geographic Information Systems (GIS). Available at < http://www.esri.com/>
Factor, R., Mahalel, D., Yair, G. (2008). Inter-group differences in road-traffic crash involvement. Accident Analysis and Prevention, 40(2008), pp. 2000-2007.
Factor, R., Mahalel, D., Yair, G. (2007). The social accident: A theoretical model and a research agenda for studying the influence of social and cultural characteristics on motor vehicle accidents. Accident Analysis and Prevention, 39(2007), pp. 914-921.
Girasek, D. (2011). Towards operationalising and measuring the traffic safety culture construct. International Journal of Injury Control and Safety Promotion, 19, pp. 37–46.
Guldenmund, F. (2000). The nature of safety culture: A review of theory and research. Safety Science, 34, pp. 215–257.
Haukelid, K. (2008). Theories of (safety) culture revisited – An anthropological approach. Safety Science, 46, pp. 413–426.
Harper, S., Charters, T. J., Strumpf, E. C. (2015). Trends in Socioeconomic Inequalities in Motor Vehicle Accident Deaths in the United States, 1995–2010. American Journal of Epidemiology, Vol. 182, No. 7, pp. 606-614.
Hopkins, A. (2006). Studying organisational cultures and their effects on safety. Safety Science, 44, pp. 875–889.
Huang, H., Abdel-Aty, M. A., Darwiche, A. L. (2010). County-Level Crash Risk Analysis in Florida: Bayesian Spatial Modeling. Transportation Research Record: Journal of the Transportation Research Board, No. 2148, Transportation Research Board of the National Academies, Washington, D.C., pp. 27– 37.
Lindqvist, K., Timpka, T., Karlsson, N. (2003). Impact of social standing on injury prevention in a World Health Organization Safe Community – intervention outcome by household employment contract. International Journal of Epidemiology, 33(3), pp. 605-611.
Lund, I., Rundmo, T. (2009). Cross-cultural comparisons of traffic safety, risk perception, attitudes and behaviour. Safety Science, 47, pp. 547–553.
National Highway Traffic Safety Administration (NHTSA). (2014). Fatality Analysis Reporting System (FARS).
National Highway Traffic Safety Administration (NHTSA). (2015). Traffic Safety Facts 2013, A Compilation of Motor Vehicle Crash Data from the Fatality Analysis Reporting System and the General Estimates System. National Center for Statistics and Analysis. U.S. Department of Transportation, Washington, DC.
Noland, R. B. and Quddus, M. A. (2004). A Spatially Disaggregate Analysis of Road Causalities in England. Accident Analysis and Prevention, 36(2004), pp. 973-984.
Nordfjaern, T., Simsekoglu, O., Rundmo, T. (2014). Culture related to road traffic safety: A comparison of eight countries using two conceptualizations of culture. Accident Analysis and Prevention, 62, pp. 319-328.
Organisation for Economic Co-operation and Development (OECD). (2008). Towards Zero – Ambitious Road Safety Targets and the Safe System Approach. Available at < http://www.internationaltransportforum.org/Pub/pdf/09CDsr/PDF_EN/TowardsZero.pdf>
Rakauskas, M. Ward, N., Gerberich, S. (2009). Identification of differences between rural and urban safety cultures. Accident Analysis and Prevention, 41, pp. 931-937.
State of Alabama. (2012). Strategic Highway Safety Plan, 2nd Edition. Available at <http://www.safehomealabama.gov/Portals/0/PDF/11-SAS-009.FullVersionFINALLowRes.pdf> Toward Zero Deaths (TZD). (2014). Toward Zero Deaths: A National Strategy on Highway Safety. Available at <http://www.towardzerodeaths.org/>
28(28)
Traynor, T. (2008). Regional economic conditions and crash fatality rates – a cross-country analysis. Journal of Safety Research, 39, pp. 33-39.
Treat, J. R., Tumbas, N. S., McDonald, S. T., Shinar, D., Hume, R.D., Mayer, R.E., Stansifer, R. L., Catellan, N. J. (1979). Tri-level Study of the Causes of Traffic Accidents: Final Report, Vol.1: Causal Factor Tabulations and Assessments. Report No. DOT HS-805 085, Indiana University: Institute for Research in Public Safety.
United Nations (UN). (2015). Brasilia Declaration. Available at < http://www.who.int/violence_injury_prevention/road_traffic/Final_Brasilia_declaration_EN.pdf?ua=1 >
United Nations (UN). (2011). Global Plan for the Decade of Action for Road Safety 2011-2010. United Nations (UN). (2015[2]). Resolution Adopted by the General Assembly on 25 September 2015 – Transforming our World: the 2030 Agenda for Sustainable Development. Available at < http://www.un.org/ga/search/view_doc.asp?symbol=A/RES/70/1&Lang=E>
U.S. Census Bureau. (2013). American Community Survey. Available at < https://www.census.gov/programs-surveys/acs/about.html>
U.S. Census Bureau (2010). Census 2010. Available at < http://www.census.gov/2010census/>
U.S. Department of Transportation (U.S. DOT). (2015). Transportation and Health Tool. Available at < https://www.transportation.gov/transportation-health-tool>
World Health Organization (WHO). (2011). Decade of Action for Road Safety: 2011-2020 – Global Launch. Available at < http://www.who.int/roadsafety/publications/global_launch.pdf>
World Health Organization (WHO). (2015). Global Status Report on Road Safety 2015. Available at < http://www.who.int/violence_injury_prevention/road_safety_status/2015/en/>
Zaidel, D. M. (1992). A modeling perspective on the culture of driving. Accident Analysis and Prevention 24 (6), pp. 585–97.