School of Business, Society & Engineering Bachelor Thesis in Economics
Spring 2013
Mälardalens högskola
Repurchases on the Swedish Stock Market
– a good long-term investment?
Tran, H. Nguyen Weigardh, Anton Date: June 5th 2013
Supervisor: Christos Papahristodoulou
Acknowledgements:
We are greatly thankful for the countless hours of guidance and helpful critique received from our supervisor, Professor Christos Papahristodoulou.
2
Abstract
Title: Repurchases on the Swedish Stock Market – a good long-term investment? Date: June 5th 2013
Level: Bachelor Thesis in Economics (NAA303), 15 credits
Authors: Nguyen H. Tran Anton Weigardh
ntn10001@student.mdh.se awh10001@student.mdh.se Mobile: 070-0160303 Mobile: 073-7065166
Tutor: Christos Papahristodoulou, Senior Lecturer, School of Business Society and Engineer-ing.
Keywords: Repurchases, Abnormal returns, Efficient Markets, Dividends
Problem: Repurchases in Sweden have only been allowed since March, 2000. Very little re-search regarding long-term effects on Swedish companies that repurchase their own stock has been performed, especially any concerning an entire business cycle.
Purpose: The purpose of this paper is to investigate the long-term share price effects for Swedish companies that employed repurchases programs during 2000 - 2012.
Method: This paper applies a trading strategy where the investor invests in stocks of compa-nies that engage in repurchase of their own equity. We test buy-and-hold abnormal returns versus two different proxies for the control firm, using small sample t-statistics.
Results and Conclusion: Abnormal returns for one to five years are insignificant under sta-tistic tests, using the supersector indices. In contrast, they are significant using a proxy for the market index as control firm. Factors hypothesized to contribute to this result are incon-clusive using our method of comparison. As a whole, we suggest that investing in companies that repurchase stock is a solid strategy: It is on par or better than index.
3
Sammanfattning
Titel: Återköp på Stockholmsbörsen – en god långsiktig investering? Datum: 5 juni 2013
Nivå: Kandidatuppsats i Nationalekonomi (NAA303), 15 poäng
Författare: Nguyen H. Tran Anton Weigardh
ntn10001@student.mdh.se awh10001@student.mdh.se Mobil: 070-016 03 03 Mobil: 073-706 51 66
Handledare: Christos Papahristodoulou, Universitetslektor/Docent, Akademin för ekonomi och samhällsvetenskap.
Nyckelord: Aktieåterköp, Överavkastning, Effektiva marknader, Aktieutdelningar
Problem: Återköp i Sverige har enbart varit tillåtet sedan mars 2000. En mycket liten mängd forskning rörande den långsiktiga avkastningen för svenska företag som återköper aktier har genomförts, speciellt någon som sträcker sig över en hel konjunkturcykel.
Syfte: Syftet med denna rapport är att undersöka de långsiktiga effekterna på aktiekurserna för svenska företag som köpte tillbaka aktier under perioden 2000 - 2012.
Metod: Denna rapport testar en strategi där en investerare köper aktier i företag som ge-nomför återköpsprogram. Rapporten testar den långsiktiga köp-och-behåll-överavkastningen mot två olika index genom att tillämpa t-test.
Resultat and Slutsats: Ingen signifikant överavkastning för år ett till fem upptäcks i de test då supersektorer används. Å andra sidan återfinns statistiskt säkerställda resultat när ett proxy för marknadsindex används som kontrollenhet. De hypotiserade bidragande orsaker-na för dessa resultat är ej förklarande under använd metod. I sin helhet, så meorsaker-nar vi att in-vesteringar i företag som återköper aktier är en sund strategi. Det är i paritet eller bättre jämfört med index.
4
TABLE OF CONTENTS
1 Introduction ... 6
1.1 Background ... 6
1.2 Problem Statement ... 7
1.3 The Aim of the Thesis ... 8
1.4 Limitations... 8
1.5 Disposition of the Paper ... 8
2 Review of Current Literature ... 9
3 Theory and Findings ... 12
3.1 Why Do Companies Buy Back Their Own Equity? ... 12
3.1.1 The Free Cash Flow Hypothesis – Dividends versus Repurchases ... 12
3.1.2 The Asymmetric Information Hypothesis – Signalling Undervaluation ... 14
3.1.3 Optimal Leverage Ratio Hypothesis – Reaching the Optimal Capital Structure ... 15
3.1.4 Management Incentive Hypothesis – Offsetting Dilution from Stock Options ... 15
3.1.5 Takeover Deterrence Hypothesis – Counter Takeover Attempts ... 16
3.1.6 Other Reasons to Repurchase ... 16
3.2 Efficient Market Hypothesis ... 17
4 Repurchases in Sweden and Abroad ... 18
4.1 The Swedish Legislation System Regarding Repurchase of Own Equity ... 18
4.2 Legislation in Other Countries ... 19
5 Measurement of Abnormal Return ... 21
5.1 CAR – Cumulative Abnormal Returns ... 21
5.2 BHAR – Buy-and-Hold Abnormal Returns ... 21
5.3 CTAR – Calendar Time Abnormal Returns ... 22
5.4 Choice and Critique of Method ... 23
5.5 Period of Investigation ... 25
5.6 Data Selection, Assortment and Limitation ... 25
5.7 Forming our Hypothesis ... 26
5.8 Hypothesis Testing ... 28
5.8.1 t-Test ... 28
5.8.2 Small Sample Hypothesis Tests for Comparison of two Population Means. ... 28
6 Empirical Results ... 29
6.1 Description of Data Set ... 29
5
6.3 The Size Effect on BHAR ... 32
6.4 BHARs Depending on the B/M-value of the Firm ... 33
6.5 Other Notable Results ... 34
6.6 Additional remarks ... 36
7 Conclusion ... 38
8 References ... 39
9 Appendices ... 42
Appendix 1 – List over Repurchasing Companies and Indices 2000-2012 ... 42
Appendix 2 – Amount of Repurchasing Companies per Year ... 43
Appendix 3 – Distribution of Returns, Year 1-3 ... 44
Appendix 4 – Returns for Various Periods ... 45
List of Figures Figure A1 – Amount of repurchasing companies 2000 - 2012 ... 43
Figure A2 – AFGX 2000-2013 ... 43
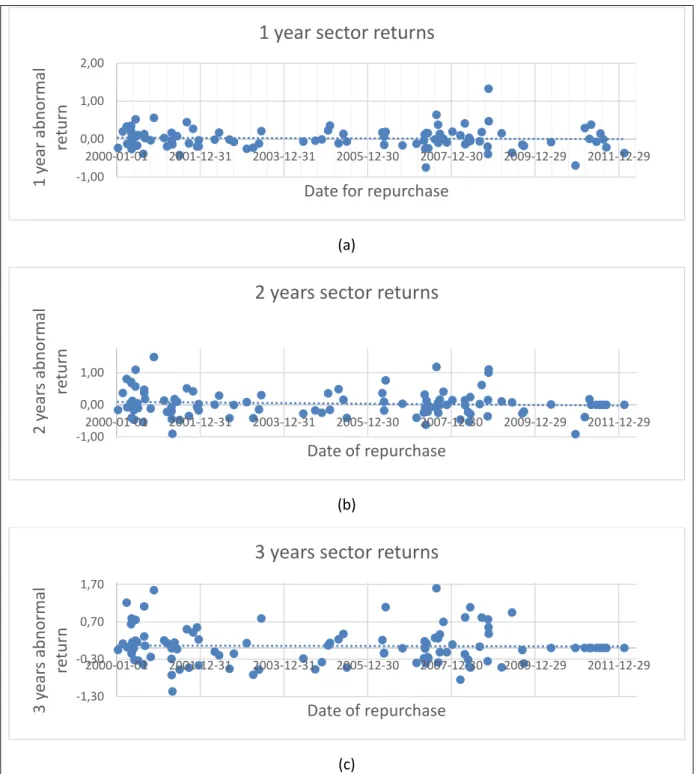
Figure A3 – Distribution of return, year 1-3 ... 44
Figure A4 – BHARs for various periods ... 45
List of Tables Table 1 – Summary of previous research ... 9
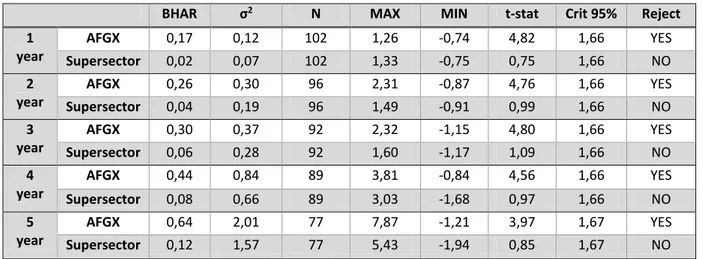
Table 2 – Long-term abnormal returns ... 30
Table 3 – BHARs for groups based on size ... 32
Table 4 – The size effect of small firms ... 32
Table 5 – BHARs depending on B/M ... 33
Table 6 – B/M effect on BHARs ... 33
Table 7 – BHARs for different periods using supersector indices ... 34
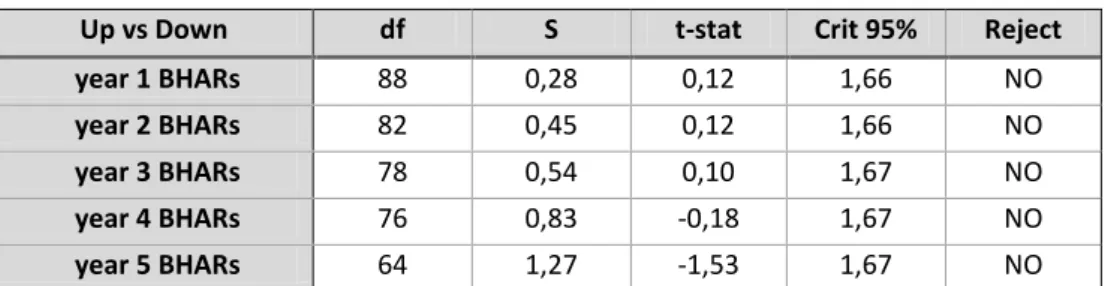
Table 8 – BHARs depending on previous stock movements ... 35
Table 9 – Returns for various industries, year 1-3 ... 36
Table A1 – List over repurchasing companies 2000-2012 ... 42
6
1 INTRODUCTION
1.1 Background
Repurchase of company equity for companies trading on the Stockholm Stock Exchange (SSE) has been allowed since March 10th, 2000. Previously it was very hard and costly for companies that sought to buy back share. However, it did occur. For example, in 1997, Swedish firms repurchased a significant value of € 1.743 million (von Eije & Megginson 2008, p. 356).
Reasons why companies repurchase stock diverge. Repurchases are as dividends a mean to transfer wealth from the company to its shareholders. One typical reason is to signal to the market that the stock is undervalued. Other explanations are to protect the company from hostile takeovers, an ambition to change the capital structure, to reduce agency costs, to offset dilution from exercised warrants or to buy the stock for an investment purpose. There exist several methods on how a company can repurchase stock. The most common is open-market repurchases, when the company acts like an ordinary investor, buying their own shares at the current market price. This method requires no obligation to buy back a fixed number of shares at a certain price. Consequently, it sends the weakest signal to the market of management conviction to their company’s future performance. Another method is tender offer, in which the management offers to buy a predetermined amount of out-standing shares at a fixed price, usually at a significant premium to the present market price. This type of action usually sends a powerful, positive signal to the market that the stock is currently undervalued. Sometimes, companies also use a Dutch auction to repurchase stock. This is a certain type of tender offer with no fixed price. Instead, the shareholders state their reservation prices, then companies can then buy back the (cheapest) stocks. Once common stocks are repurchased, companies can either keep the shares as assets or annul them to decrease the number of outstanding shares.
Dissimilar reasons or methods for companies to repurchase stock may arrive in different re-turns. Researchers often find positive announcement returns in U.S market. Outside of U.S, there is also evidence for positive preliminary returns. Beyond initial returns, academics also find support for long-term gains. Oppositely, some have found negative or minor gains. Certain companies are reported to constitute the larger bulk of the cumulative returns. Small companies are occasionally suggested to be more lucrative. The same also occurs for “value” stocks. Other scholars oppose these findings: discovering either no support or other motives for abnormal returns such as tendering versus non-tendering owners, whether the company actually repurchases stock after intention and the repurchase fraction.
The legislation system regarding repurchases in Sweden is one of the most restrictive in the world. Upon permission from at least two thirds of the shareholder’s votes, a company can
7
own up to 10 % of its own stock and must acquire it during one year. Businesses in other countries usually have more flexibility, regularly with no upper limits and up to several years of authority to acquire common stock. Some scholars even argue that the Swedish re-striction might have had restrained effects on any abnormal returns.
1.2 Problem Statement
For an investor, the aspiration for excess return, the “hunt for alpha”, is a severe struggle. Some might invest in low P/E stocks, small firms or value stocks. Some just throw darts over the list of S&P 500, letting fortune control their investments, while others use advanced mathematical models to determine the most optimal composition of a portfolio. Whether investing in companies that buy back equity is a profitable approach depends on whom you ask. Asking the same question in Sweden gives you few, often inconclusive, results.
As mentioned, some evidences show positive share price effects for U.S companies while European firm’s abnormal returns are not as significant. Most studies are very near-sighted, only focusing on initial returns. Even for empirical research that comprises a longer period, we argue that focus on long-term is still undersized with respect to a continuous investment approach that many investors prefer.
Studies of returns for companies that participate in repurchase programs on the Swedish stock market are few in numbers. Since repurchases only have been allowed for a short time, there exist almost no reliable studies of the long-term effect on share prices.
Even though one might find that companies engaging in repurchases generate abnormal re-turns, there could be certain companies that generate most of these returns. Some Swedish studies have their suggestions about company-specific characteristics that generate abnor-mal returns, although we claim that this topic can be investigated further.
It seems to be a hefty debate going on regarding how to calculate appropriate abnormal re-turns. Three common methods of calculating abnormal returns, Cumulative Abnormal Re-turns (CAR), Buy-and-Hold Abnormal ReRe-turns (BHAR) and Calendar Time Abnormal ReRe-turns (CTAR), all which accounted for in section 5, are usually applied. Many of the former Swedish studies have focused on the CAR and BHAR method; thus, leaving an opportunity open to compare their results by applying for example CTAR or more suitable BHAR meth-ods.
Due to the financial turmoil on the world’s financial markets during the last decade, we find it interesting to investigate the long-term price effect of Swedish share prices. A study inves-tigating the entire period 2000 - 2012 will reflect more than an entire business cycle and will thus comprise the returns generated during one of the most severe crises since the devas-tating crashes of late 1920s. A study of that kind is, as far as we know it, not yet conducted.
8 1.3 The Aim of the Thesis
Given the background presented above, our main purpose will be to investigate the long-term share price effects (from one to five years) for Swedish companies that employed re-purchases programs during 2000 until April 23rd 2012. These returns will be compared with risk-adjusted dittos. Furthermore, we will also test for some factors that can affect abnor-mal returns.
1.4 Limitations
This empirical paper will concern repurchases for companies traded on the SSE. Shares trad-ed on other Swtrad-edish exchanges will not be considertrad-ed. Further boundaries in the data sam-ple are accounted for in section 5.
Methods employed in calculating empirical abnormal returns and hypothesis tests tech-niques in our report are subjected to a number of assumptions and biases. These problems will be assessed in detail in section 5.
Due to time limitations, we have to restrict the amount of company specific factors of our investigation. We intend only to investigate effects from the book-to-market ratio and com-pany size.
1.5 Disposition of the Paper
The rest of this paper is organized as follows: In section 2, a review of current literature is given. In section 3, we discuss the theoretical framework concerning repurchases. Section 4 introduces country specific conditions regarding legislation. Section 5 demonstrates the methodology employed to achieve our aim. Section 6 presents and discusses our findings. We conclude the report in section 7. At last, suggestions about further research on the topic are presented.
9
2 REVIEW OF CURRENT LITERATURE
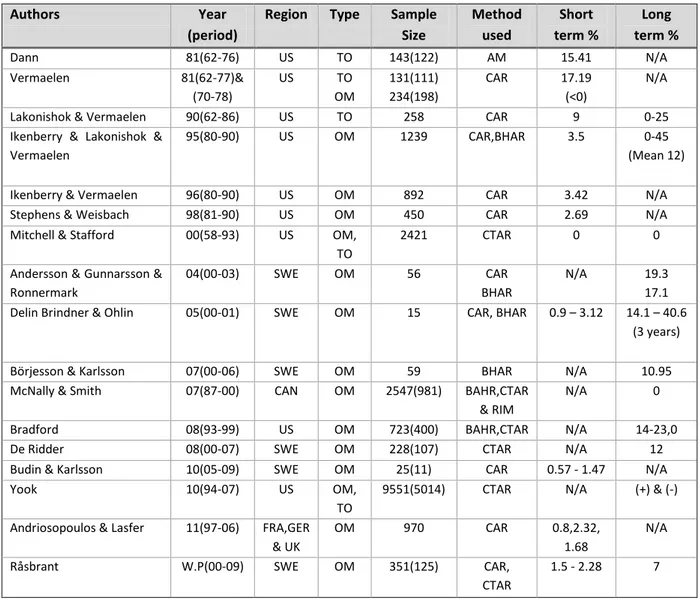
Below we will list the most important findings concerning both short- and long-term effect on share price for companies that employed repurchase programs. Since most findings con-cerned the U.S exchanges, this part contains outcomes that might not be appropriate for the European market in general, nor the Swedish in particular. A compilation of the results with some additional information is found in Table 1.
Table 1 – Summary of previous research
Authors Year
(period)
Region Type Sample Size Method used Short term % Long term % Dann 81(62-76) US TO 143(122) AM 15.41 N/A Vermaelen 81(62-77)& (70-78) US TO OM 131(111) 234(198) CAR 17.19 (<0) N/A
Lakonishok & Vermaelen 90(62-86) US TO 258 CAR 9 0-25
Ikenberry & Lakonishok & Vermaelen
95(80-90) US OM 1239 CAR,BHAR 3.5 0-45
(Mean 12)
Ikenberry & Vermaelen 96(80-90) US OM 892 CAR 3.42 N/A
Stephens & Weisbach 98(81-90) US OM 450 CAR 2.69 N/A
Mitchell & Stafford 00(58-93) US OM, TO
2421 CTAR 0 0
Andersson & Gunnarsson & Ronnermark
04(00-03) SWE OM 56 CAR
BHAR
N/A 19.3
17.1 Delin Brindner & Ohlin 05(00-01) SWE OM 15 CAR, BHAR 0.9 – 3.12 14.1 – 40.6
(3 years)
Börjesson & Karlsson 07(00-06) SWE OM 59 BHAR N/A 10.95
McNally & Smith 07(87-00) CAN OM 2547(981) BAHR,CTAR & RIM
N/A 0
Bradford 08(93-99) US OM 723(400) BAHR,CTAR N/A 14-23,0
De Ridder 08(00-07) SWE OM 228(107) CTAR N/A 12
Budin & Karlsson 10(05-09) SWE OM 25(11) CAR 0.57 - 1.47 N/A
Yook 10(94-07) US OM,
TO
9551(5014) CTAR N/A (+) & (-) Andriosopoulos & Lasfer 11(97-06) FRA,GER
& UK
OM 970 CAR 0.8,2.32,
1.68
N/A
Råsbrant W.P(00-09) SWE OM 351(125) CAR,
CTAR
1.5 - 2.28 7
Type; Tender offer (TO), Open-market (OM), Sample Size; Amount of observations (amount of companies), Method; Average mean (AM), Repurchase index method (RIM). W.P is working paper. Table 1 is a complement
to the preceding text in section 2, and should be taken with caution. Definitions of returns and periods diverge among scholars, thus making an exact comparison very problematic.
In early studies of tender offers, Dann (1981, p. 136) found two-day abnormal returns of ap-proximately 15 % for the common stock holders. Dann also noted positive, although lower returns for owners of convertibles debt (around 3 %), while no significant returns to holders of preferred stock or straight debt. Dann’s main argument was that these positive results occurred due to information signalled from the firms. By calculating excess return as the
re-10
turn of the securities minus return of a control portfolio of appropriate beta-value, Vermaelen (1981, p. 179) discovered that firms which repurchase stock by tender offers see a permanent increase in share price (two days CAR of circa 17 %), also merely explained by the Asymmetric Information Hypothesis. Open-market repurchases results were inconclu-sive, although still reported somewhat negative. In a later study, Lakonishok and Vermaelen (1990, p. 476) also found it possible for U.S shareholders to generate abnormal returns in the magnitude of 9 % in less than a week by buying and tendering. One of their suggestions about why these anomalies occurred was due to the rare events of tender offers at the giv-en time.
Lakonishok and Vermaelen (1990, p. 476) also detected evidence that the American share-holders reap long-term gain (up to two years) by being invested in companies that repur-chase stock. A big distinguish was made between small and large firms where small firms constitute almost all the gain over 22 months. They advocated that tender offers might be an implement for corporate restructuring for large firms, when it is a sign to signal under-valuation for a smaller corporation.
Scrutinising the effects of U.S open-market repurchases between 1980 and 1990, Ikenberry, Lakonishok and Vermaelen (1995, p. 195) calculated the typical four-year BHARs to be around 12 %. “Value” stocks, i.e. stocks with high book-to-market (B/M) values were reaping average returns in the size of 45 %, while no abnormal returns is recorded for “glamour” stocks, that is low B/M stocks. The authors concluded that signalling undervaluation seem to be the main reasons for high B/M firms to repurchase stock while low B/M companies have other motives.
Stephens and Weisbach (1998, p. 325) observed that three-day abnormal returns were 2.69 % on average. Similar results (3.5%) were found by Ikenberry, Lakonishok and Vermaelen (1995, p. 183), and Ikenberry and Vermaelen (1996, p. 18) (3.42 %). Andriosopoulos and Lasfer (2011) studied a large sample from France; Germany and U.K. Positive initial returns for all three markets were reported, although lower than U.S. dittos.
Mitchell and Stafford (2000) conveyed strong critique against methodology applied in previ-ous research. Adjusting for positive cross-correlations, the authors found no evidence against efficient markets, implying that there is almost no long-term gain to acquire. In a Canadian study of repurchases during 1987-2000, McNally and Smith (2007, p. 716) disa-greed with many other studies and emphasized that the transaction costs offset any abnor-mal return. The authors concluded that the non-tendering owners, i.e. the one owning the stocks reaped abnormal returns while the wealth of investors tendering is left unchanged. Similar to Lakonishok and Vermaelen (1990), Bradford (2008) found that small firms drive BHARs. On the other hand, in contrast to Ikenberry, Lakonishok and Vermaelen (1995), val-ue stocks did not experience anomalous returns. Using a multifactor model, corrected for multicollinearity, Bradford observed no significant proof for abnormal return. Yook (2010) also criticized the sampling methods earlier employed. Using a multifactor model, the
au-11
thor found support for anomalous long-term gains for companies that repurchase stock within the first four quarters after proclamation. On the other hand, companies that intend-ed to buy back stock but failintend-ed to do so experiencintend-ed negative results, although not signifi-cant. In addition, Yook (2010, p. 21) also found no abnormal performance for small compa-nies and/or compacompa-nies with high B/M. Abnormal return is instead generated by infrequent repurchases.
Focusing on Swedish research, Råsbrant (press, p. 17) discovered that initial CARs for Swe-dish companies that sought to buy back less than 5 % of outstanding shares estimated 1.50% while companies that sought more than 5 % reached 2.28%. Similar results is also found by Delin Brindner and Ohlin (2005, p. 26) and Budin and Karlsson (2010, p. 28).
De Ridder (2008) detected evidence that Swedish companies with open-market repurchases outperformed several benchmarks over a three-year period. Return was positively correlat-ed with the repurchase size. Råsbrant (press, p. 23) noticcorrelat-ed the cumulative average abnor-mal return for the first year to be around 7% with a major bulk of the return generated in the latter half of the year. He concluded that abnormal return declined in the second year to diminish entirely. Similarly, an earlier study confirmed significant three-year CARs and BHARs (Andersson & Gunnarsson & Ronnermark 2004, p. 37). Delin Brindner and Ohlin (2005, p. 27) found positive effects for all investigated industries with investment firms reaping the largest returns (13.5 % yearly), followed by real estate and wholesalers (6.6 % and 4.7 % respectively). Börjesson and Karlsson (2007) reached the inference that abnormal returns greatly depend on control group applied. Using the respective industry index as benchmark the authors found more realistic one-year BHARs of 10.95 % on average.
In short, the effects on share prices of companies that repurchase stocks are usually posi-tive. Initial return estimate around 3 % for U.S, while lower in most other countries (Vermaelen 2005, p. 51). Shares bought back by tender offers experience much higher re-turns than open-market repurchases. Both tender offers as well as open-market rere-turns have been decreasing over the last decades (Ibid, p. 95). Long-term (both Swedish and do-mestic) effects are far more volatile and are greatly depending on which method that is ap-plied. In most cases, they are reported to be positive but negative returns have also been noticed (Ibid p. 85). Small companies and firms with high B/M are commonly reported to have high abnormal returns, although many studies do not support this statement.
12
3 THEORY AND FINDINGS
3.1 Why Do Companies Buy Back Their Own Equity?
In a vast American study, Dittmar (2000) tried to bone out the reasons why company repur-chase their own stock. In the study comprising the period 1977 to 1996, the author tested previously hypothesised arguments. She found that companies repurchase stock to distrib-ute excess capital, to signal potential undervaluation, to alter the leverage ratio of the firm, to counteract takeovers and to decrease dilution effects from options. Below we present the hypothesis.
3.1.1 The Free Cash Flow Hypothesis – Dividends versus Repurchases
The relationship between the less informed shareholders (i.e. principals) and well-informed management (i.e. agents) is commonly known as agency relationship (Hillier et al. 2010). An agency problem arises when there is a conflict of interest between the parties. Throughout the years, many scholars have devoted vast efforts to form ideas on how to disentangle these issues.
Jensen (1986, p. 324) pointed out that managers should increase dividends or repurchase stock if the company has no better alternatives for the excess cash, i.e. when there only ex-ist low-return or non-positive net present value (NPV) projects. Also known as the “Excess Capital Hypothesis”, the Free Cash Flow Hypothesis suggests that when companies have (of-ten unexpected) surplus capital, they would prefer to distribute it to their shareholders by repurchasing stock to reduce agency costs. Since manager’s compensation is usually tied to the growth of a company, there exists little incentive for managers to transfer the resources that is under their control. Managers prefer to use cash flow in order to grow and expand (Vermaelen 2005, p. 46). The agents urge to see growth of a company might jeopardize fu-ture prospects when negative NPV projects may be chosen, thus not maximising the value to the shareholders. Excess cash have been found to be positively related to open-market excess returns (Vermaelen 2005, p. 52). One can thus expect higher returns for companies repurchasing for this reason.
Fenn and Liang (1997, p. 3) found support for the hypothesis for both dividend- and non-dividend paying corporations. They concluded that companies do not see non-dividends and re-purchases as close substitutes. Yet they discovered evidence that substituting rere-purchases over dividends is related to the magnitude of management option, something they consid-ered to be bad news (Ibid, p. 19). Stephens and Weisbach (1998) also detected evidence that repurchases are positively correlated with levels of free cash flows, thus supporting the hypothesis. Likewise, Bohman (1986, p. 392) supported this hypothesis for Swedish firms.
13
Compared to dividends, open-market repurchases are more flexible and are not expected to recur on a regular basis (Dittmar 2000, p. 333). Ikenberry and Vermaelen (1996, p. 10) ad-dressed that the flexibility of open-market repurchases can expand the set of investment al-ternatives for a firm. This could be an explanation to positive market response reaped by repurchasing companies.
Another argument is due to subordinate personal-tax effects. Dividends are usually taxed as a fraction (magnitude depending on country lawgiving) while capital gains sometimes are taxed at a lower rate (Vermaelen 2005, p. 69). Lower taxes would thus increase the share value of the stock upon announcement of repurchase. Despite taxation benefits, Dittmar (2000, p. 333) found that repurchases do not replace dividends. On the other hand, Yook (2010) disputes that companies engaged in repeated repurchases are substituting dividends. In Sweden where capital gains and dividends are taxed at the same rate, repurchases have not replaced dividends (Gerdin et al. 2007, p. 31).
One study found that U.S repurchases are very pro-cyclical. Dividends are paid with perma-nent operating cash flow while repurchases are paid for with higher temporary, non-operat-ing cash flow. As a result, repurchases are far more volatile than dividends (Jagannathan, Stephens & Weisbach 2000). The authors also found that firms tend to repurchase stock af-ter poor share performance while favouring increased dividends afaf-ter good performance. We see repurchases as a more flexible method than dividends when it comes to distribution of cash flow. Dividends are usually expected to reoccur (Vermaelen 2005, p. 87) and any cuts are typically considered bad signals (Hillier et al. 2010, p. 510). Repurchases are more surprising to investors and are not expected to transpire annually. On the other hand, we do not see repurchases and dividends as perfect substitutes since they both have different characteristics that are appealing to certain types of shareholders. As complements, they oblige to shareholders that have a desire for current income as well as to those that consid-er repurchases as a tool to, for example, buy back undconsid-ervalued equity, adjust the levconsid-erage ratio or protect from hostile takeovers.
14
3.1.2 The Asymmetric Information Hypothesis – Signalling Undervaluation
“When companies with outstanding businesses and comfortable financial positions find their shares selling far below intrinsic value in the marketplace, no alternative action can benefit shareholders as surely as repurchases.” – Warren Buffett
The Asymmetric Information Hypothesis (also known as the undervaluation hypothesis or the signalling hypothesis) stems from the assertion that managers possess more knowledge about the intrinsic value of the firm than any outsider investor do. A manager can signal the market that the stock is undervalued by repurchasing stock. The market should then incor-porate the information of the misvalued firm, and price the stock higher as compensation (Dittmar 2000, p. 334). One can thus expect excess returns if the given reason for repur-chase is undervaluation (Vermaelen 2005, p. 52).
Dann (1981, p. 113) and Vermaelen (1981, p. 179) both suggested that positive returns are due to signalling from firms. Furthermore, Stephens and Weisbach (1998, p. 332) found support for the undervaluation hypothesis. Their study showed that actual share repurchas-es are negatively related to returns of stock in previous periods, meaning firms repurchase stock more frequently after a significant drop in share price. It is thus reasonable to believe that repurchases would be more common shortly after severe downturn on the stock mar-kets. Evidence supports this when many repurchases occurred just subsequently to the Black Monday, 19 October 1987 (Jagannathan, Stephens & Weisbach 2000). In contrast to Stephens and Weisbach (1998), Dittmar (2000, p. 348) still agreed that firms repurchase stock when it is undervalued, although she found no evidence of negative correlation be-tween low previous stock price and repurchase volume. Bohman (2006, p. 392) argued that undervalued Swedish companies repurchase stock. Gerdin et al. (2007, p. 32) discovered no support that Swedish firms in general repurchase stock due to asymmetric information, alt-hough some support that large companies do. Yook (2010) pointed out that firms might have a motive to signal undervaluation, especially for corporations that repurchase common stock infrequently.
Despite that repurchases can assist a company in avoiding agency costs there are certain firms that might suffer upon repurchase announcement. Given that the company operates in a high growth industry (usually also high tech), a repurchase could be seen as a negative signal for the investors since they might discount an expected decline in growth. Pettit (2001, p. 143) argued that these announcement can backfire, leading to long-term investor selling their stocks.
The observant reader might see a window of opportunity for managers to falsely signal un-dervaluation by initiating open-market repurchases, thus trying to impact the share price for own private gain. Since open-market repurchases do not contain any commitments, there arises a question about credibility whether a company will actually repurchase stock or not. This lack of credibility for open-market repurchases might be one of the reasons why one
15
can experience long-term abnormal returns. Ikenberry, Lakonishok and Vermaelen (1995, p. 206) found that the markets initially underreacts on repurchase announcements, not fully incorporating the undervaluation signalled by the companies. In contrast, if a company falsely signals the market by tender offers, it will bear costs since it will end up buying stocks above their true value (Ikenberry & Vermaelen 1996). Due to this reason, open-market re-purchases send the weakest signals to the market. A harsh legislation that penalizes insiders if they engage in manipulative activities could be one solution to increase the trust-worthiness of an announcement. On the other hand, occurrences of such illicit activities are usually hard to prove in court.
We believe that difficulty exists in assessing the credibility of managers that are trying to sig-nal undervaluation. When the trustworthiness of an open-market repurchase announce-ment is a subject to gradation, it is most likely that markets incorporate this risk factor when pricing company equity, thus generally underestimating the statement.
3.1.3 Optimal Leverage Ratio Hypothesis – Reaching the Optimal Capital Structure
A firm’s capital structure should be chosen so that it maximises the value of the company. Given the existence of an optimal leverage ratio, a firm can converge to such a ratio by a change in equity. If the current leverage ratio is below the optimal ditto, a company is more likely to repurchase stock according the Optimal Leverage Ratio Hypothesis (Dittmar 2000, p 335). If optimal leverage ratio is the reason for repurchase, one can expect a positive rela-tionship with excess returns. Bohman (2006, p. 392) found contradictions to the hypothesis in his study of Swedish companies, although he pointed out that the results are inadequate. Gerdin et al. (2007, p. 32) rejected the hypothesis that Swedish companies use repurchases in order to reach an optimal leverage ratio.
3.1.4 Management Incentive Hypothesis – Offsetting Dilution from Stock Options
If the amount of outstanding shares increases because of, for example, exercised warrants, then value per share is diluted. One way to offset the dilution from such an event is by re-purchasing common stock. The Management Incentive Hypothesis states that companies that apply vast equity participation schemes may favour buying back their stock without di-luting value (Dittmar 2000, p 335). Fenn and Liang (1997, p. 1) suggested that management can increase the value of a stock option by repurchasing stock. They noticed correlation be-tween the amount of management options and repurchases, hence confirming the hypoth-esis. Bohman (2006, p. 392) found some, although inconclusive, support that Swedish firms repurchase more frequently given that option programs are initiated. In these cases when repurchases are used as tools in order to surge the value of stock options, the shareholders
16
are victimized because of higher agency costs (Fenn & Liang 1997, p. 6). This in turn leads to lower expected returns for companies stating this as the main reason for repurchase. There thus exists a negative relationship between total options outstanding and expected abnor-mal returns (Vermaelen 2005, p. 52).
3.1.5 Takeover Deterrence Hypothesis – Counter Takeover Attempts
There is a negative relationship with the probability of a takeover of a firm and excess re-turns from repurchases (Vermaelen 2005, p. 52). Bagwell (1991) showed in her article that the takeover costs can be increased by repurchases. The underlying hypothesis argues that shareholders whom are willing to participate in a tender offer are the ones with the lowest reservation price. As a result, the non-tendering shareholders (with relatively expensive stocks) would increase the takeover costs of the firm. Dittmar (2000, p. 349) pointed out that these outside effects did alter the share of companies repurchasing equity. She noticed that U.S firms tried to fence off takeovers in the late 1980s and for some periods in the 1990s by using increased repurchases.
3.1.6 Other Reasons to Repurchase
There are other reasons why companies buy back stock that have been adduced. The most frequent, in our opinion, seems to be the desire to change business ratios. If repurchased shares are annulled, certain market value ratios will change such as earning per share (EPS), price-earnings ratio (P/E) and price-to-book ratio (P/B). The EPS ratio appears to be a specifi-cally strong reason why companies engage in repurchases (Vermaelen 2005, p. 68). A change of ratios might impose a more positive view on the company, thus potentially driving up the share price. Another reason is Bondholder expropriation, where wealth is transferred from bondholders to shareholders (Vermaelen 2005, p. 70).
Looking beyond pure economic factors, there also exist sociological arguments. Bohman (2006) studied reasons behind repurchases for companies on the SSE during 2000-2003. He suggested, and found evidence that decision to buy back stock is not purely based on eco-nomic factors but also on interlocking doctorate, i.e. the practice of board members serving several companies (Ibid, p. 383). This could be the case for Sweden since SSE is relatively small with many large investment firms (e.g. Industrivärden, Investor, Kinnevik, and Ratos) that directly or indirectly control a vast bulk of Swedish companies.
It needs to be pointed out that it is usually not a single reason for a why a company repur-chase stock. Undervaluation is commonly reported as the main reason why companies re-purchase (Vermaelen 2006, p. 72), although firms usually see several benefits from
repur-17
chase of common stock. It is also worth noticing that reasons might differ depending on business cycles, changes in country legislation or personal views from company executives.
3.2 Efficient Market Hypothesis
Below we briefly account for the Efficient Market Hypothesis and its connections to repur-chases. For a full account of the EMH, we suggest further reading in e.g. Fama (1970).
Fama (1970, p. 383) defined efficient market as “A market in which prices always fully reflect available information”. EMH is usually divided into 3 forms of efficiency: (1) weak form, (2) semi-strong form and (3) strong form. The weak form only incorporates historical prices, thus making it possible to trade on public and insider information, but not by applying tech-nical analysis (i.e. using historical price patterns). The semi-strong form comprises all public information while the strongest form incorporates all available information, both public and insider. The strong form then suggests that not even insiders have an edge over other inves-tors. If markets were efficient, they would include any announcement of a repurchase from a manager in the correct way. Neither would the market undervalue the company, thus cre-ating any incentive to repurchase stock for that reason. There would be no room for any long-term abnormal returns since prices would immediately adjust to reflect the true values of the firms.
There is an endless struggle between proponents and challengers of the EMH. Most would agree that markets show some degrees of efficiency, while very few would argue that mar-kets show the stronger form of efficiency. Many base their assumptions on the vast body of literature of behavioural finance that partly explain market errors, thus creating inefficien-cies. Inefficient markets can then present opportunities for managers of firms that can af-ford to take advantage of these opportunities (Vermaelen 2005, p. 91). We connect to the big crowd of believers of the weaker form of efficiency but still argue that insiders definitely have an edge that can be utilized.
18
4 REPURCHASES IN SWEDEN AND ABROAD
4.1 The Swedish Legislation System Regarding Repurchase of Own Equity
The following subsection is based on the law book concerning Swedish joint stock compa-nies (“Aktiebolagslagen”). Swedish firms can acquire their own stock in two ways. By open-market repurchases and via tender offers. Any intention to repurchase stock must have been supported by at least two thirds of the votes on preceding annual general meeting (AGM) and is valid until the next AGM. A firm is not allowed to keep more than 10 % of the total amount of outstanding shares in their inventory, therefore limiting any repurchase programs in magnitude. Shares held by a company are not enclosed with voting rights. In addition, they are not subjected to dividends, and cannot participate in new issues. Ac-quired shares must be held at least 3 months after purchase and must be sold or annulled within three years (Regeringskansliet 2005). When company shares are annulled (i.e. re-voked), the balance sheet is adjusted. Annulation of stock is thus treated as a reverse issue of company equity (Tivéus 2000, p. 258). A more detailed explanation from the law book lies outside the scope of this paper. We suggest chapter 19 from Aktiebolagslagen in Regeringskansliet (2005) or Tivéus (2000) for further information.
NASDAQ OMX requires that each company that desires to repurchase/sell own equity first must announce its intentions. The announcement should be available to the public as soon as possible and include information such as: timeframe for repurchase/sale, current holding of company share and maximum amount to buy/sell, highest and lowest price, the purpose of the intent and other conditions (NASDAQ OMX 2012, p. 38). A company is not allowed to buy/sell more than one quarter of the average daily turnover during the last four weeks with exceptions for large block trades (Ibid, p. 39). The trade should also occur within the spread on the exchange. Once a company buys/sells stock on the open market, it must dis-close every trade as soon as possible or at latest 30 minutes before the opening bell on the next trading day. The report should include date, amount and class of shares, price, current holdings of own shares and total amount of shares in the company (Ibid, p. 40).
Fredrikson, Nilfjord and Peterson (2001) conducted an empirical study of one year after re-purchase became legitimate for limited companies. Advocates of allowed rere-purchases claimed that companies could create an enhanced capital structure as well as ease the risk for hostile takeover by reducing oversized founds. The opponents meant that repurchases could be used to manipulate the share price. The authors found an initial positive effect af-ter announcement (of 1.12 %); lower than most American studies of the similar kind. They suggested that the relative hard law was the cause of the diluted results.
There has been some debate about the fraction of own stock a company is allowed to own. On behalf of the Swedish Department of Justice (Justitiedepartementet), Skog (2010) sug-gested to remove the 10 % limit entirely. The only constraint is that one stock must be held
19
by someone else than the company (Ibid, p. 78). Skog regarded the current restriction as a historical hazard, stemming from obsolete German and Danish compromises dated as far back as to the 1930’s (Ibid). Aktiespararna, a large organisation for small private investors, opposed such a change, with the focal argument to protect the minority owners of the shares from losing influence (Berggren & Mårder 2010, p. 2). At the time of writing this pa-per, the law still enforces companies to hold a maximum amount of 10 % of the total out-standing shares. There seem to be no imminent change on the horizon.
4.2 Legislation in Other Countries
Many firms in other countries have more leeway than Sweden when it comes to regulation regarding repurchase of own stock. Similar to Sweden, Norway and Finland impose an upper boundary of 10 % of the amount of stock a company can hold of its own equity. Permission to buy/sell stock after AGM is sat to maximum 18 months. Denmark has no frontiers with a permission to repurchase stock for up to five years (Skog 2010, p. 75). Sweden, Denmark and Finland are all members of the EU. One can thus see those countries that are very simi-lar in other aspects, choose to apply directives very differently.
Looking into EU, a new set of directives was introduced in 2006. A flat limit of 10 % was re-moved and nowadays no member can set a limit under 10 %. Any decision about repurchas-ing stock from the AGM is now valid for a maximum of five years (previously maximum 18 months) (Skog 2010, p. 76). In U.K, a company needs the approval from the shareholders. There is an 18-month limit and the maximum of 15 % of the shares can be repurchased. Dis-closures of trades occur on a daily basis and there are regulations about insider trading (Kim & Schremper & Varaiya, press).
American laws concerning open-market repurchases is, by far, less stringent than most oth-er countries. Only a board approval is required to initiate an open-market repurchase pro-gram. There is no time-, size- or price restrictions and firms are not required to disclose trades after each execution (Kim & Schremper & Varaiya, press). Instead, disclosure occurs on a quarterly basis (Vermaelen 2005, p. 37).
We see the U.S. law regarding open-market repurchases to be rather improper when it serves as a potential tool for dishonest managers to reap private gains on other sharehold-ers expense. However, there might be benefits of a less stringent system than what is cur-rently employed in Sweden. For example, it might be better to demand a majority of votes instead of two thirds, an increased upper cap of allowed repurchase fraction or a longer time frame for which repurchases can be made before authority renewal is required.
We consider that there might be a possibility to experience smaller long-term gains for countries with a less strict regulation. We base this argument on the fact that credibility of managers in countries with harsh laws should be higher. It could thus exist an extra risk
fac-20
tor for a country with more lenient rules, such as U.S, that needs to be compensated for once credibility of the managers is restored. Furthermore, as we already mentioned earlier, the surprise factor is larger in US since repurchase authority is only need to be granted by the board of director. In most other countries, the shareholders approve buy backs, hence the announcements are usually greeted with some disinterest due to the lack of a surprise factor (Vermaelen 2005, p. 61). The author suggested that this might be one reason why re-turns are generally reported lower in countries with more harsh legislation.
21
5 MEASUREMENT OF ABNORMAL RETURN
5.1 CAR – Cumulative Abnormal ReturnsUsing the CAR-method, abnormal returns are usually calculated on a monthly basis and then totalled over time. The CAR-method assumes rebalances of portfolios, to equal weights and does not take compounding returns into account. An empirical paper employing the CAR method is often a target to critique since an investor will most likely never follow such an approach, and thus the results should be seen mainly as descriptive (Ikenberry & Lakonishok & Vermaelen, 1995, p. 188). CAR is usually calculated as:
𝐶𝐴𝑅𝑖𝜏 = ∑ 𝐴𝑅𝑖𝑡 𝜏
𝑡=1
(1)
Where 𝐴𝑅𝑖𝑡 is the abnormal return of firm i at time t. Barber and Lyon (1997) argued that because the CAR ignores compounding effect, testing hypothesis whether the long-term ab-normal return is significant or not is equivalent to testing the monthly CAR.
5.2 BHAR – Buy-and-Hold Abnormal Returns
To test the long-term hypothesis, the monthly BHAR is a better suggestion. For a more de-tailed analysis of the difference between both methods and description of the flaws, see Barber and Lyon (1997). Under the BHAR-method, abnormal return is the result from a buy and hold investment in the sample firm less expected return from a buy and hold invest-ment in an identical non-repurchasing firm.
𝐵𝐻𝐴𝑅𝑖𝜏 = ∏[1 + 𝑅𝑖𝑡] 𝜏 𝑡=1 − ∏[1 + 𝐸(𝑅𝑖𝑡)] 𝜏 𝑡=1 (2)
Where 𝑅𝑖𝑡 is the raw return on firm i during month t, 𝐸(𝑅𝑖𝑡) is the expected return for the sample firm i at time t if it does not participate in repurchase. One proxy for 𝐸(𝑅𝑖𝑡), could be a firm with similar book-to-market ratio and size. The mean buy-and-hold abnormal re-turn is the weighted average of the individual BHAR, usually denoted as:
𝐵𝐻𝐴𝑅
̅̅̅̅̅̅̅̅ = ∑ 𝑤𝑖. 𝐵𝐻𝐴𝑅𝑖 𝑁
𝑖=1
(3)
Barber and Lyon (1997) stated that BHAR exactly capture investor’s experience. While this is true, it only reflects investor experience of holding securities for a long-term. It neglects oth-er investment strategies such as quartoth-erly restructure portfolio and so on. Thoth-erefore, this method is only most suitable for investor with a long-term trading strategy.
22
Another notable drawback of this method is due to the compounding effect. Given this property, the BHAR performance increases when the holding period extends, regardless of when in the period abnormal return occurs. For instant, if abnormal performance exists only within half a year following the repurchase, then the three- and five-years BHAR return will both be significant in test, although the five years BHAR is larger in magnitude. Since length of the holding period is arbitrary in this case, when one wishes to determine how long the abnormal return continues after the event, the BHAR cannot be of help (Mitchell & Stafford 2000).
While using BHAR, readers should also be aware of the limitations, which can inflate test statistic results, depending on the implementation, thus jeopardizing hypothesis testing. Barber and Lyon (1997) pointed out three biases the BHARs suffered from. First is the new listing bias. Since abnormal return is usually calculated as sample firm return less control firm return, which many see as the market return, then the abnormal return can be posi-tively skewed. This is because it is uncommon that market returns, unlike individual firm re-turn, have extreme annual returns. This is due to a number of new listed companies that usually underperform market average.
Secondly, skewness bias arises when one considers test statistics as a form of division be-tween mean BHARs of sample firms and the cross-sectional standard deviation of sample firms. Consider a sample with positive sample mean; this sample is likely to contained ex-treme positive observations. On the ground that the distribution of BHAR is positively skewed, these observations are overrepresented in the sample. As a result, they will lead to an inflated estimate of standard deviation, thus a negative bias in this type of test statistic. Finally, rebalancing bias is the result of monthly rebalancing of all securities constituting the index. Some buy and hold abnormal returns are calculated using a benchmark of an equally weighted market index. In which, in order to maintain equal weighting, when a security is higher than the market return, it is sold and when it is below market return, it is purchased. While the return on sample portfolio is not rebalanced, this action turns out to cause an in-flated market index return and a negative bias in the BHAR.
5.3 CTAR – Calendar Time Abnormal Returns
Fama (1998) raised concerns over the BHAR’s ignorance to the cross sectional data depend-ence and questioned the reliability of methods that do not consider this property. The CTAR-model is an improvement for this reason and the belief that market is efficient, ac-cording to Fama (1998).
This method measures long-term stock price performance in calendar time relative to some asset pricing models or other benchmarks. The applied model is the three-factor model
de-23
veloped by Fama and French, which consists of a market factor, a size factor and a book-to-market factor:
𝑅𝑝,𝑡 − 𝑅𝑓,𝑡 = 𝑎𝑝+ 𝑏𝑝(𝑅𝑚,𝑡− 𝑅𝑓,𝑡) + 𝑠𝑝𝑆𝑀𝐵𝑡+ ℎ𝑝𝐻𝑀𝐿𝑡+ 𝑒𝑝,𝑡 (4) Where 𝑅𝑝,𝑡 is the raw return on the stock of firm i, 𝑅𝑓,𝑡 is the risk-free rate based on a three-month Treasury bills, 𝑅𝑚,𝑡 is the return on a value-weighted market index. 𝑆𝑀𝐵𝑡 is the size premium determined by subtracting the value-weighted portfolio of large firms return from the portfolio of small firms return, 𝐻𝑀𝐿𝑡 is the return of value-weighted portfolio of high book to market stock less low book to market stock. In addition, 𝑒𝑝,𝑡 is the error term, 𝑎𝑝 is the intercept, 𝑏𝑝, 𝑠𝑝and ℎ𝑝 are the model coefficients; these parameters can be achieved af-ter running the regression. It is clear that afaf-ter running the regression, if the inaf-tercept 𝑎𝑝 is positive, there exists unexpected return from the sample firm after accounting for factors that could influent the performance suggested by this model.
One of the important disadvantages of this model is due to the changes in event firms through time, which will lead to substantial variation in the slopes of the model. In addition, inferences about the intercept can be affected by changes in the number of firms in the event portfolio (Ibid).
5.4 Choice and Critique of Method
To detect long-term abnormal return, two main issues are usually addressed.
First is the calculation of abnormal return. This has been the subject to a number of contro-versy papers, and yet there is no conclusion upon the best approach for calculating long-term abnormal return. Barber and Lyon (1997) argued that all current methods are flawed and they suggested the BHAR method on the ground of conceptual reason. In addition to the previous biases, Fama (1998) introduced “the bad model problem”, explaining that the lack of good estimators as benchmarks, creating errors in the differences between the BHARs. These errors are compounded during the long horizon of interest, potentially creat-ing a huge impact on the final result. Mitchell and Stafford (2000) found the BHAR produces test statistics that are four times too large. However, a strong body of research has opposed efficient markets with the argument that the lag between stock price and an event that cause changes in the price is not short enough. They opposed CTAR and supported the idea of using the BHAR.
Secondly, methods for setting the benchmark for long-term return to test the significant of abnormal return should be considered. Barber and Lyon (1997) analysed three approaches for doing so using a reference portfolio approach, matching sample firms to control firms or an application of three-factor model of Fama and French.
24
For a representation of a measurement that assesses abnormal return that can serve all dif-ferent situations, BHAR is not compelling enough to draw all attention to itself. However, because our main concern is to evaluate performance of the firm for a period of up to five years, rather than periodic temporary performance of firms following the event, we argue that the BHAR is suitable as the abnormal performance measurement in our case.
It is explained by Barber and Lyon (1997) that sample firms and control firms can be match of similar sizes and book-to-market ratio, in order to degrade the subjected biases. Howev-er, due to the limitation of time and availability of data, we will use the appropriate super-sector index as the benchmark in our model and compare it with a proxy for the market in-dex. The name supersector might cause some confusion. A supersector index is actually an index containing a subset of companies from a broader index, i.e. Real Estate is a supersec-tor index of the secsupersec-tor index Financials. This paper applied equally weighted portfolios for the BHAR when applying equation (3).
We will investigate a trading strategy where the investor waits until he or she sees repur-chase activity from the company. Once repurrepur-chase is confirmed, the investor will take a long position in the share, holding it for up to five years. This is in contrast to many other studies that focused on the announcement of repurchase. We argue that this is a more realistic trading strategy and is more suitable for risk-averse investors, rather than buying stock upon repurchase announcement. If markets were efficient, the information should be incorpo-rated once repurchase activity is noticed, thus leaving little room for any abnormal returns to be captured. As mentioned previously, we do not expect the market to be fully efficient; therefore, we see a possibility for abnormal returns. Also because of this reason, we prefer the BHAR instead of CTAR method, since the later assumes efficient market.
It is also easier to follow repurchase activity since it is collected from NASDAQ OMX’s homepage rather than press-released, cryptic, repurchase intentions. We are aware that by doing so, we neglect the fact of whether company fulfil the amount of stocks it promised to buy back. On the other hand, we argue that this is a more suitable approach for an investor that might have disputes whether managers are credibly in their intentions to repurchase stock or not. In addition, economic rationality should imply that managers only repurchase stock if they do not believe it will be cheaper tomorrow, particularly if they want to signal undervaluation. Following suite and trade upon this piece of information also fits a long-term investor. Choosing this approach will limit our thesis to disregard the reasons compa-nies address for the repurchase.
25 5.5 Period of Investigation
Because of the Swedish legislation, our time frame will be limited to the period 2000 to the 23rd of April 2012. Our definition of long-term will be at least one year. With the lack of a big data set, we have been limited to put the upper limit on five years, while still keeping a suf-ficient amount of degrees of freedom in order to make statistical inferences.
5.6 Data Selection, Assortment and Limitation
Our dataset will be comprised of companies that are still trading on the NASDAQ OMX’s Large-, Mid- or Small-cap. It will only contain companies that have signalled and actually en-gaged in repurchase of equity. Companies that only signalled their intention to buy back share will not be accounted for. There are companies that repurchased stocks on multiple times during the period. To save time, we only consider the first buy back in the period of contemplation and ignore other events that follow. By ignoring recurrent buy backs, we un-fortunately fascinate all returns to a certain date.
Other events that happened during the underlying period that might influence the return will also be disregarded. For instance, the issuing of new equity prior or proceed the re-purchase will not be taken into consideration. Since this action is the reversal of rere-purchase, if a company employs both, their effects can offset each other. While this is an important feature if one wishes to evaluate the equity’s value, this paper only presents result in term of stock price.
Furthermore, the dataset will ignore companies that are no longer traded on the exchange or have changed list. A company can be delisted from the stock exchange for many reasons. Most common is financial distress or acquisition by another company. Historical data for these companies are usually quite inaccessible and due to time constraints, we decided to exclude them. Excluding acquired corporations probably have a negative bias on our sample since generous premiums usually occur in those circumstances. On the other hand, exclud-ing companies that went bankrupt will most likely result in a positive bias. We assume that the aggregated bias is more negative for our sample, during the period; because there is a larger number of companies that were brought up by others than the number of companies went bankrupt.
Historical stock- and index quotes, market cap as well as yearly reports about repurchase ac-tivities will be collected from the NASDAQ OMX, http://www.nasdaqomxnordic.com/. In case NASDAQ OMX lacks any data we will, if possible, collect missing data from the compa-nies’ home pages. The data we collect will be of adjusted type and the indices will be gross indices. We will make no further corrections in the data to compensate for any factors such
26
as dividends and splits. The adjusted data should already account for these circumstances. Potential transaction costs and/or taxes on financial activity are also disregarded.
Book-to-market values for 2000-2003 are collected from Andersson, Gunnarsson and Ronnermark (2004), while B/M for the remaining years are collected from Börsdata, www.borsdata.se.
NASDAQ OMX only records repurchase performed after the 14th of December 2000. Since we are interested for the entire 2000, we had to turn to other source to find the initial dates of repurchases. For the period January 2000 – December 2000, we will use dates presented in the detailed survey by Olsson and Sandberg (2002).
Using data achieved from Internet sources is always a subject to a controversy of trustwor-thiness since it could easily be changed and/or removed. Fortunately, we are confident that data collected in this paper is reliable and accurate. It stems from homepages of organiza-tions with good reputation. Supplying truthful financial data lies within the nature of these companies operations.
5.7 Forming our Hypothesis
It is of common econometric practice to let the null hypothesis, (H0), represents the unex-pected outcome. The null hypothesis is tested against the outcome that researcher antici-pates, which is called alternative hypothesis, commonly denoted HA (Studenmund 2011, p. 123).
Our main aim is to test whether repurchasing companies generate long-term abnormal re-turns. Based on results exposed from previous studies, evidence supports long-term abnor-mal returns both internationally (e.g. Lakonishok & Vermaelen 1990; Ikenberry & Lakonishok & Vermaelen 1995; McNally & Smith 2007), and domestically (e.g. De Ridder 2008; Råsbrant press). The first alternative hypothesis of this paper is in similarity with pre-vious studies that positive long-term abnormal returns are present.
Hypothesis 1 – Positive long-term abnormal returns
H0: There exist no positive long-term abnormal returns for repurchasing firms on the SSE. HA: There exist positive long-term abnormal returns.
We intend to test this hypothesis on returns for one to five years of time, using both super-sector and market index as a proxy for the control firm.
27
Furthermore, the purpose of this thesis is also to test for firm specific characteristics that could explain the returns. Small companies seem to reap greater returns (Lakonishok & Ver-maelen 1990; Bradford 2008). The main reason why small firms would experience greater returns is that they have fewer followers (analysts) and are more likely to be undervalued (Vermaelen 2005, p. 81). In addition, companies with high B/M gain excess returns (Ikenberry & Lakonishok & Vermaelen 1995). This is consistent with the hypothesis that val-ue-firms announce repurchases to take advantage of undervaluation (Vermaelen 2005, p. 81). With the assumption that previous findings also holds true for the Swedish market we formulate hypothesis 2 and 3.
Hypothesis 2 – Small size firms reap higher returns H0: Smaller firms do not experience higher returns. HA: Smaller companies experience higher returns.
We see companies traded on the Small-cap as small companies. We test supersectors re-turns for one to three years.
Hypothesis 3 – High book-to-market firms reap higher returns
H0: Companies with high book-to-market value do not gain higher returns. HA: Companies with high book-to-market gain higher returns.
The companies will be divided into three groups with respect to B/M. The highest B/M group is then tested against the remaining using supersectors returns for one to three years. Furthermore, we will also present general findings without testing them versus any stated hypothesis. These results should be considered to have a descriptive nature. We will com-pare BHARs depending on historical price movement in the share price. In addition, differ-ences between certain industries will be investigated. We also test if results have changed over the time horizon of this paper.
Other factors that might have effects (both positive and negative) on the magnitude of re-turns but are not tested in this paper are for example: managerial ownership, excess amount of cash, probability of a takeover, change in risk after repurchase, amount of out-standing options, the extent of buy back and institutional holding (Vermaelen 2005, p. 52). However, these could all be relevant factors to explain the abnormal returns, unfortunately, due to lack of data and time, we cannot account for them in our model.
28 5.8 Hypothesis Testing
In order to conduct the tests we assume that there are independent samples from normally distributed populations (which we test for later). Furthermore, we also assume that the vari-ances of tested groups are similar, i.e. there is no heteroskedasticity.
5.8.1 t-Test
A t-test is commonly applied when testing hypothesis about separate regression slope co-efficients (Studenmund 2011, p. 128). We will apply the same one-sided t-test as those pre-sented in Barber and Lyon (1997), i.e. the following test statistics to discover whether the abnormal return is greater than zero:
𝑡𝐵𝐻𝐴𝑅 = 𝐵𝐻𝐴𝑅̅̅̅̅̅̅̅̅𝜎 𝐵𝐻𝐴𝑅
√𝑛
(5)
Where 𝐵𝐻𝐴𝑅̅̅̅̅̅̅̅̅ is the mean return, 𝜎𝐵𝐻𝐴𝑅 is the standard deviation of each company’s BHAR and the mean BHAR in the period of consideration and 𝑛 is the number of companies. Level of significance applied is sat to 95 % (i.e. α = 0,05) with (n-1) degrees of freedom (df).
5.8.2 Small Sample Hypothesis Tests for Comparison of two Population Means.
Hypothesis 2 and 3 will be tested according to the following method. Returns data will be sorted into groups of similar characteristics (such as size or B/M) and the significant of the difference in mean returns between each group will be tested. When comparing sample means with each other, we will apply test-statistics presented in Mendenhall, Scheaffer and Wackerly (2008). The general formula will be as:
𝑡𝐵𝐻𝐴𝑅 = 𝐵𝐻𝐴𝑅̅̅̅̅̅̅̅̅̅ − 𝐵𝐻𝐴𝑅1 ̅̅̅̅̅̅̅̅̅2 𝑆𝑝√ 1𝑛 1+ 1 𝑛2 (6)
Where 𝐵𝐻𝐴𝑅1̅̅̅̅̅̅̅̅̅ and 𝐵𝐻𝐴𝑅̅̅̅̅̅̅̅̅̅ are the mean BHARs for two groups, 𝑛2 1 and 𝑛2 are the sample size for respective group. Sp is the pooled estimator for the standard deviation:
𝑆𝑝2 =(𝑛1− 1)𝑆12+ (𝑛2− 1)𝑆22
𝑛1+ 𝑛2− 2 (7)
Where Si2 is the sample variance from the i:th sample, i = 1, 2. These test will be conducted for α = 0,05 with (n1 + n2 – 2) df.
29
6 EMPIRICAL RESULTS
6.1 Description of Data Set
We started by downloading all available repurchase data from NASDAQ OMX. Over the pe-riod 2000-2012, we recorded 549 repurchase activites. Most stocks were bought back dur-ing 2008 (69) while 2009 experienced the lowest frequency (25). After ignordur-ing classes of shares (e.g. A or C), repurchase activities from 158 different corporations were noted. We narrowed the sample down from 158 to 102 different companies because some were no longer traded; had changed name or list; started repurchases after April 23rd 2012 or did not have sufficient data. (See Appendix 1 for full account of companies) Two companies en-gaged in repurchase of own stock every year while 21 firms repurchased stock only during one year in the period. On average, each company engaged in repurchasing activities in 3.85 out of 13 years. Again 2008 was the most frequent year for repurchases (53), while 2005 no-ticed the lowest occurrences after the readjustment of data set (21). Industrial firms, fol-lowed by financial companies were the most common repurchases, whereas telecom-munication-, technology- and health care corporations recorded little repurchase activity. AFGX were chosen as proxy for market index since it had better historical dates than any of the broad indices from NASDAQ OMX. Furthermore, 15 sector and/or supersector indices were collected for each of the 102 companies. A full account for included indices can be found in Appendix 1.
B/M-values were collected for 93 out of the 102 different companies. Once again, this sub-set was divided into three equally sized groups with respect to their B/M at the time of re-purchase. The group with lowest B/M had values ranging from 0.11 – 0.41. The middle group estimated value of 0.41 – 1.08, and the 31 firms with the highest B/M had values in the interval 1.08 – 16.85.
The firms were divided into three different groups with regards to their relative size (i.e. market capitalization) of the company when repurchase was initiated. We recorded 41 large companies, 30 medium sized and 30 small companies.
We were able to record returns (based on 200 days of historical prices) for 93 of the 102 companies. 46 corporations were in an up-trend when repurchase was initiated while 44 companies were in a downtrend.
That most repurchase activities occurred during 2008 was for us not very surprising. Share prices were plummeting, and 2008 came to be one of the largest declines since the 1920’s. Little repurchase activity was recorded in 2009, also what one could expect since the market increased a lot. Comparing the return of AFGX versus the amount of repurchasing companies (see figure A1 and A2), one can see that a declining market did not necessarily result in higher frequency of buy backs. In retrospect, firms that repurchased stock in 2006