Research
Monte Carlo patient-specific
pre-treatment QA system for
volumetric modulated arc therapy
2018:01
Authors: R. Chakarova R. Cronholm M. Krantz P. Andersson A. HallqvistSSM perspective
Background
According to the Swedish Radiation Safety Authority’s Regulations in Radiotherapy (SSMFS 2008:33) are Swedish clinics required to verify the individual dose to patients, prior the first time a new treatment is given. To fulfil this requirement, current clinics perform in-vivo dosimetry in three dimensional conformal radiation therapy (3DCRT), which means that the entrance of each patient field is measured with a diode in a spe-cific point and compared to the calculated dose in the same point. Volumetric Modulated Arc Therapy (VMAT) is an advanced treatment technique where radiation is delivered by a linear accelerator with a continuous rotating gantry combined with dynamic collimator move-ments and varying dose rates. Due to the complexity of VMAT, the previ-ous in vivo dosimetry procedure is not applicable. Current practice in Sweden is to perform pre-treatment quality assurance (QA). The deliv-ered dose is compared with the planned dose based on measurements with different methods, for instance: point dose verification and/or dose distribution verification performed in a homogenous phantom. One dis-advantage is the difficulty to interpret deviations between predicted and measured doses, if the deviation is caused by failures of the accelera-tor performance or the theoretical patient dose distributions. Another weakness is that the recalculations are performed for a homogenous phantom and not for the real patient. Furthermore, there are a resolu-tion limitaresolu-tions caused by the distance between the detectors in dose verification phantoms.
In a previous work (SSM report 2017:13) the authors of this project developed a Monte Carlo (MC) patient-specific pre-treatment QA system. The system allows the calculation and evaluation of dose dis-tributions for VMAT plans in patient geometry based on Computed Tomography (CT) images. The QA system was tested by performing retrospective analysis of radiation therapy plans created for treatment of cancer. An advanced software tool was developed for generation of MC compliant voxel phantoms from patient DICOM data. A stand-alone analysis module was also developed to perform quantitative calculation of deviations between planned and MC dose distributions.
Objectives of the project
The aim of this project was to improve the quality assurance of VMAT planned patient dose distributions for some specific diagnosis, e.g. cervix uterus- and head-neck treatments, using the MC system devel-oped in the previous work. In addition, a pilot study of ionization cham-ber response in dynamic fields has been performed.
MC calculated dose distributions have been investigated for 70 patient plans by comparison of Dose Volume Histogram (DVH) parameters and by more detailed 3D analysis. Diagnose specific tolerance criteria for treatment of four cancer sites: prostate, thorax, gynaecological and head-neck, are suggested and evaluation procedure recommended for practical implementation. Furthermore, the response of an ionization chamber in a dynamic MLC field has been studied and compared to that in a static field.
Project information
Contact person at SSM: Mauricio Alvarez Reference: SSM2016-1362
2018:01
Authors: R. Chakarova 1,2), R. Cronholm 3), M. Krantz 1), P. Andersson 1), A. Hallqvist 4)
1) Department of Medical Physics and Biomedical Engineering,
Sahlgrenska University Hospital, Gothenburg
2) Department of Radiation Physics, Sahlgrenska Academy at
the University of Gothenburg
3) Department of Radiation Physics, Skåne University Hospital, Lund 4) Department of Oncology, University of Gothenburg
Monte Carlo patient-specific
pre-treatment QA system for
This report concerns a study which has been conducted for the Swedish Radiation Safety Authority, SSM. The conclusions and view-points presented in the report are those of the author/authors and do not necessarily coincide with those of the SSM.
Abstract (in Swedish)
Intensitetsmodulerad rotationsbehandling, (VMAT) är en modern strålbehandlingsteknik som möjliggör hög stråldos till tumör och är samtidigt mer skonsam mot frisk vävnad och närliggande organ. Behandlingen är komplex och ställer höga krav på den tekniska prestandan gällande linjäracceleratorn och på noggrannheten av dosplaneringssystemet (Eclipse, AAA) som används vid planering av behandlingen. En oberoende kontroll av den planerade dosfördelningen behöver utföras inför varje behandling. Validering av stråldos i en punkt som utförs vid konventionell strålbehandling är inte tillräckligt för att säkerställa hela VMAT-dosfördelningen.
Det övergripande syftet med projektet, är att med hjälp av Monte Carlo (MC) beräkning-ar som referens, kvalitetssäkra den planerade dosfördelningen i patientgeometri där aktu-ell CT-data tillhörande patienten används.
Ett MC-baserat kvalitetssäkringssystem utvecklades i ett tidigare arbete där dosfördel-ningen kunde beräknas enligt den aktuella behandlingsplanen på patientens CT-underlag och därefter återinföras i dosplaneringssystemet för jämförelse av dos-volym-histogram (DVH). Vidare, en ”stand-alone” analysmodul utvecklades också där skillnader mellan kliniska- och MC-dosfördelningar kunde utvärderas med hjälp av den s.k. normalized dose difference (NDD) metoden för valda toleranskriterier. I detta arbete utökades funk-tionaliteten på flera sätt i MC-systemet; inkludering av behandlingar på ytterligare en typ av linjäraccelerator, dosberäkningar baserade på maskinfiler kopplade till strålningsleve-rans, införande av en statistisk analys i NDD-utvärderingen och förbättring användar-gränssnitt.
Huvuddelen av arbetet inriktades på den kliniska implementeringen av MC-systemet. Ett 70-tal VMAT-behandlingsplaner för prostatacancer, cancer i bröstkorgsområdet samt gynekologisk- och tonsillcancer som kan innehålla flera olika ordinerade dosnivåer se-lekterades och beräknades retrospektivt med MC. Jämförelse av DVH-parametrar relate-rade till medeldos av target visade en skillnad inom 2 % för alla diagnoser mellan Eclip-se AAA och MC. Större skillnader registrerades för parametrar sammankopplade till formen av DVH. NDD-analysen resulterar i en mer detaljerad information för en 3D-volym och en utvärderingsprocedur rekommenderas där NDD-analysen är första steget. Vid resultat med pass rate under 95 % (nivå för godkänd skillnad mellan dosfördelning-arna) fortsätter analysen med DVH-jämförelse och eventuellt med en visuell granskning. Nuvarande patientspecifika kvalitetskontroll inför VMAT-behandling baseras på mätning i fantom. Mätresultaten kan inte säkerställa dosfördelningen i patientens geometri och implementering av MC-systemet är en alternativ väg att gå. Dock är det angeläget att kunna utföra mätning vid specialfall (t.ex. VMAT-behandling för en ny diagnosgrupp eller en avvikande patientplan). En del av arbetet inriktades på att öka förståelsen av jon-kammarresponsen i dynamiska MLC-fält (flerbladskollimator). MC-systemet användes till
Content
Abstract (in Swedish) ... 2
Abbreviations and notations ... 4
1. Background ... 5
2. Project goals ... 6
3. Material and methods ... 7
3.1. Monte Carlo dose calculations ... 7
3.2. SU Dose Analyser ... 8
3.3. Clinical material ... 9
3.4. Utilization of machine log-files from plan delivery ... 10
3.5. Simulation of ionization chamber response in dynamic MLC fields 11 4. Results and discussion ... 12
4.1. Implementation of the MC system ... 12
4.1.1. Treatment of prostate ... 12
4.1.2. Treatment in the thorax region ... 15
4.1.3. Treatment of gynecological cancer ... 17
4.1.4. Treatment of cancer in head and neck region ... 18
4.2. Utilization of machine log-files from plan delivery ... 20
4.3. Simulation of ionization chamber response in dynamic MLC fields .. 20
5. Conclusion ... 23
Abbreviations and notations
AAA – Anisotropic analytical algorithm
AXB – Acuros XB
CAX – Central axis
CT – Computed tomography
CTV – Clinical target volume
DICOM – Digital imaging and communications in medicine
DVH – Dose volume histogram
Dx – Dexter
GTV – Gross target volume
HDMLC – High definition multileaf collimator
HU – Hounsfield units
H&N – Head and neck
MC – Monte Carlo
MLC – Multileaf collimator
MU – Monitor unit
NDD – Normalized dose difference
OAR – Organ at risk
PTV – Planning target volume
PRV – Planning organ at risk volume
QA – Quality assurance
Sin – Sinister
SSD – Source surface distance
TB – TrueBeam
TPS – Treatment planning system
VMAT – Volumetric modulated arc therapy
3D – Three dimensional
1. Background
The Swedish radiation safety authority (SSM) regulates quality assurance (QA) of the radiation treatment. Until recently, three dimensional conformal radiation therapy (3DCRT) has been dominating. The planned monitor units (MU) for each field are verified by calculations of the dose contribution at a certain point based on estimated water equivalent path in the patient and water measurements for a set of open fields. It is assumed that the point dose validation is representative for the entire dose distribution in the patient. In addition, in-vivo measurements of the entrance or exit dose for each field are performed during the first fractions of the treatment and compared to the calculated doses.
This QA procedure is not feasible for modern radiotherapy techniques such as volumetric modulated arc therapy (VMAT). The irradiation is given by a number of irregular multileaf collimator (MLC) openings with continuously changing shape and direction of incidence. The field concept is no longer valid. The non-reference dosimetry conditions require thorough 3D validation of the calculated dose distributions for each patient plan. There are no established methods for in-vivo measurements. Thus, for the VMAT technique, a patient specific pre-treatment QA is recommended allowing different approaches. Various Monte Carlo (MC) methods have been widely used as a reference method for evaluation of clinical algorithms since the energy deposition process can be simulated from first principles. A successful implementation of the method for 3D dose calculations in patient geometry for more than 2500 VMAT plans is reported in the literature [1]. The utilization of an MC method as a pre-treatment QA tool requires a different strategy compared to when the method functions as a research tool. The accelerator model, calibration and the patient modelling need to be carefully validated in both cases. However, in the case of a QA tool, different steps in the calculation procedure cannot be performed manually by a person with a specific knowledge of a Monte Carlo method. Also, all the accelerator types available for the VMAT technique at the clinic should be included. The MC dose distributions in the patient geometry should be available for a global or more detailed comparison with the corresponding distributions from the treatment planning system (TPS). Subsequently, the results should form the basis of a motivated decision about the clinical plan validation. Due to this complexity, the QA implementation of the method is regarded as an MC system, not as an MC simulation.
In our previous work [2], a patient-specific MCQA system has been developed capable to evaluate planned dose distribution in the patient geometry based on computed tomography (CT) images. Varian implementation of the VMAT technique has been considered, in particular, Clinac iX equipped with Millennium 120 MLC and TrueBeam with millennium high definition MLC (HDMLC), as well as plans involving 6 MV flattened photon beams generated in Eclipse TPS. Advanced software has been developed generating 3D voxel phantoms from patient DICOM CT and structure data, capable to include the treatment couch if defined. Spencer-Attix mass restriction stopping-power ratios have been calculated for the tissues included in the patient modelling in order to report either dose to medium or dose to water. A stand-alone analysis module has been developed for quantitative assessment of deviations between TPS- and MC dose distributions based on the normalized dose difference (NDD) method. Deviations outside tolerance criteria are presented in 3D pass/fails maps with indication of which of the dose distribution dominates.
Recently, two new accelerators of type TrueBeam with Millenium 120 MLC have been commissioned in our hospital capable to deliver VMAT. New software has been installed (PerFRACTION™, Sun Nuclear Corporation) storing binary machine log files from beam delivery in a database. The information in these files might be of interest when quantifying differences between planned and delivered accelerator parameters. Also, during the practical implementation of the stand-alone analysis module, possibilities for user interface and data improvements have been noted. The capabilities of the MC system need to be extended in order to respond to this situation.
Furthermore, measurement based practice involves implementation of VMAT plans on a homogeneous phantom, e.g. the Delta4-phantom (ScandiDos AB) or/and ionization
chamber measurements. Such measurements do not verify clinical dose distributions because the patient geometry and tissue inhomogeneity is not taken into account. However, measurements can be indispensable in certain circumstances, e.g. implementation of a new complex dynamic treatment technique or when an individual treatment plan deviates from clinical practice. Therefore, it is important to improve understanding of the uncertainties about measurement based QA.
2. Project goals
This work has been divided in three consecutive goals:
i. Initial aim is to improve the functionality of the MC system by:
o Including Varian TrueBeam with Millennium 120 MLC to the accelerator park and enabling dose calculation based on machine log files from the plan delivery.
o Adding statistical analysis to the dose difference evaluation.
ii. Subsequent objective is to move focus from development to implementation of the MC QA system. In particular, to accumulate larger statistics from analysis of patient plans in order to assist the establishment of global or diagnosis dependent clinically relevant tolerance criteria as well as to test the system performance as part of the clinical QA flow.
iii. Additionally, in order to improve the understanding of measurement based QA, a partial goal is to study the response of an ionization chamber in dynamic MLC fields.
3. Material and methods
3.1. Monte Carlo dose calculations
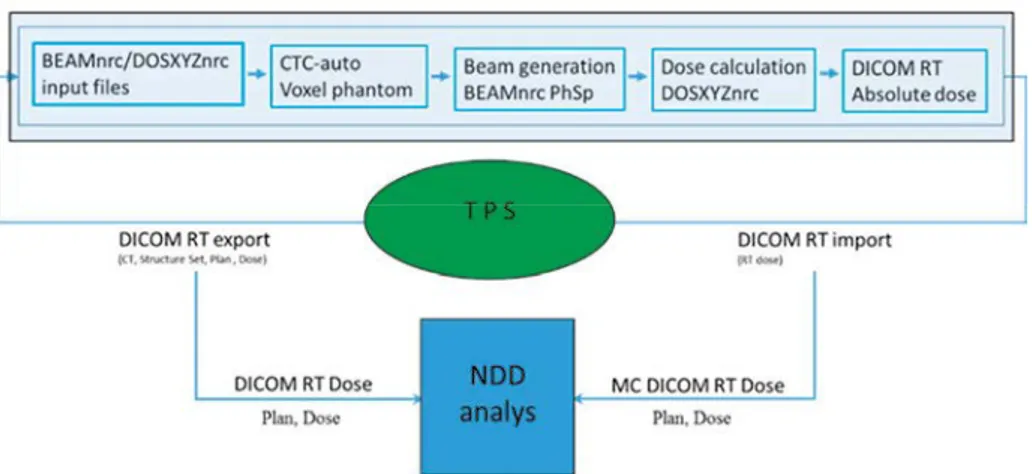
The MC system developed in our previous work [2] has been employed. It is based on the EGSnrc code package and its user codes with modifications capable to compute dose distributions due to a continuously gantry rotation, dynamic multileaf collimator and variable dose rate [3-7]. Main steps in the simulation are beam generation, patient modelling, dose calculations in patient geometry and conversion from dose per incident particle to dose per MU in tissue or in water.
A new accelerator model has been validated, TrueBeam with Millennium 120 MLC, following the procedures described in [2]. Thus, treatment plans for Clinac iX, TrueBeam HDMLC and TrueBeam Millennium MLC can be processed. A machine specific phase space file scored above the first collimation device, (jaws), is applied as a source when calculating the field characteristics below jaw openings defined in the treatment plan. An intermediate phase space is produced and used as a source for further radiation transport through the planned dynamic MLC and the patient geometry. The fractional MU index of the intermediate phase space file is used to correlate to dynamical states of the same MU index.
The patient geometry is represented by nine tissues: air, lung, adipose and muscle tissues, as well as five bone tissues obtained by interpolation of bone mass density and composition between trabecular and cortical bone. The CT calibration curve is taken into account. Data for golden markers and titanium prosthesis are included in the segmentation table. Spencer-Attix mass restriction stopping-power ratios, obtained earlier [2], are stored in the configuration files to be applied as conversion factors between dose to medium and dose to water [8]. A voxel phantom is generated by the CTC_auto software [9] with the same resolution as the dose matrix from the TPS. The treatment couch is included if present in the plan. The resulting dose distribution is converted from MC 3ddose format in Gy per incident particle to field or total dose in Gy in DICOM format.
The workflow is illustrated in Fig. 1. It consists of a number of modules connected to the TPS by means of DICOM exports and imports. Patient CT data, target, organs at risk and other structures, treatment plan and clinical dose distribution are exported from the TPS to the MC system. The MC modules are executed sequentially without user interaction. The automation of the workflow relies on each module at the end of execution to leave data for the next module to process.
An internal network including three high-performance (Haswell i7) computers installed as independent simulation servers along with the Linux based operating system Fedora 21.
Fig. 1. Workflow of the MC system.
MC calculated dose distributions completed by a DICOM plan are imported back to the TPS appearing as a rejected plan as a part of a QA course in order to avoid interference with the clinical plans. The comparison of the clinical and MC dose distributions proceeds in the TPS by the tools available in the TPS, i.e. comparison of DVH parameters, profiles and visual inspection. In addition, the clinical plan and dose distribution together with the MC obtained dose and plan are imported to the stand-alone analysis module for evaluation using the NDD method.
3.2. SU Dose Analyser
The SU Dose Analyzer developed earlier [3], has been further improved. Several iterations of user interface enhancements were implemented and evaluated in order to accommodate a broader user base. In addition to a dose difference map and a NDD map, a failure map visualizing NDD differences outside tolerances has been included in the results window with a scrollbar indicating slice number and longitude in absolute units. Implementation of user-defined dose grid interpolation, prior to dose difference calculation, was developed. A post-analysis feature has been added enabling export of the resulting NDD map to DICOM format file.
Furthermore, the mathematical formalism of the NDD algorithm [10], previously only available as Matlab (Mathworks®) source code, was ported to and implemented in the
Python programming language. In this way, the NDD analysis becomes integrated in the simulation flow; the automation capabilities of the MC workflow are extended and the number of manual post simulation tasks reduced.
A public release of the analysis software (current internal release version 0.7.1) is being considered and an investigation of the conditions of such a release is ongoing.
3.3. Clinical material
The functionality of the MC QA system was tested by performing MC calculations with subsequent analysis for treatment plans generated in Eclipse TPS. Treatment of a single target region as well as treatment of anatomical regions with simultaneous multiple targets with different levels of the prescribed dose were included. Patient plans involved one or two arcs.
Four different cancer sites were selected for analysis i.e. prostate, gynecological, head and neck (H&N) and thorax. For these sites, a retrospective investigation was performed comparing AAA v. 11.0.31 calculated and MC obtained dose distributions.
The patient selection includes 70 patient plans, of these 21 being thorax plans, 26 prostate plans, 13 H&N plans and 10 gynecological plans.
For quantitative plan evaluation, a comparison of dose volume histograms (DVH) parameters for target volumes as well as organs at risk (OAR) was performed as specified below. The choice of the parameters is based on recommended dose-volume objectives and constrains to target volumes and OAR. Estimates such as D95% (dose to 95% of the
PTV 95% of prescribed dose) and V90% (the volume receiving 90% of the prescribed
dose) are used in the comparison.
Prostate plans
Target volumes (CTV mean dose, D95% PTV, PTV mean dose) as well as OAR (V90%
rectum, V75% rectum) were selected for comparison.
Thorax plans
Target volumes (GTV minimum dose, GTV mean dose, PTV mean dose) and OAR (Lung mean dose (Dx+Sin), planning organ at risk volume (PRV) Spinal Cord (SC) D2%) were
selected for comparison.
H&N plans
Target volumes (GTV-T mean dose, GTV-N mean dose, PTV-T mean dose, PTV-N mean dose) and OAR ((Parotid Dx, Parotid Sin (PDx+PSin)), PRV SC D2%) were selected for
comparison.
Gynecological
Target volumes (GTV-T mean dose, GTV-N mean dose, PTV-T mean dose, PTV-N mean dose) were selected for comparison.
The NDD evaluation of the clinical plans was performed in the SU Dose Analyser for 3%/3mm as well as 2%/3mm tolerance criteria and for a 3D region receiving 20% or more of the prescribed dose.
3.4. Utilization of machine log-files from plan
delivery
During dose delivery on a Varian TrueBeam linear accelerator, snap shots of actual parameters (including MU delivered, gantry angle, MLC position etc.) is recorded every 20 ms in a trajectory log file. Accepted deviations between actual and planned parameters are given by the machine specific tolerance tables. If any parameter deviates beyond the accepted value, a beam hold signal is sent to the treatment machine. Thus, differences between dose distributions based on plan parameters compared to the corresponding ones based on machine parameters are related to eventual inaccuracies in accelerator performance.
10 previously delivered fractions each for 5 clinical VMAT plans for various treatment sites were selected from the clinical database. An in house python script was developed in order to read, interpret the binary trajectory log file and overwrite parameters in the original DICOM RP file. A schematic work flow for generating trajectory log file based DICOM RP files is given in Fig. 2. A control point is generated for each snap shot read. The overwritten parameters are:
• Monitor unit • Gantry rotation • Collimator rotation • Couch rotation • Table top rotation
• Jaw collimator positions (Y1, Y2, X1, X2) • MLC positions
The trajectory log based DICOM RP file can be generated under strict or non-strict rules. When strict rule applies, approximations are included in order to generate a DICOM RP file that follows requirements specified by the Varian Eclipse TPS. The number of control points per beam is capped at 500 in Eclipse. Therefore actual beams are split into sub beams with a maximum of 500 control points. Moreover, the Eclipse TPS demand that the rotation direction of a beam is strictly monotonically. This is typically violated at the beginning and ending of delivery as logging occurs, before and after beam on and when the gantry is static. Under strict rules snap shots that disobey the rule of monotonic rotation direction are omitted. Strict rules were applied in this study.
The trajectory files DICOM RPs were imported to the TPS and dose was computed using the same dose calculation algorithm and grid size as for the original DICOM RP. The difference between minimum, mean and maximum dose per structure for the original and the trajectory log file generated DICOM RP file as well as the standard deviation of the difference between fractions was investigated. All reported values are given relative to the prescribed fraction dose.
3.5. Simulation of ionization chamber response in
dynamic MLC fields
The methodology for absorbed dose calculations provided in the dosimetry protocol TRS-398 or in the formalism for reference dosimetry of small and nonstandard fields [11] cannot be directly applied to ionization chamber measurements for VMAT. The VMAT beam delivery involves irregular dynamic (small as well as large) openings and the ionization chamber position relative to these openings constantly changes.
The chamber response in these conditions is studied here in the case of Clinac iX 6 MV for sliding window dMLC movement with 5 mm gap. Two factors have been estimated: a conversion factor, fw/chamber, and a correction factor, Cw/chamber. [12, 13]. The conversion
factor transforms the absorbed dose to air in the air cavity of the chamber, (Dchamber), to
absorbed dose to water, (Dw), for the same volume and geometrical position as for the air
cavity when the ionization chamber is absent:
fw/chamber = Dw/Dchamber.
The correction factor is an estimate of the variations of the conversion factors for non-reference conditions relative to that for non-reference geometry; 100x100 mm2 field size and
10 cm depth at CAX:
Cw/chamber = fw/chamber(non-ref)/fw/chamber(ref)
The cylindrical ionization chamber CC13 (IBA-Dosimetry Schwarzenbruck Germany) is studied in this work. It has an air cavity diameter of 6.0 mm and a cavity length of 5.8 mm. The wall and the central electrode are made of Shonka plastic. Two strategies of modelling of the chamber have been implemented; by using the EGSnrc code and by using of CAD software.
In the first case, the CC13 ionization chamber was built according to its technical specification using the EGSnrc scripting language. The resulting CC13 model was placed inside a cylindrical water phantom with radius 100 mm and length 300 mm. The chamber was positioned with the tip of the central electrode at isocenter and oriented parallel to the
Y-axis (as defined by the movement of the upper jaws). The wall material of the CC13 was defined as a custom material with the chemical composition of Shonka plastic C-552 according to NIST data base (H:2.4%, C:50.2%, O:0.5%, F:46.5%, Si:0.4%). Simulations of absorbed dose to water and absorbed dose to air were performed with the chamber cavity consisting of the PEGS4 material H2O521ICRU and AIR521ICRU respectively. The material of the cylindrical water phantom mimic was defined as H2O521ICRU. Several variance reduction techniques were employed.
The BEAMnrc component module DYNVMLC was employed to generate a dynamic MLC sliding window sequence of 5 mm in width. The generated field sequence was scored to a phase space at SSD = 90 cm and subsequently employed as a radiation source fixed at zero degrees in the simulations performed by the egs_chamber user code.
Within the second strategy, a CAD model voxelization and DICOM-insertion software was developed using Matlab. The workflow consists of four steps. (1) Modelling of the ionization chamber in the SketchUp (Trimble Inc. USA) CAD software, (2) Voxelization of CAD wireframe and export of the resulting data to the Matlab m-format, (3) Dynamic position insertion of voxel-, water phantom-data and scoring VOI into a generated DICOM image stack and plan file and (4) Monte Carlo simulation using the MC QA system.
4. Results and discussion
4.1. Implementation of the MC system
Summary of the NDD analysis of the clinical plans investigated is presented in Table 1. Results from the implementation of the MC system as a patient specific pre-treatment QA for each of the selected cancer sites are presented below.
Table 1. NDD pass rates for the selected cancer sites for 3%/3mm tolerance and 20% dose threshold. The average-, minimum- and maximum NDD pass rates are reported.
4.1.1. Treatment of prostate
volume of the structure of interest. The MC values are subtracted from the corresponding ones calculated in the TPS by the clinical algorithm AAA. The average difference for the mean dose in the target regions CTV and PTV is close to zero (Fig. 3). The average difference for the other DVH parameters, (D95%, V90% and V75%), included in the analysis
is shifted. These parameters are more sensitive to the shape of the DVH than the mean dose. In general, the shape of DVH is known to depend on the calculation algorithm stronger than the mean dose.
The dose to 95% of the PTV, D95%, obtained by AAA is systematically larger than the MC
one (the average difference seen in Fig. 3 is positive). This may indicate a somewhat worse target coverage than the planned one. The average difference is positive for V90% and V75%
for rectum as well. However, rectum is an OAR and it is always an advantage to deliver lower dose OAR and the magnitude of difference should not be of clinical concern when the difference (AAA-MC) is positive.
Fig.3. The average percent absorbed dose difference, (AAA– MC) analysed for prostate with error bars representing one standard deviation.
The NDD analysis of the dose distributions for 3%/3mm tolerances and 20% dose threshold results in pass rate between 96.7% and 98.5%. This means that there is a very good agreement between the clinical and the MC dose distributions in the region receiving 20% or more of the prescribed dose. The dose threshold is chosen to
encompass target and risk organs as well as healthy tissue receiving relative high dose. Thus, the NDD results give more general and more detailed 3D analysis complementary to the DVH parameter analysis.
NDD analysis for 2%/3mm enhances the differences between AAA- and MC dose distributions. The interval of the pass rate becomes wider: 92.5% to 98% (91% for one case). The deviation of the mean dose in CTV and PTV versus the NDD pass rate is presented in Fig. 4. A tendency is seen of smaller deviations for higher pass rate. For example, the deviations are within 1.5% for pass rate larger than 95%. However, the
opposite relation is not true, i.e. less than 1.5% deviation of the mean dose does not ensure high pass rate.
Correlations between deviations in the DVH parameters and the NDD analysis are important for the routine implementation of the MC system. The NDD analysis may be the first step in this procedure. Depending on the resulting pass rate, the clinical plan can be considered as validated or the analysis may continue with comparison of the DVH parameters. The cases, where the deviation of the DVH parameters is small but the NDD pass rate low, may need further visual investigation. From the failure map in the SU Dose analyser, the slices of the failures can be identified and visually inspected in the TPS.
Typical causes for discrepancies between clinical- and MC dose distributions for prostate treatments studied in this work are artefacts in the CT data due to gold markers (Fig. 5) and presence of contrast in the bladder on the CT data overridden in the TPS by designing a help structure with assigned water properties (Fig. 6).
Fig.4. Deviation of the mean dose in CTV and PTV (AAA – MC dose in percent of the prescribed dose) as a function of the NDD pass rate for 2%/3mm tolerance criteria and 20% dose threshold.
-3
-2
-1
0
1
2
3
85 90 95 100M
ea
n dos
e
de
vi
at
ion
[%
]
NDD [%] CTV PTVFig.5. Difference in the AAA (left) and MC (right) dose distribution due to golden markers in prostate. The colour map starts from 95% to enhance the difference. Grey patches are seen in the MC window indicating lower dose.
Fig.6. Dose difference map, NDD and failure maps identifying a slice with large deviations between AAA- and MC dose distributions resulting in low pass rate of 92%. The region of failure is due to contrast in the bladder overridden in the TPS.
4.1.2. Treatment in the thorax region
The results from the comparison of the DVH calculated by the clinical AAA algorithm and the MC are shown in Fig. 7. The deviation of the minimum dose to CTV is the largest one. Point dose values are strongly dependent on the calculation algorithm and should be replaced by dose to 98% or dose to 2% of the volume of interest to represent minimum or maximum dose in the volume. There are small deviations Dmean (CTV, PTV,
and lung) and PRV2% (SC), which suggests a good agreement between AAA- and MC
data.
Fig.7. The average percent difference, (AAA– MC) of the DVH parameters selected for treatments in the thorax region with error bars representing one standard deviation.
The average NDD pass rate for 3%/3mm tolerance is 95.2% and is lower than for treatment of prostate. This is due to the larger inhomogeneity in the region: soft and lung tissues, ribs and tumour with a density of soft tissue. A case with exceptional low NDD = 85% has been investigated in detail by visual comparison between AAA-, Acuros XB- (AXB) and MC dose distributions. AXB is a fairly new algorithm in the TPS, currently under clinical investigation in our hospital. It has higher accuracy than AAA and is capable to present the dose as dose to medium and dose to water. The treatment in the particular case included two target volumes: a lateral one consisting mostly of lung tissue close to ribs and a medial one partly including trachea air. Dose distributions calculated by AXB and by the MC method are shown in Fig. 8. Dose to medium is chosen for comparison to avoid additional uncertainty introduced when converting to dose to water. Dose differences are observed mainly in the lung tissue and in ribs as illustrated in Fig. 8. The tendency of smaller deviations in the DVH parameters for higher pass rates is found although not so pronounced as for treatment of prostate cancer. In Fig. 9 the deviations in the mean dose to GTV and CTV are shown as a function of the NDD pass rate.
Fig.8. Dose distribution calculated by the AXB algorithm in the TPS (left) and the MC dose distribution (right). Dose to medium is shown in both cases. The colour map starts with 70% of the prescribed dose to illustrate the differences.
Fig.9. The average difference, (AAA– MC) in percent of the prescribed dose) of the mean dose to GTV and PTV as a function of the NDD pass rate for 3%/3mm tolerance criteria and 20% dose threshold. The case with NDD = 85% presented in Fig. 8.
4.1.3. Treatment of gynecological cancer
The treatment includes two targets, (extension -T and -N in the notations), with different levels of the prescribed dose. Results from the comparison of the mean dose to the CTV and PTV target volumes are presented in Fig. 10. The average deviations are positive which indicates systematic underdosage of the targets with the MC as a reference.
-3 -2 -1 0 1 2 3 80 85 90 95 100
M
ea
n dos
e
de
vi
at
ion
[%
]
NDD [%] GTV PTVHowever, the magnitude of the deviations is smaller than 1.5% and the agreement between clinical and MC calculations is considered as good.
The average pass rate for the plans investigated is 94.4%. Typical reasons for large deviations are prosthesis, operational clips and interpretation of HU in rectum.
Fig.10. The average percent difference, (AAA– MC) of the DVH parameters selected for treatments of gynecological cancer with error bars representing one standard deviation.
4.1.4. Treatment of cancer in head and neck region
The treatment includes two targets, (extension -T and -N in the notations), with different levels of the prescribed dose. Validation of plans for treatment in head and neck region is a challenging task due to close situated bone, soft tissue and air cavities. A part of the PTV contour may be outside the body contour. The MC dose distribution may include dose to the air between the fixation mask and the patient.
Results from the comparison of AAA- and MC calculations are shown in Fig. 11. Clinically important DVH parameters are selected: mean dose to the target volumes, the dose to 98% of the target volumes (D98%), mean dose to the parotic glands and the dose
to 2% of the volume of the spinal cord. The MC values are systematically lower than these from the TPS. The differences in mean dose to the targets are below 2%. Visual inspection of the target coverage reveals that the AAA dose distribution usually dominates at the target boundary (the first and last target slices in cranial caudal direction). Also, small islands inside the targets are observed, where the AAA dose is larger. The maximum point dose for MC distribution is high, however the voxel volume is negligible. The deviations in the mean dose to the parotic glands are up to 3%. Yet, a positive deviation for OAR is clinically acceptable without restrictions.
Fig.11. The average percent difference, (AAA– MC) of the DVH parameters selected for treatments of cancer in the head and neck region with error bars representing one
standard deviation.
Fig.12. Illustration of the effect of air cavities included in the target volume on the target coverage calculated by MC (A) and Eclipse AAA algorithm (B). The corresponding NDD slice is shown in (C); NDD distribution for the whole irradiation volume receiving larger than 20% dose is shown in (D). Pass rate is the relative ratio of the number of voxels within the tolerance criteria.
4.2. Utilization of machine log-files from plan
delivery
Varian TrueBeam generated machine files (trajectory files) have been compared to the planned parameters for five VMAT plans representative for treatment of different anatomical regions. The maximum deviation found was 0.1% or lower. The analysis of the trajectory files for 10 subsequent fractions for each of the plan delivery show a maximum standard deviation between the fractions as low as 0.1%. The observed differences and standard deviations are far lower than the statistical uncertainty of a Monte Carlo simulation. Dose differences will not be detected between dose distributions based on treatment planning parameters and dose distributions based on machine plane delivery files.
Based on these results, an enhanced machine QA procedure is recommended to monitor beam delivery files in order to detect eventual deviations from the planned parameters. Dedicated dose calculations can be performed for large deviations to assist the estimation of the clinical effect.
4.3. Simulation of ionization chamber response in
dynamic MLC fields
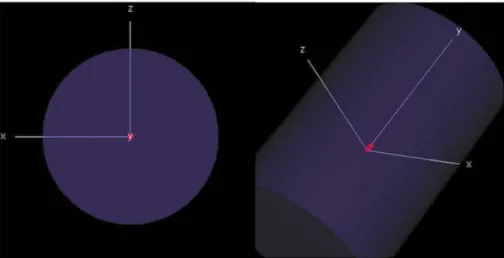
The CC13 model build within the EGSnrc software is visualised in Fig. 13. The exterior view of the ionization chamber is shown with the opacity of the water region colour close to zero as well as a cross-section along the Y-axis of the ionization chamber revealing its constituent materials. In Fig. 14 the position of the ionization chamber inside the cylinder geometry is illustrated.
Fig. 13. Exterior (left) and cross-section view (right) of the CC13 model. Red colour indicates C552 Shonka plastic material of the wall, stem and electrode, green colour indicates air (AIR521ICRU), and blue colour indicates water (H2O521ICRU).
Fig. 14. Position of the CC13 model inside a cylindrical water phantom.
Results from the EGSnrc calculations for the two irradiation scenarios, dynamic MLC (sliding window with 5 mm gap) and static 10x10 cm2 field, are presented in Table 2. The
dose in Gy per incident particle, DPiP, relative uncertainty, σ, in % and the resulting
conversion factor fw/chamber are given.
Table 1: Simulation results with each particular field incident on a cylindrical water-like geometry.
dMLC sliding window 10x10 cm2 static field
DPiP σ DPiP σ
Dchamber 3.48E-18 0.56 2.26E-17 0.78
Dw 3.94E-18 0.13 2.48E-17 0.17
fw/chamber 1.131 1.098
The correction factor becomes:
Cw/chamber = fw/chamber(dMLC)/fw/chamber(10x10cm2) = 1.131/1.098 = 1.03
This means that the dose measured by the CC13 ionization chamber for this particular irradiation and geometry will be underestimated by 3% if correction is not applied. It should be noted that the correction factor obtained is relatively low considering the extreme conditions of dynamic penumbra and small opening comparable to the detector size. Further investigations are planned involving different dynamic MLC sequences and different positions of the ionization chamber in the water phantom.
The alternative model of CC13 by utilizing the SketchUp (Trimble Inc. USA) CAD software is shown in Fig. 15. Voxelization and dynamic position insertion software were developed in Matlab. The voxel size needs to be very small in order to map correctly the
chamber components. However the large number of voxels becomes a problem for the dose calculation. The work continues to find solution to this problem.
Fig. 15. Cross-section view of the CC13 CAD model (left), result of the voxelized CC13 when projected into a volume of 1003 voxels (right).
5. Conclusion
The capabilities of the MC system developed earlier has been extended by including a new TrueBeam accelerator model and enabling dose calculation based on machine log files from the plan delivery. The functionality of the stand-alone analysis module utilizing NDD algorithm has been improved by statistical analysis of the dose differences outside tolerance criteria, interpolation possibilities and optimization of the user interface. The MC system has been successfully implemented for treatments of a single target, (prostate cancer and cancer in thorax region), and for treatments of multiple targets with different levels of the prescribed dose, (gynecological cancer and cancer in head-and-neck region). Deviations between clinical- and MC calculated dose distributions have been investigated for 70 patient plans by comparison of DVH parameters and by more detailed 3D analysis based on the NDD method. The parameters selected for evaluation include mean dose to the target volumes, dose to 95% of the PTV (prostate), minimum dose to CTV (thorax plans) and diagnosis specific OAR like rectum, (prostate plans), lung and spinal cord, (thorax and head-and-neck plans), and parotid glands (head-and-neck plans). In general, a good agreement, (within 1.5%), has been found between clinical- and MC data for the mean dose to the target volumes. The agreement is within 3% for parameters more sensitive to the shape of the DVH, for example D95% PTV or minimum dose to CTV.
Tolerance criteria of 2%/3mm are recommended for NDD analysis of prostate plans and 3%/3mm for rest of the cases. Evaluation procedure is suggested where NDD analysis is the first step. For pass rate lower than 95% the evaluation continues with comparison of DVH parameters. In case of larger than 2% deviations, a visual inspection of the clinical and MC dose distributions is performed.
The response of an ionization chamber in dynamic MLC fields has been studied in the case of CC13 ionization chamber and five mm wide sliding window MLC sequence. The chamber is built according to the technical specifications and embedded in cylindrical water geometry. Conversion factors are calculated relating the dose to the air cavity in the chamber to dose to water for the same volume as for the air cavity when the ionization chamber is absent. It has been found that the conversion factors for the sliding window irradiation differs by 3% from these for 10x10 cm2 static field. The difference is relatively
low considering the extreme conditions of dynamic penumbra and small opening comparable to the detector size.
References
[1] I. A. Popescu, P. Atwal, J. Lobo, J. Lucido, and B. M. C. McCurdy, Patient-specific QA using 4D MC phase space predictions and EPID dosimetry, Journal of Physics: Conference Series, 2015; 573 (1): 012004
[2] R. Chakarova, R. Cronholm, P. Andersson and M. Krantz. Monte Carlo patient-specific pre-treatment QA system for volumetric modulated arc therapy. SSM Report number: 2017:13 ISSN: 2000-0456. Available at www.stralsakerhetsmyndigheten.se
[3] I. Kawrakow, E. Mainegra-Hing, D. W. O. Rogers, F. Tessier, and B. R. B. Walters, The EGSnrc Code System: Monte Carlo Simulation of Electron and Photon Transport. http://nrc-cnrc.github.io/EGSnrc/doc/pirs701-egsnrc.pdf.
[4] D. W. O. Rogers, B. R. B. Walters, and I. Kawrakow, BEAMnrc Users Manual
http://nrc-cnrc.github.io/EGSnrc/doc/pirs509a-beamnrc.pdf.
[5] D. W. O. Rogers, B. R. B. Walters, and I. Kawrakow, DOSXYZnrc Users Manual. http://nrc-cnrc.github.io/EGSnrc/doc/pirs794-dosxyznrc.pdf.
[6] I. A. Popescu, J. Lobo, Monte Carlo simulations for time-dependent radiation sources with general kinematics. Radiother. Oncol 2007; 84:76
[7] J. Lobo and I. A. Popescu, Two new DOSXYZnrc sources for 4D Monte Carlo simulations of continuously variable beam configurations, with applications to RapidArc, VMAT, TomoTherapy and CyberKnife, Phys Med Biol 2010; 55:4431-4443
[8] J. V. Siebers, P. J. Keall, A. E. Nahum, and R. Mohan, Converting absorbed dose to medium to absorbed dose to water for Monte Carlo based photon beam dose calculations. Phys Med Biol 2000; 45: 983-995
[9] R. O. Ottosson and C. F. Behrens, CTC-ask: a new algorithm for conversion of CT numbers to tissue parameters for Monte Carlo dose calculations ap-plying DICOM RS knowledge. Phys Med Biol 2011; 56: N263-274
[10] S. B. Jiang, G. C. Sharp, T. Neicu, R. I. Berbeco, S. Flampouri, T. Bortfeld, On dose distribution comparison. Phys Med Biol 2006; 51: 759-776
[11] R. Alfonso, P. Andreo, R. Capote, M. Saiful Hug, W. Kilby, P. Kjäll, T.R. Mackie, H. Palmans, K. Rosser, J. Seuntjens, W. Ullrick, S. Vatnitsky, “A new formalism for reference dosimetry of small and nonstandard fields”, Med. Phys. 2008; 35: 5179-5186 [12] R. Capote, F. Sánchez-Doblado, A. Leaö, J.I. Lagares, R. Arráns, G.H. Hartmann, “An EGSnrc Monte Carlo study of the microionization chamber for reference dosimetry of narrow irregular IMRT beamlets”, Med. Phys 2004; 31: 2416-2422
[13] J. Wulff, J.T. Heverhagen, H. Karie, K. Zink, “Investigation of correction factors for non-reference conditions in ion chamber photon dosimetry with Monte Carlo
Strålsäkerhetsmyndigheten
2018:01 The Swedish Radiation Safety Authority has a comprehensive responsibility to ensure that society is safe from the effects of radiation. The Authority works to achieve radiation safety in a number of areas: nuclear power, medical care as well as commercial products and services. The Authority also works to achieve protection from natural radiation and to increase the level of radiation safety internationally.
The Swedish Radiation Safety Authority works proactively and preventively to protect people and the environment from the harmful effects of radiation, now and in the future. The Authority issues regulations and supervises compliance, while also supporting research, providing training and information, and issuing advice. Often, activities involving radiation require licences issued by the Authority. The Swedish Radiation Safety Authority maintains emergency preparedness around the clock with the aim of limiting the aftermath of radiation accidents and the unintentional spreading of radioactive substances. The Authority participates in international co-operation in order to promote radiation safety and finances projects aiming to raise the level of radiation safety in certain Eastern European countries.
The Authority reports to the Ministry of the Environment and has around 300 employees with competencies in the fields of engineering, natural and behavioural sciences, law, economics and communications. We have received quality, environmental and working environment certification.