Institutionen för Samhällsteknik
Flow Batteries
Status and Potential
Student: Dominik Dumancic
Supervisor: Fredrik Wallin
1
Acknowledgements
This thesis could not been written without my parents and family who supported me throughout my studies. I thank them all.
I would like to thank my supervisor Dr. Fredrik Wallin and Prof. Dr. Erik Dahlquist who helped and guided me throughout my thesis.
A special thank to the Mälardalen University for giving me the opportunity to write my thesis as an exchange student in Sweden.
In addition, I would like to thank all my friends for their consideration and motivation. Thank you all!
Dominik Dumancic June 2011
2
Abstrakt
Nya idéer och lösningar är nödvändiga för att möta utmaningarna i elbranschen. Användningen av elektriskt lagringssystem (ESS) kan förbättra kvalitén och stabiliteten av det nuvarande elnätet. ESS kan användas till toppbelastningsutjämning, istället för att installera nya produktions eller kraft överförnings enheter, förnybar energi tidsförskjutning och många andra tjänster.
I dagsläget finns det få olika ESS: Mekaniska, elektriska och elektrokemiska lagringssystem. Flödesbatterier tillhör kategorin elektrokemiska lagringssystem som använder sig utav elektrolyt som är lagrad i en tank separerad från battericellen.
För att kunna förstå hur flödesbatteriernas funktioner och på vilket sätt som dem lagrar elektriskt energi är det viktigt att kunna elektrokemi. Flödesbatteriernas funktion är baserad på reduktions och oxidations reaktioner i cellen. Nernsts ekvation används för att kunna uppskatta voltantalet i en cell. Nernsts ekvation säger hur halvcell potentialen ändras beroende av ändringen av koncentrationen av ämnet involverat i oxidations eller reduktions reaktionen. Det första flödesbatteriet uppfanns 1880-talet, men blev bortglömt under en lång tid. Vidare utveckling förnyades under 1950 och 1970-talet.
Ett flödesbatteri består utav två parallella elektroder som är separerade utav ett jonbytes membran vilket formar två halvceller. Dem elektroaktiva materialen är lagrade externt i elektrolyt och är införs bara i anordningen under användning.
Vanadium redox batteriet (VRB) är baserat på dem fyra möjliga oxidations tillstånden av vanadium och har en standard potential på 1.23 V. Fullt joniska ekvationer av VRB inkluderar protoner, svavelsyra och deras motsvarande salter. Kapitalkostnaden av ett VRB är ungefär 426 $/kW och 100 $/kWh.
Det finna andra flödesbatterier som är polysulfide-brom, zink-brom, vanadium-brom, järn-krom, uran, neptunium och löslig blysyre redox flödesbatterier.
Flödesbatterier har en lång omloppstid samt en snabb svarstid men är komplicerade jämfört med andra batterier.
Nyckelord
3
Abstract
New ideas and solutions are necessary to face challenges in the electricity industry. The application of electricity storage systems (ESS) can improve the quality and stability of the existing electricity network. ESS can be used for peak shaving, instead of installing new generation or transmission units, renewable energy time-shift and many other services.
There are few ESS technologies existing today: mechanical, electrical and electrochemical storage systems. Flow batteries are electrochemical storage systems which use electrolyte that is stored in a tank separated from the battery cell.
Electrochemistry is very important to understand how a flow battery functions and how it stores electric energy. The functioning of a flow battery is based on reduction and oxidation reactions in the cell. To estimate the voltage of a cell the Nernst equation is used. It tells how the half-cell potential changes depending on the change of concentration of a substance involved in an oxidation or reduction reaction.
The first flow battery was invented in the 1880’s, but was forgotten for a long time. Further development was revived in the 1950’s and 1970’s.
A flow battery consists of two parallel electrodes separated by an ion exchange membrane, forming two half-cells. The electro-active materials are stored externally in an electrolyte and are introduced into the device only during operation.
The vanadium redox battery (VRB) is based on the four possible oxidation states of vanadium and has a standard potential of 1.23 V. Full ionic equations of the VRB include protons, sulfuric acid and the corresponding salts. The capital cost of a VRB is approximately 426 $/kW and 100 $/kWh.
Other flow batteries are polysulfide-bromine, zinc bromine, vanadium-bromine, iron-chromium, zinc-cerium, uranium, neptunium and soluble lead-acid redox flow batteries.
Flow batteries have long cycle life and quick response times, but are complicated in comparison with other batteries.
Keywords
4
Contents
Acknowledgements ... 1 Abstrakt ... 2 Abstract ... 3 Contents ... 4 Nomenclature ... 6 List of figures ... 9 List of tables ... 9 Introduction ... 111 Electric energy storage ... 12
1.1 Benefits of electricity storage systems ... 13
1.1.1 Peak shaving... 14
1.1.2 ESS instead of generation units ... 15
1.1.3 Transmission and distribution support ... 17
1.1.4 Reliability and power quality ... 18
1.1.5 Renewable energy time-shift and capacity firming ... 18
1.1.6 Ancillary services ... 19
1.2 Mechanical storage systems ... 19
1.2.1 Pumped hydro systems ... 20
1.2.2 Flywheels... 20
1.2.3 Compressed air energy storage systems ... 21
1.3 Electrical storage systems ... 22
1.3.1 Superconducting magnetic energy storage systems ... 22
5
1.4 Electrochemical storage systems ... 23
1.4.1 Lead-acid batteries... 24
1.4.2 Sodium sulfur batteries ... 24
1.4.3 Lithium-ions batteries ... 25
1.4.4 Flow batteries ... 25
1.5 Electricity storage systems comparison ... 26
2 Electrochemistry ... 30
2.1 Electroneutrality ... 30
2.2 Galvanic cells ... 30
2.3 Oxidation and reduction reaction ... 32
2.4 Molality and molarity ... 32
2.5 Chemical equilibrium ... 33
2.6 Gibbs free energy and Nernst equation ... 34
3 Flow batteries ... 37
3.1 History of flow batteries... 37
3.2 Structure of a flow battery ... 37
3.3 Vanadium flow batteries ... 38
3.3.1 Application of the Nernst equation ... 39
3.3.2 Standard potential ... 40
3.3.3 Full ionic equations ... 43
3.3.4 State of charge ... 45
3.3.5 Concentration of vanadium ions and protons ... 46
3.3.6 Cost of a VRB ... 48
6
3.4.1 Polysulfide-bromine batteries ... 51
3.4.2 Zinc bromine batteries ... 52
3.5 Comparison of different flow battery systems ... 53
3.6 Advantages and disadvantages of flow batteries ... 54
3.7 Flow battery installations ... 55
3.8 Future research ... 56 4 Conclusions ... 58 5 Literature ... 59
Nomenclature
Abbreviations Symbol ExplanationCAES Compressed air energy storage EC Electrochemical capacitor EMF Electromotive force ESS Electricity storage system FOAK First of a kind
NaS Sodium sulfur
O&M Operation and maintenance
NASA National aeronautics and space administration NOAK Nth of a kind
PSB Polysulfide bromine battery SEI Sumitomo electric industries
SMES Superconducting magnetic energy storage VRB Vanadium redox battery
7
Constants
Symbol Explanation Value Units
e Elementary charge 1.6022·10-19 C F Faraday's constant 9.6485·104 C/mol NA Avogadro's number 6.022·1023 1/mol
R Gas constant 8.3144 J/K·mol
Roman symbols
Symbol Explanation Units
ai Activity of species i -
ci Molarity (or concentration) of species i mol/m3
E Cell voltage V
E Energy Wh
E° Standard electrode potential V
E°' Formal electrode potential V
ΔG Molar Gibbs free reaction enthalpy J/mol
ΔG° Free energy change J/mol
ΔHr Reaction enthalpy J
ΔH Change in enthalpy J
ΔHr° Molar reaction enthalpy at standard conditions J/mol
I Current A
K Equilibrium constant -
M Molality mol/kg
Mi Molar mass of species i kg/mol
N Number of moles of electrons -
Ni Molar flow rate of species i mol/s
8
Q Electrolyte flow rate m3/s
Qc Charge C
S Entropy J/K
ΔS Change in entropy J/K·mol
ΔSr° Molar reaction entropy at standard conditions J/K·mol
SOC State of charge -
T Time s T Temperature K U Voltage V V Volume m3 xi Molar fraction - Greek symbols
Symbol Explanation Units
9
List of figures
Figure 1 Centralized generation vs. distributed generation ... 13
Figure 2 Daily electric energy production ... 14
Figure 3 Peak shaving by an electricity storage system ... 15
Figure 4 Load covered with an additional generation unit ... 16
Figure 5 Load covered with an electricity storage system ... 16
Figure 6 Transmission line relieved by installing of an additional line ... 17
Figure 7 Transmission line relieved by an electricity storage system ... 18
Figure 8 A pumped hydro system ... 20
Figure 9 Components of a flywheel [3] ... 21
Figure 10 Compressed air energy storage concept [3] ... 22
Figure 11 Sodium sulfur battery cell components and module ... 24
Figure 12 Schema of a flow battery [3] ... 25
Figure 13 Power ratings vs. discharged time at rated power [2] ... 27
Figure 14 Efficiency and lifetime comparison [2] ... 27
Figure 15 Capital cost per power unit and energy unit [2] ... 28
Figure 16 Example of a galvanic cell ... 31
Figure 17 Redox reactions during charge and discharge in a vanadium redox battery ... 39
Figure 18 Standard potential as a function of temperature ... 42
Figure 19 Potential diagram for the vanadium species in strongly acidic solutions [2] ... 43
Figure 20 The full ionic equations of the VRB during the charge cycle ... 45
Figure 21 A 3 element stack with corresponding redox reactions to produce one electron flow47 Figure 22 Costs of redox flow batteries ... 49
Figure 23 Zinc bromine battery [2] ... 52
List of tables
Table 1 Comparison between electricity storage systems ... 2610 Table 3 Thermodynamic data for vanadium compounds at 298.15K. Values in parentheses are
estimated [2] ... 41
Table 4 Vanadium ions with their corresponding salt, battery state and electrolyte where they are dissolved ... 44
Table 5 VRB plant capital and O&M cost ... 49
Table 6 Cost estimation for a 2 kW, 30 kWh system based on an annual production of 1700 units ... 50
Table 7 Projected costs for 10 MW, 100 MWh PSB plant ... 52
Table 8 Comparison of different flow battery systems ... 53
Table 9 VRB ESS installations ... 55
11
Introduction
In this work is shown a solution how to store electric energy based on the flow battery technology.
The first chapter gives an overview of benefits of electricity storage systems (ESS) and of different kinds of ESS which include: mechanical storage systems, electrical storage systems and electrochemical storage systems. The most common kinds of each storage system are described and a comparison of them is made in the end of the chapter.
To understand the flow battery technology some generalities about electrochemistry must be known. Chapter two explains basic terms of electrochemistry and introduces chemical reactions which are crucial for the functioning of a flow battery. Furthermore, equations for energy calculations of a chemical reaction are introduced.
The chapter about flow batteries starts with a short historical overview of the development of flow batteries. After this, the structure of a flow cell is explained. The chemistry of flow batteries is shown on an example of a vanadium redox battery (VRB), which is the most common flow battery. The equations introduced in the chapter about electrochemistry are applied on the VRB and the standard potential is calculated. Full ionic equations with the corresponding salts are shown and the principle of a cell stack is explained. The part about VRBs ends with data about the cost of a VRB.
Other types of flow batteries are mentioned as well and a comparison between the different types is made. The work ends with a list of flow battery installations all over the world and ideas for future research in the flow battery technology.
12
1
Electric energy storage
The electricity network which is in use today developed over the last hundred years, but the liberalization and deregulation of the electricity industry sets new challenges. Therefore are new ideas and solutions necessary to face the challenges. The electricity network must provide security and sustainable supply for all network users, extract the best out of new technologies and coordinate with new laws and business frames.
The electricity network has to be:
• Flexible: It has to fulfill customers’ needs while facing new future challenges and changes;
• Available: It has to ensure network connection for every user, especially for renewable energy sources and electric energy producers with low or none carbon emission;
• Reliable: It has to provide and enhance the security and quality of the distribution according to requirements of the digital era;
• Economical: It has to ensure the best possible price for producers and consumers using innovations, efficient network control, market competition and regulation.
Large centralized power plants will be complemented by distributed generation. New technology or changes in the existing technology will be required to manage transmission and distribution in the distributed generation. In Figure 1 is shown the structure and difference between centralized and distributed generations. It can be seen that distributed generation consists of individual and smaller sized electric generations located at residential, commercial and industrial sites. Furthermore, ESS will play a big role in distributed generation, increasing the power quality. ESS would assist the power generation unit by absorbing load during fast load change and power fluctuations, which occur in distributed generations due to less connected costumers than in centralized generations.
Renewable energy sources, such as wind and solar power, can be used more efficiently with ESS because they must run when available. Their production surplus can be stored with ESS when the demand is lower than the production.
13 Figure 1 Centralized generation vs. distributed generation
1.1
Benefits of electricity storage systems
The main problem with electricity is that it is difficult to store therefore it has to be used whenever it is generated. Dispatchers try to avoid system frequency changes. Changes in demand cause frequency changes either lowering or rising which must be regulated by cutting supplies or engaging excess capacities.
ESS have a wide range of potential applications. They can be applied over short or long time periods.
Over short time periods they are used for power quality control. They provide excess capacities to maintain the system frequency and also absorb or generate reactive power to maintain transmission system voltage stability.
Over long time periods they are used for energy management and in case of an undesired event. In case of transport or distribution failure ESS can be used to provide real power or to energize a part of a grid after a blackout has occurred.
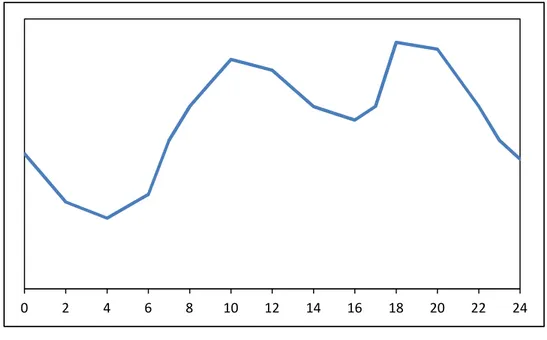
14 1.1.1 Peak shaving
Peak shaving means storing electricity during low demand period and using it during the peak period to reduce the peak height. In Figure 2 is shown a typical daily electric energy production curve. It can be seen that the energy production varies during a day depending on electric energy consumption due to the fact that production and consumption have to be equal in every moment. Its maximum is around noon and in the evening while its minimum is during the night. Therefore it is necessary to predict the daily consumption for the next day to make a schedule for power generation units.
Figure 2 Daily electric energy production
Using ESS can straighten the electric energy production curve which is shown in figure 2.
15 Figure 3 Peak shaving by an electricity storage system
The full line shows the production curve after peak shaving by using ESS and the dotted curve the consumption. In periods when the production is higher than the consumption the surplus will be stored by an ESS and in periods when the consumption is higher than the production the ESS will provide electric energy.
Energy end-users can also use an ESS to reduce their peak load and their costs, especially commercial and industrial customers who are being charged according to their peak load.
1.1.2 ESS instead of generation units
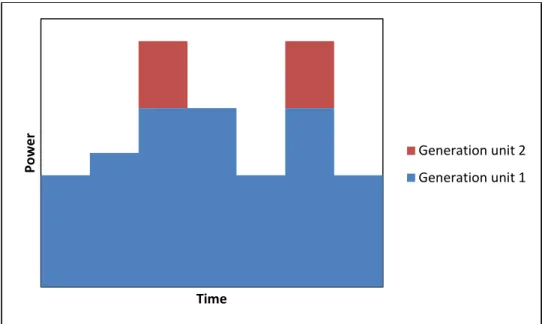
An ESS can be installed instead of new generation units, or it can be installed together with smaller generation units in situations when the consumption increases and the production capacities become tight in certain areas. In Figure 4 is shown how an additional generation unit covers the load.
16 Figure 4 Load covered with an additional generation unit
It can be seen that the additional unit does not run all the time. In Figure 5 is shown how an ESS covers the load where C stands for the period of time when the ESS is charged and D when the ESS is discharged. The benefit of such a solution is a better utilization of the capacity of the existing generation unit and probably a higher efficiency.
Figure 5 Load covered with an electricity storage system
P o w e r Time Generation unit 2 Generation unit 1 P o w e r Time Electricity storage Generation unit 1 C D D C
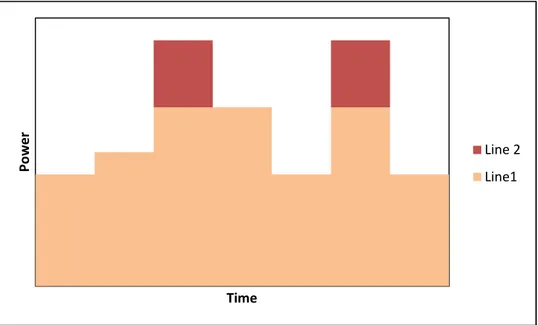
17 1.1.3 Transmission and distribution support
The same strategy as with the additional generation units can be applied for additional transmission and distribution lines. An ESS installed downstream from the transmission and distribution lines, which are becoming congested in many areas due to growth in peak electricity demand, will relieve the power lines by storing a part of the transported energy during a period of low demand. In Figure 6 and Figure 7 are shown how a congested line can be relieved by an additional line and by an ESS respectively.
Figure 6 Transmission line relieved by installing of an additional line
As mentioned before, an ESS can store energy during a period of low demand which is in Figure 7 marked with C and discharge during a period of high demand which is marked with D.
Furthermore, ESS can contribute to a more stable system by compensating for electrical anomalies and disturbances such as voltage sag or unstable voltage.
P o w e r Time Line 2 Line1
18 Figure 7 Transmission line relieved by an electricity storage system
1.1.4 Reliability and power quality
An ESS can protect users from power outages. This benefit is highly end-user-specific, especially for commercial and industrial users for whom power outages and power quality anomalies cause moderate to significant losses [5]. Power quality anomalies can be frequency and voltage variations, appearance of harmonics, low power factor and other interruptions in service that cause loads to go offline and/or that damage electricity-using equipment and whose negative effects can be avoided if ESS is used.
1.1.5 Renewable energy time-shift and capacity firming
An ESS can be charged with low-value electric energy generated using renewable energy. The stored energy may be used or sold at a later time when it is more valuable.
The benefit for firming output from renewable energy generation is related to the cost that can be avoided for other electric generation capacity. If a producer is not able to supply the power offered on the open market, he has to pay a penalty. To avoid the penalty the producer sometimes has a backup generation unit. Instead of a backup generation unit an ESS can be used. P o w e r Time Electricity storage Line 1 C D D C
19 1.1.6 Ancillary services
Ancillary services are those functions performed by the equipment and people that generate, control and transmit electricity in support of the basic services of generating capacity, energy supply and power delivery [3]. ESS are capable to provide many of those services such as:
• Reactive supply and voltage control: The injection or absorption of reactive power to maintain the transmission system voltages within the required ranges;
• Regulation: Minute-by-minute generation or load balance within a control area to meet standards;
• Spinning reserve: Generation capacity that is synchronized to the grid but unloaded and that can respond immediately to compensate for generation of transmission outages; • Supplemental reserve: Generation capacity that may be off-line or curtailable load that
can respond within ten minutes to compensate for generation or transmission outages; • Load following: Meeting hour-to-hour and daily load variations;
• Energy imbalance: Correcting for mismatches between actual and scheduled transactions on hourly basis;
• Backup supply: Generation available within an hour, for backing up reserves of for commercial transactions;
• Real power loss replacement: Generation that compensates for losses in the transport and distribution system;
• Black start: Ability to energize part of a grid without outside assistance after a blackout has occurred;
• Network stability: Real-time response to system disturbances to maintain system stability or security [3].
1.2
Mechanical storage systems
Mechanical storage systems include pumped hydro systems, flywheels and compressed air energy storage systems.
20 1.2.1 Pumped hydro systems
A pumped hydro system’s key elements are turbine equipment, a waterway, an upper and a lower reservoir as shown in Figure 8.
Figure 8 A pumped hydro system
Pumped hydro systems pump water in the upper reservoir when inexpensive energy is available and release it through the turbine which turns the generator when energy is more valuable. Efficiencies of pumped hydro systems are in the range of 70% to 85% with availability at almost any scale and discharge times ranging from several hours to few days.
The disadvantages of pumped hydro systems are long construction times, high capital cost and limitation by geography due to a lack of appropriate locations.
1.2.2 Flywheels
Flywheel electric energy storage systems include a cylinder with a shaft that can spin rapidly within a robust enclosure. Components of a flywheel are shown in Figure 9. A magnet is used to levitate the cylinder to limit friction losses and wear. The shaft is connected to a
21 motor/generator which converts the electric energy into kinetic energy. That kinetic energy is stored by increasing the flywheel’s rotational speed and is converted back to electric energy via the motor/generator, slowing the flywheel’s rotational speed.
Flywheels exhibit excellent cycle life estimated in excess of 100,000 full cycles with a round-trip efficiency for energy flywheels between 70% and 80% [6]. Another advantage of flywheels is the usage of environmentally friendly materials and no emissions. However, the most important environmental constraint is noise when in operation which can be avoided by installing them underground.
Figure 9 Components of a flywheel [6] 1.2.3 Compressed air energy storage systems
Compressed air energy storage (CAES) systems use compressed air to produce electricity. Air can be compressed and stored as potential energy in airtight underground caverns or above ground vessels. For power plants with energy storage in excess of 20 MWh, air is stored in underground caverns and for smaller systems, air can be stored in above ground vessels. Air is compressed during periods of low electricity demand and generated during periods of high electricity demand. The compressed air is released from storage and expanded through a turbine to generate electricity. CAES uses an external fuel, such as natural gas to preheat the cooled, high-pressure air before it enters the expansion stage. In Figure 10 is shown the
22 concept of a CAES system and it can be seen that it is similar to a gas turbine only with the compressor and expander operating independently and at different times.
CAES plants deliver about 75% of the energy used to compress air, they are able to store energy for a long time and have a relatively fast start-up time. Their main disadvantage is their reliance on a particular geological structure.
Figure 10 Compressed air energy storage concept [6]
1.3
Electrical storage systems
Electrical storage systems are based on capacitors and inductors and include superconducting magnetic energy storage (SMES) systems and electrochemical capacitors (ECs).
1.3.1 Superconducting magnetic energy storage systems
A SMES system stores energy in the magnetic field created by the flow of direct current in a coil made of superconducting material. The coil is cooled at a temperature below the temperature needed for superconductivity. At low temperature, the current encounters almost no resistance in superconducting materials which enables the coil to carry large current with very low loss for long period of time.
23 The overall efficiency is about 90% [3] and lifetime is not influenced by the number of cycles or depth of discharge. The main drawback is its high price.
1.3.2 Electrochemical capacitors
The (EC), sometimes referred to as the electric double layer capacitor, supercapacitor or ultracapacitor, stores energy by charge separation at the interface between a solid electrode and an electrolyte. However, ECs don’t belong to the electrochemical storage systems because no electrochemical reactions occur in the ECs. Energy is stored due to an electrostatic charge. Two electrodes are immersed into an electrolyte and separated by a separator. At the interface between each conducting electrode and the electrolyte is a charge storage surface formed. This two charge storage surfaces are in series and when a voltage is imposed across them, there is an increase in electrolyte ion concentration and a change in electrolyte ion orientation near the surface of the electrode [6]. Due to a low voltage of a few volts of a single EC, they are connected in series to achieve a higher voltage.
The efficiency of ECs is typically around 90%, but it can be higher, around 96%, for light duty cycle applications [6].
1.4
Electrochemical storage systems
Electrochemistry is used to store electricity in consumer electronics. Large power applications based on advanced batteries have been developed and successfully implemented. The core of an electrochemical storage system is the battery which consists of two types of electrochemical devices: galvanic cells and flow cells.
Electrochemical batteries consist of two or more electrochemical cells. The cells use chemical reactions to create a flow of electrons. During discharge electrically loaded ions in the electrolyte near one electrode supply electrons while ions near the other electrode accept electrons. During charge the process is reversed.
Electrochemical storage systems described in this paper are the lead-acid, sodium sulfur, lithium-ion and flow batteries.
24 1.4.1 Lead-acid batteries
Lead-acid batteries consist of a series of cells connected together. Each cell is made of two electrodes, one of lead metal (Pb) and the other of lead oxide (PbO2), placed in a sulfuric acid
(H2SO4). These batteries have an energy density around 35-55 Wh/kg [3] and an efficiency from
75% to 80%. The drawbacks of lead-acid batteries are their short cycle life and their inability to withstand deep discharges which limit their use for energy management. Lead-acid batteries are low cost, but their operational cost can be high. Another drawback is that each cycle robs the battery of a small amount of its capacity thus the lead-acid batteries provide between 200 to 1800 charge and discharge cycles, depending on the depth of discharge and operating temperature.
1.4.2 Sodium sulfur batteries
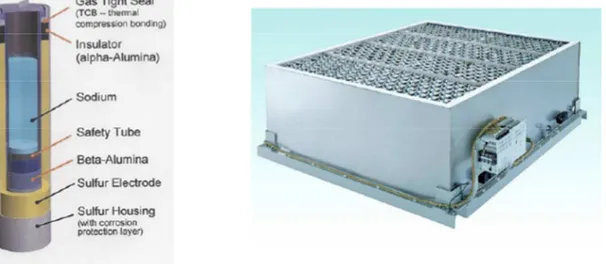
Sodium sulfur (NaS) batteries consist of sulfur at the positive electrode, sodium at the negative electrode as active materials and beta alumina which separates both electrodes. When it is charged, liquid elemental sodium fills the central reservoir. During discharge the liquid sodium is channeled through the narrow annulus between the inner surface of the electrolyte and the safety tube. The cell components and module can be seen in figure 11.
25 The NaS battery operates at high temperatures, around 300 °C. Cell open circuit voltages range from 2.08 V down to about 1.8 V. The efficiency is typically from 70% to 75% and the expected lifetime is about 15 years [6].
1.4.3 Lithium-ions batteries
Lithium is the lightest metal and has the highest electrochemical potential therefore lithium-ions (Li-ion) batteries have a high open circuit voltage compared to aqueous batteries, in average 3.6 V [3]. They have also a high energy density (300-400 Wh/l, 130 Wh/kg) and a long cycle life. The main drawback is their cost.
1.4.4 Flow batteries
Flow batteries use electrolyte that is stored in a tank separated from the battery cell. During charging or discharging the electrolyte is pumped between the electrolyte tank and the cell stack. A single cell consists of a positive and negative electrode separated by an ion exchange membrane. The electrolyte contains one or more dissolved electro-active species. The reactions occur between two electrolytes and the electrodes do not take part. Power and energy are independent from each other.
26 A flow battery is shown in figure 12. The power is defined by the size and number of cells whereas the energetic capacity is related to the amount of electrolyte stored in the tanks. Other advantages are quick response times and long cycle life, around 10,000 cycles [3].
More about flow batteries will be in chapter 3.
1.5
Electricity storage systems comparison
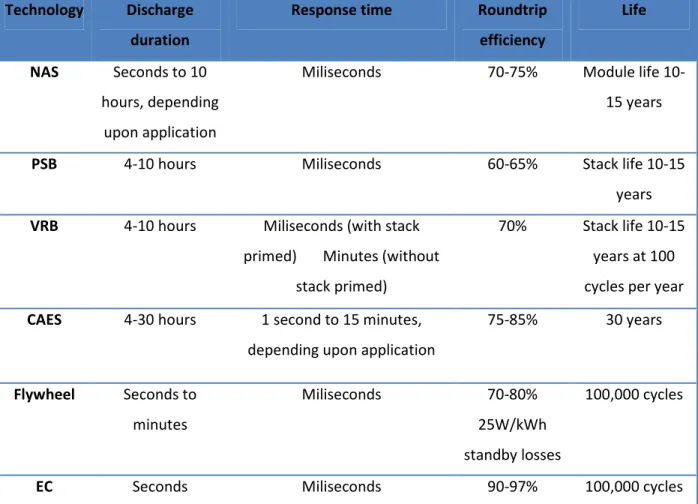
In Table 1 is shown the comparison between ESS according to [6].
Table 1 Comparison between electricity storage systems
Technology Discharge duration
Response time Roundtrip efficiency
Life NAS Seconds to 10
hours, depending upon application
Miliseconds 70-75% Module life
10-15 years
PSB 4-10 hours Miliseconds 60-65% Stack life 10-15
years
VRB 4-10 hours Miliseconds (with stack primed) Minutes (without
stack primed)
70% Stack life 10-15 years at 100 cycles per year
CAES 4-30 hours 1 second to 15 minutes, depending upon application
75-85% 30 years Flywheel Seconds to minutes Miliseconds 70-80% 25W/kWh standby losses 100,000 cycles
EC Seconds Miliseconds 90-97% 100,000 cycles
In Figure 1 are shown different ESS according to their power and discharge time. It can be seen that ECs, flywheels and SMES systems are suitable for power quality due to their ability to provide large quantity of energy during a short period of time. Furthermore, flow batteries, CAES and pumped hydro systems are suitable for energy management due to their ability to store large quantity of energy for very long period of time.
27 Figure 13 Power ratings vs. discharged time at rated power [3]
The efficiency and lifetime comparison is shown in Figure 14.
28 The next is the capital cost comparison. Capital cost is an important economic parameter, but for a complete economic analysis it is meaningful to include the total ownership cost which includes the impact of equipment life, operating and maintenance cost. Figure 15 shows a comparison of different ESS according to the capital cost. However, it can happen that the capital cost of an ESS is relatively low (i.e. lead-acid batteries), but it may not necessarily be the least expensive option for energy management due to their relatively short life for this type of application. The capital cost in Figure 15 excludes the cost of power conversion electronics and the cost per unit energy has been divided by the storage efficiency to obtain the cost per output (useful) energy. The cost includes approximate values in 2002 and the expected mature values for the next few years.
The overall cost is affected by efficiency and lifetime. Low lifetime technologies increase the operating cost and low efficiency technologies have an increase in effective energy cost.
29 Lead-acid and NaS batteries have shorter lifetime, their electrodes wear out faster because they take part in electrochemical reactions. ECs have the highest efficiency, but they store a low amount of energy and thus are not suitable for most applications.
30
2
Electrochemistry
To understand how a flow battery functions and how it stores electric energy it is necessary to know some generalities about electrochemistry.
2.1
Electroneutrality
If a metal (e.g. zinc metal) is immersed in a liquid (e.g. pure water) a small amount of metal atoms separate from the metal and go in the solution as ions leaving electrons behind in the metal. This process causes building up a negative charge within the metal thus making it more difficult for more ions to leave the metallic phase. Furthermore, a build-up of a positive charge in the liquid phase contributes to this inhibition. Very soon the process stops and the difference in electric potential corresponds to the unbalance between the concentrations of oppositely charged particles that are not chemically significant. This prohibition is called the electroneutrality principle.
To continue the oxidation of the metal it is necessary to couple it with another process that restores the electroneutrality of the two phases. One solution is to remove the excess electrons from the metallic phase or to consume the positive ions in the liquid phase. It is possible to remove the excess electrons with an external circuit or to contact the electrode with a good electron acceptor (oxidizing agent).
2.2
Galvanic cells
A galvanic cell contains two electrodes immersed in the same or in two different solutions. If the electrodes are immersed in two different solutions each electrode-solution pair forms a reduction/oxidation (redox) half-cell. A porous barrier is used to separate the two half-cells thus preventing them from mixing, but allowing ions to diffuse through. In Figure 16 is shown an example of a galvanic cell that consists of zinc and copper electrodes, a porous membrane and an external circuit. The excess electrons left in the left electrode flow through the external circuit to the right electrode and react with Cu2+ ions converting them into Cu atoms at the surface of the electrode. In the left half-cell remain Zn2+ ions. The oxidation and reduction reactions take place in the left and the right half-cell respectively as follows [4]:
31 Right electrode: Cu2+ + 2e- → Cu(s) reduction
During the cell operation the solution in the left half-cell is getting net positively charged, due to the release of Zn2+ ions from the left electrode, and the right half-cell net negatively charged while Cu2+ ions are removed from the solution, due to conversion into Cu atoms at the surface of the right electrode. To keep the reaction ongoing, the charge carried by the electrons through the external circuit must be compensated by a transport of ions between the two half-cells. In the example in Figure 16 these are the NO3- ions which pass the porous barrier with
Zn2+ and Cu2+ ions. The positive charge in the left half-cell can be compensated by the drift of the Zn2+ ions to the right half-cell or by diffusion of NO3- ions from the right to the left half-cell.
Both processes can occur and the relative amount of charge carried through the solution depends on the relative mobility of the positive and negative ions. The relative mobility expresses the velocity with which the ions are able to make their way through the solution [4]. The positive ions tend to have higher mobility since they are larger than the negative ions.
32
2.3
Oxidation and reduction reaction
The functioning of a battery is based on reduction and oxidation reactions or redox reaction. A redox reaction is a transformation of matter at the atomic level by electron transfer from one species to another [3]. A molecule is oxidized when it loses electrons and reduced when it gains electrons.
During reduction an oxidant takes electrons from another substance and becomes reduced:
ܱݔ݅݀ܽ݊ݐ + ݁ି → ܲݎ݀ݑܿݐ (1) During oxidation a reductant gives electrons to another substance and becomes oxidized:
ܴ݁݀ݑܿݐܽ݊ݐ → ܲݎ݀ݑܿݐ + ݁ି (2)
2.4
Molality and molarity
The molality is the number of moles of a solute dissolved in one kilogram of solvent and the molarity (or molar concentration) is the number of moles of a solute dissolved in one liter of solution [3]. The molality mB is defined as:
݉ = ݊݊
ܯ ݈݉
݇݃ ൨ (3) Where: nA = number of mole of the solvent A [-]
NB = number of mole of solute B [-]
MA = molar mass of A [kg/mol]
The molar fraction is xb is defined as:
ݔ =݊ ݊
+ ݊ ሾ−ሿ (4) The molarity cB is defined as the ratio of the number of the mole nB to the volume of the
solution V:
33
2.5
Chemical equilibrium
The chemical equilibrium describes the state where are no net changes in any of the reactants or products concentrations [3]:
ܽܣ + ܾܤ ↔ ܿܥ + ݀ܦ (6) where A and B are the reactants, C and D the products, a, b, c and d are stoichiometric factors which are introduced to maintain the composition of the reaction mixture since matter cannot be created or destroyed in a chemical reaction. The chemical equilibrium is met when the velocities of the reactions aA+bB and cC+dD are equal. The velocity is a function of the activities ai of the reacting substances being raised to a power equal to the number of moles of each
reacting substance. The equilibrium constant K is then defined as:
ܭ =ܽܽܽௗ
ܽ ሾ−ሿ (7) The activity ai is a sort of effective molar fraction and is given by:
ܽ = ߛݔ ሾ−ሿ (8) where γi is the activity coefficient that is used to account for the effect of ionic strength on the
chemical reaction [3]. In very dilute solutions the activity coefficient tends to one.
While working with dilute solutions scales of molality or of molarity are used to define the activity. In the molarity scale the activity ai is defined as:
ܽ = ߛܿܿ∘ ሾ−ሿ (9) Where: γic = activity coefficient of the species i in the molarity scale [-]
c∘ = standard molarity (=1M) [mol/l]
Now the chemical equilibrium can be rewritten as:
ܭ =ܽܽܽௗ ܽ = (ߛ)(ߛ )ௗ (ߛ)(ߛ)∙ܿ ܿ ௗ ܿܿ ሾ−ሿ (10)
34 All concentration terms in the latter equation are expressed as ratios of the molality or molarity to a standard value, in this case to the standard molarity c∘, so the chemical equilibrium constant do not posses units.
2.6
Gibbs free energy and Nernst equation
The cell potential or electromotive force (EMF) can be defined as:
ܧ= ∆ܸ = ܧ௧− ܧ௧ ሾܸሿ (11) where Eright refers to the half-cell which is being reduced (reduction on the right) and Eleft to the
half-cell which is being oxidized. It is not possible to measure individual half-cell potentials, but it is possible to measure a half-cell potential in relation to the potentials of other half-cells.
Table 2 Standard reduction potentials
oxidant (electron acceptor) reductant (electron donor) E° [V] Na⁺ Na(s) -2.710 Zn²⁺ Zn(s) -0.760 Fe²⁺ Fe(s) -0.440 Cd²⁺ Cd(s) -0.400 Pb²⁺ Pb(s) -0.126 2 H⁺ H₂(g) 0.000
AgCl(s) Ag(s) + Cl⁻ (aq) 0.222
Hg₂Cl₂(s) 2Cl⁻ (aq) + 2Hg(l) 0.268 Cu²⁺ Cu(s) 0.337 I₂(s) 2 I⁻ 0.535 Fe³⁺ Fe²⁺ 0.771 Ag⁺ Ag(s) 0.799 O₂(g) + 4H⁺ 2 H₂O(l) 1.230 Cl₂(g) 2 Cl⁻ 1.360
35 In Table 2 are shown potentials of different electrodes measured in relation to the hydrogen half-cell, a half-cell whose potential is arbitrarily defined as zero [4]. Standard reduction potentials are denoted by the symbol E°. The standard free energy change expresses the tendency for any kind of process to occur under the conditions of constant temperature and pressure. The free energy change and the potential difference between the electrodes of a cell are related as follows:
∆ܩ° = −݊ܨܧ° ݈݉൨ (12)ܬ where n is the number of electrons and F is the Faraday constant.
The value ΔG° expresses the maximum useful work that a system can do on the surroundings. The negative sign indicates that a positive cell potential implies a negative free energy change and the cell reaction will spontaneously proceed to the right.
This refers to cells in which all dissolved substances are at unit activity, which means an effective concentration of 1 M. It can be predicted how the cell potential will change if the concentrations have other values. The equation (12) can be rewritten as:
∆ܩ = −݊ܨܧ ݈݉൨ (13)ܬ The American physicist, chemist and mathematician Willard Gibbs has stated that the maximal amount of energy that can be extracted from a chemical reaction is given by the available energy [3]. This available energy is called the Gibbs free energy. The thermodynamics state that for a chemical equilibrium the Gibbs free energy ΔG is a sum of a constant term ΔG°, which represents the free energy change for a reaction when the activity of each product and reactant is unity, and a variable term that is a function of the temperature and the equilibrium constant K:
∆ܩ = ∆ܩ° + ܴܶ ln ܭ ݈݉൨ (14)ܬ where R is the gas constant and T the temperature.
36 −݊ܨܧ = −݊ܨܧ° + ܴܶ ln ܭ ݈݉൨ (15)ܬ which can be rearranged into the Nernst equation:
ܧ = ܧ° −ܴܶ݊ܨ ln ܭ ሾܸሿ (16) It can be also written in base-10 log form for 25 °C:
ܧ = ܧ° −0.59݊ logଵܭ ሾܸሿ (17) The Nernst equation tells that a half-cell potential will change by 59 mV per 10-fold change in the concentration of a substance involved in an one-electron oxidation or reduction, for two-electron processes the change will be 28 mV per 10-fold change in the concentration.
Introducing the equation for the chemical equilibrium (10) into the Nernst equation gives:
ܧ = ܧ° −ܴܶ݊ܨ ln ቈ(ߛ(ߛ)(ߛ)ௗ )(ߛ)∙
ܿܿௗ ܿܿ
ሾܸሿ (18) Since the activities ai and the activity coefficients γi cannot be directly measured the formal
redox potential E°’ is introduced, which is a measured potential and depends on experimental conditions [3]: ܧ°ᇱ= ܧ° +ܴܶ ݊ܨ ln ቈ(ߛ )(ߛ )ௗ (ߛ)(ߛ) ሾܸሿ (19) Using the equation for the formal redox potential the Nernst equation becomes:
ܧ = ܧ°ᇱ−ܴܶ ݊ܨ ln ቈܿ ܿ ௗ ܿܿ ሾܸሿ (20) The Nernst equation is not accurate for solutions in which the total ionic concentration exceeds about 10-3 M. In more concentrated solutions the number of ions that are free to accept or donate electrons at an electrode is reduced due to forming loosely-bound ion pairs.
37
3
Flow batteries
3.1
History of flow batteries
The first flow battery was invented by the French scientist Charles Renard in 1884 [2]. It used zinc and chlorine as the reactive elements and was used for an electric motor to drive the propeller on a war airship.
This invention was forgotten for many years and it was revived by the German scientist Walter Kango in 1954. His procedure was based on a solution of titanium-chlorine and hydrochloric acid.
Other researches were undertaken by the NASA in the 1970’s. Their goal was to find a way to store solar energy using a flow battery based on the chemical reaction between iron and chromium.
Other flow batteries, such as the uranium, the zinc bromine redox flow battery and the polysulfide bromide flow battery were developed by different researchers and commercial enterprises, but the early developed flow batteries had many limitations.
The flow batteries used hazardous chemicals, operated at high temperature and under high pressure, different types of electrolytes were used in the negative and positive half-cell so a membrane failure or a small amount of molecular transfer that inevitably occurs through the membrane could cause mixing of the electrolytes thus cross-contaminating them after few charge and discharge cycles.
The vanadium redox flow battery, invented at the University of New South Wales in 1984, uses the same species in the electrolyte in both parts of the cell thus avoiding cross-contamination of the electrolyte.
3.2
Structure of a flow battery
A flow battery is an electrochemical device that converts the chemical energy in the electro-active materials directly to electrical energy [1]. Typically, a flow cell consists of two parallel electrodes separated by an ion exchange membrane, forming two electrolyte flow compartments or two half-cells as shown in Figure 12. A separate electrolyte solution, containing electro-active materials, circulates through each compartment from an independent
38 electrolytic circuit. The electro-active materials are mostly stored externally in an electrolyte and are introduced into the device only during operation. Systems in which all the electro-active materials are dissolved in a liquid electrolyte are called redox flow batteries. Other flow batteries might have a gas species (e.g. hydrogen, chlorine) and liquid species (e.g. bromine). Systems in which one or more electro-active components are stored internally are called hybrid flow batteries.
One electrolyte solution is storing the electro-active materials for the negative electrode reactions and the other for the positive electrode reactions. During discharge the negative electrode is the anode and the positive electrode is the cathode. During charge it is reversed. The electrodes do not contain active materials so they do not undergo physical and chemical changes during operation.
An ion exchange membrane is often used to prevent mixing or cross-over of the electro-active species which can result in chemical short-circuit of electro-active materials. Only the common counter ion carrier is allowed to cross the membrane.
In the next sections are different types of flow batteries explained more in detail.
3.3
Vanadium flow batteries
Vanadium redox batteries (VRB) are based on the four possible oxidation states of vanadium combined in the two electrode reactions:
ܸଶା↔ ܸଷା+ ݁ି (21) ܸହା+ ݁ି ↔ ܸସା (22) The left side shows the charged state and the right side the discharged state. During discharge, electrons are removed from the anolyte and transferred through the external circuit to the catholyte. The oxidant V5+ takes an electron from the reductant V2+. During charge, the flow of electrons is reversed and the reduction takes place in the anolyte and the oxidation in the catholyte. The redox reactions during charge and discharge are shown in Figure 17.
39 Figure 17 Redox reactions during charge and discharge in a vanadium redox battery In reality, the vanadium ions V4+ and V5+ are in fact vanadium oxides, VO2+ and VO2+. Therefore,
the cathodic reaction is rewritten and water molecules H2O and protons H+ are introduced [3]:
ܸܱଶା+ 2ܪା+ ݁ି ↔ ܸܱଶା+ ܪଶܱ (23) The anodic reaction stays as in equation (21) because water molecules and protons do not take part in the electrochemical reaction. Combining equations (21) and (23) into one equation gives:
ܸଶା+ ܸܱଶା+ 2ܪା ↔ ܸܱଶା+ ܸଷା+ ܪଶܱ (24) At the totally discharged state the anolyte and catholyte solutions contain only V3+ and VO2+ ions respectively. During charge, the concentrations of V2+ ions increases in the anolyte and the V3+ concentration decreases at the same rate. In the catholyte, the concentration of VO2+ ions
increases and the VO2+ concentration decreases at the same rate as the anodic reaction.
3.3.1 Application of the Nernst equation
Applying the Nernst equation (18) to the VRB reactions described with equations (21) and (23) gives:
40 ܧ = ܧ° −ோ்ிln ቈఊೇೀమశఊೇమశఊಹశమ
ఊೇయశఊೇೀమశ ∙
ೇೀమశೇమశಹశమ
ೇయశೇೀమశ ሾܸሿ (25) Using the formal redox potential E°’ and the number of electrons equal to one, the equation (25) becomes: ܧ = ܧ°ᇱ−ܴܶ ݊ܨ ln ൭ ܿைమశܿுଶశ ܿைమశ ൱ ௧௬௧ ൬ܿܿమశ యశ൰௬௧ ሾܸሿ (26) When the formal redox potential, which is an experimental value, is not available, the standard potential E° can be used instead if the effect of the activity coefficients γi is neglected. The
product/ratio of the activity coefficients γi in equation (25) can be set equal to 1 by assuming
that the values of the γi cancel each other approximately [3]. Equation (25) becomes:
ܧ = ܧ° −ܴܶ݊ܨ ln ൭ܿைమశܿுଶశ ܿைమశ ൱ ௧௬௧ ൬ܿܿమశ యశ൰௬௧ ሾܸሿ (27) 3.3.2 Standard potential
The standard potential E° expresses the reaction potential at standard conditions which are: vanadium species at a concentration of 1 M, all activity coefficients γi equal to one and a
temperature of 25 °C. It can be determined with two methods, from the thermodynamic characteristics of the elements involved in the VRB reactions and from the combination of the standard reduction potentials of the two half-cell reactions.
3.3.2.1 From the thermodynamic characteristics
This method is based on the Gibbs free energy ΔG:
∆ܩ = ∆ܪ − ܶ∆ܵ ݈݉൨ (28)ܬ
Where: ΔH = change in enthalpy [J/mol]
41 The change of free energy that accompanies the formation of 1 M of a substance from its component elements to their standard states (25 °C, 100 kPa and 1 M) is represented by the standard Gibbs free enthalpy of reaction ΔG°:
∆ܩ° = ∆ܪ°− ܶ∆ܵ° ݈݉൨ (29)݇ܬ where the standard reaction enthalpy ΔH°r is the difference of molar formation enthalpies
between the products ΔH°f,product and the reagents ΔH°f,reagent:
∆ܪ°= ∆ܪ°,ௗ௨௧ ௗ௨௧௦
− ∆ܪ°,௧ ௧௦
݈݉൨ (30)݇ܬ and the standard reaction entropy ΔS°r is the difference of molar formation entropies between
the products S°f,product and the reagents S°f,reagent:
∆ܵ°= ܵ°,ௗ௨௧ ௗ௨௧௦
− ܵ°,௧ ௧௦
ܭ ∙ ݈݉൨ (31)ܬ In table 3 is shown the thermodynamic data for the vanadium compounds which can be introduced into equations (30) and (31).
Table 3 Thermodynamic data for vanadium compounds at 298.15K. Values in parentheses are estimated [3] Formula State ΔHf° [kJ/mol] ΔGf° [kJ/mol] Sf° [J/mol·K] V²⁺ aq (-226) -218 (-130) V³⁺ aq (-259) -251.3 (-230) VO²⁺ aq -486.6 -446.4 -133.9 VO₂⁺ aq -649.8 -587 -42.3 H₂O aq -285.8 -237.2 69.9 H⁺ aq 0 0 0
42 Introducing the thermodynamic data into equation (30) for the standard reaction enthalpy ΔH°r
gives:
∆ܪ°= ∆ܪ°,ைమశ + ∆ܪ°,యశ + ∆ܪ°,ுమை− ∆ܪ°,మశ− ∆ܪ°,ைమశ− 2∆ܪ°,ுశ = −155.6݈݉ (32)݇ܬ Similarly, equation (31) for the standard reaction entropy ΔS°r becomes:
∆ܵ° = ܵ°,ைమశ+ ܵ°,యశ + ܵ°,ுమை− ܵ°,మశ− ܵ°,ைమశ− 2ܵ°,ுశ = −121.7ܭ ∙ ݈݉ (33)ܬ Rewriting equation (12) and combining it with equation (29) gives:
ܧ° = −∆ܩ°݊ܨ = −∆ܪ°− ܶ∆ܵ°݊ܨ ሾܸሿ (34) Now the standard potential E° can be calculated and is 1.23 V at 25 °C.
The standard potential E° dependence on temperature can be determined from equation (34):
߲ܧ°
߲ܶ = −݊ܨ ൬1 ߲∆ܩ°߲ܶ ൰ ≅∆ܵ°݊ܨ = −1.26 ܸ݉ܭ ൨ (35)
Figure 18 Standard potential as a function of temperature
1.14 1.16 1.18 1.2 1.22 1.24 1.26 10 20 30 40 50 60 70 80 S ta n d a rd p o te n ti a l [V ] Temperature [°C]
43 Figure 18 shows the change of the standard potential according to temperature. It drops 1.26 mV/K. However, experiments have shown that the negative slope is slightly higher than the theoretical value of -1.26 mV/K and is -1.62 mV/K between 5 °C and 50 °C [3].
3.3.2.2 From the standard reduction potentials
As mentioned in 2.6 the potential difference of a cell can be calculated by adding the reduction potential of the reduction half-cell to the negative of the reduction potential (oxidation potential) of the oxidation half-cell. The standard reduction potentials for the vanadium species are shown in a potential diagram in Figure 19. The values are in V. Hence, the two electrode potentials E°anode and E°cathode are as follows:
ܸଷା+ ݁ି ↔ ܸଶା ܧ°
ௗ = −0.255 ܸ (36) ܸܱଶା + 2ܪା+ ݁ି ↔ ܸܱଶା+ ܪଶܱ ܧ°௧ௗ = 1.000 ܸ (37) Thus, the standard potential is:
ܧ° = ܧ°௧ௗ − ܧ°ௗ = 1.255 ܸ (38)
Figure 19 Potential diagram for the vanadium species in strongly acidic solutions [2] This method is only valid for a given temperature, in this case 25 °C. However, both methods give a similar result in this case.
3.3.3 Full ionic equations
The above mentioned equations (21), (23) and (24) do not reflect exactly the phenomena happening in the cells. The full ionic equations contain also protons H+ and sulfate ions SO4
44 important to respect the law of conservation of mass and the charge balance in both electrolytes. Table 4 shows the salts corresponding to the vanadium species.
Table 4 Vanadium ions with their corresponding salt, battery state and electrolyte where they are dissolved
Species Salt Battery state
Electrolyte
V²⁺ VSO₄ Charged Anolyte
V³⁺ 0.5 V₂(SO₄)₃ Discharged Anolyte
VO²⁺ VOSO₄ Discharged Catholyte
VO₂⁺ 0.5(VO₂)₂SO₄ Charged Catholyte
The full anodic equation with the corresponding salts and sulfuric acid H2SO4 is as follows:
ܸଷା+ ݁ି ≡ 0.5ܸଶ(ܱܵସ)ଷ+ ܽܪଶܱܵସ+ ݁ି ≡ (ܸଷା+ (1.5 + ܽ)ܱܵ
ସଶି+ 2ܽܪା+ ݁ି) ↓ ܥܪܣܴܩܧ
ܸଶା≡ ܸܱܵସ+ ܾܪଶܱܵସ ≡ ܸଶା+ (1 + ܾ)ܱܵସଶି+ 2ܾܪା (39) According to the law of conservation of mass the quantity of sulfate SO42- must remain
constant, therefore:
ܾ = 0.5 + ܽ (40) The full cathodic equation is:
ܸܱଶା+ ܪଶܱ ≡ ܸܱܱܵସ+ ܿܪଶܱܵସ+ ܪଶܱ ≡ ܸܱଶା+ (1 + ܿ)ܱܵସଶି+ 2ܿܪା+ ܪଶܱ ↓ ܥܪܣܴܩܧ
ܸܱଶା+ 2ܪା+ ݁ି ≡ 0.5(ܸܱଶ)ଶܱܵସ+ ݀ܪଶܱܵସ+ ܪା+ ݁ି ≡ ܸܱଶା+ (0.5 + ݀)ܱܵସଶି+ 2݀ܪା+ ܪା + ݁ି (41) Sulfate SO42- must remain constant, therefore:
45 ݀ = 0.5 + ܿ (42) To maintain the charge balance undesirable protons H+ have to be removed. The dissociation of water molecules H2O during the oxidation of 1 M of VO2+ produces 2 M of protons. One is
necessary to maintain the charge balance in the catholyte and the other one to equilibrate the charge balance in the anolyte. Therefore, 1 M of H+ has to cross the membrane to equilibrate both electrolytes.
Figure 20 shows the full ionic equations of the VRB during the charge cycle.
Figure 20 The full ionic equations of the VRB during the charge cycle 3.3.4 State of charge
The state of charge (SOC) indicates the amount of stored energy relative to the total energy storage capacity of the battery. Its value is given by the concentrations of the vanadium species and varies from 0 (fully discharged) to 1 (fully charged):
ܱܵܥ = ൬ܿ ܿమశ
మశ+ܿయశ൰ = ቆ
ܿைమశ
ܿைమశ+ ܿைమశቇ ሾ−ሿ (43) If the total vanadium concentration cVtotal is the same in both electrolytes:
ܿయశ = ܿೌ − ܿమశ, ܿைమశ = ܿೌ − ܿைమశ ݈݉
݈ ൨ (44) the SOC equation can be rewritten as:
46 SOC = ቆccమశ
౪౪ౢቇ = ቆ cమశ
c౪౪ౢቇ ሾ−ሿ (45) 3.3.5 Concentration of vanadium ions and protons
During the redox reactions, the vanadium ions are transformed and that some H+ protons are either produced or consumed. Therefore, the ion concentrations change in the electrolyte depending on how the battery is operated. During charge, V2+ and VO2+ ions are produced thus
their concentrations increase, while V3+ and VO2+ ions are consumed thus their concentrations decrease. It is reversed during discharge. Furthermore, an electron is involved each time a redox reaction occurs and the concentration changes are proportional to the reaction rate. Thus, the concentration changes are also proportional to the electrical current [3]:
ܳ = ݊ష݁ = න ݅(ݐ)݀ݐ ሾܥሿ (46)
where: Qc = charge [C]
i = current [A]
t = time [s]
ne- = number of electrons and [-]
e = elementary charge [C]
The number of electrons ne- involved for a given current is (the current is positive during
discharge):
݊ష = 1
݁ܰන ݅(ݐ)݀ݐ ሾ݈݉ሿ (47) where NA is the Avogadro number. Then the definition of a molar flow rate of electrons Ne- is:
ܰష(ݐ) = 1
݁ܰ݅(ݐ) ݈݉
47 An electron is released by the oxidation of a vanadium ion, travels through the electrodes and is captured by the reduction of another vanadium ion in the opposite half-cell. In a stack composed of Ncell cells, the electrons travel through the bipolar electrode to the adjacent cell as
shown in Figure 21. For one electron flowing through the external circuit Ncell redox reactions
have occurred thus the total molar flow rate of electrons Ne-tot for a stack is obtained by
multiplying equation (48) by the number of cells:
ܰష (ݐ) = ே ேಲ ݅(ݐ) = ே ி ݅(ݐ) ቂ ݈݉ ௦ ቃ (49)
Figure 21 A 3 element stack with corresponding redox reactions to produce one electron flow The concentrations of vanadium ions are different in the tank and the cell thus the concentrations are separated into: the tank concentration ctank, the concentration at the cell
input cin, the concentration inside the cell ccell and the concentration at the cell output cout [3].
The tank concentration ctank and the cell input concentration cin are considered the same
because the size of the tank is large compared to the electrolyte flow rate thus the change in concentrations due to the flow of used electrolyte is small. The tank concentration ctank is
proportional to the quantity of vanadium transformed in the stack which corresponds to the quantity of electrons involved in the reaction. It depends on the initial ion concentrations ctankiinitial, the size of the tank Vtank and the molar flow rate of electrons Ne-tot:
48 ܿ(ݐ) = ܿ௧(ݐ) = ܿ௧௧+ܸ1
௧න ܾ ܰష (ݐ)݀ݐ ݈݉
݈ ൨ (50) where b is a sign factor equal to -1 for V2+ and V5+ ions and 1 for V3+ and V4+ ions [2].
The output concentration cout depends on the electrolyte flow rate Q, the length of the
electrolyte circuit and on the current i that the electrolyte encounters during the cell crossing. It is assumed that the model has no memory and reacts instantly to a change in the operating conditions thus the output concentration cout is given by:
ܿ௨௧(ݐ) = ܿ(ݐ) + ܾܰ ష (ݐ)
ܳ(ݐ) ݈݈݉ ൨ (51) The concentration inside a cell ccell is not uniformly distributed so an approximation is made:
ܿ(ݐ) =
ܿ(ݐ) + ܿ௨௧(ݐ)
2 ݈݈݉ ൨ (52) The proton concentration in the catholyte is derived from the relation between the H+ and V4+ quantities since H+ increases by 1 M when 1 M of V4+ is oxidized. During discharge, the H+ concentration is set by the quantity of sulfuric acid dissolved in the electrolyte thus the H+ concentration cH+,discharged,catholyte is known. Now the H+ concentration in the catholyte cH+,catholyte
at any state of charge is [3]:
ܿுశ,௧௬௧ = ܿுశ,ௗ௦ௗ,௧௬௧+ ܿைమశ ሾܯሿ (53) 3.3.6 Cost of a VRB
The total cost of a VRB depends on the capital cost and the operating and maintenance (O&M) cost. The capital cost is the cost needed to construct or purchase storage equipment, it is also called the investment cost. The principle of the capital cost is shown in Figure 22.
The costs for stack, pumps and control are defined by the power of the redox flow battery and the electrolyte costs are strongly related to the raw material costs. Generally, the capital cost depends on the maximum power output and the energy storage capability of the flow battery.
49 Figure 22 Costs of redox flow batteries
Table 5 shows estimated VRB costs for three sample applications including three production scenarios: a prototype plant, a “first of a kind” (FOAK) commercial plant and an “nth of a kind” (NOAK) plant at mature production levels [6]. It can be seen how the total capital cost increases due to the increase of power and energy.
Table 5 VRB plant capital and O&M cost
Application Size Plant capacity Capital cost - power related ($/kW) Capital cost - energy related ($/kWh) Total capital cost ($) O&M cost - fixed ($/kW year) O&M cost - variable ($/kWh) Peak shaving Prototype 1 MW 4 MWh 2260 550 4.5 M 1.2 0.029 FOAK 700 230 1.6 M 0.4 0.029 NOAK 500 150 1.1 M 0.2 0.029 Spinning reserve Prototype 10 MW 20 MWh 2150 1050 42.5 M 1.2 0.029 C o st Energy content
Costs for electrolyte and tanks
Costs for stack, pumps and control Total costs
Costs of a

![Figure 9 Components of a flywheel [6]](https://thumb-eu.123doks.com/thumbv2/5dokorg/4697799.123394/22.918.256.661.389.678/figure-components-of-a-flywheel.webp)
![Figure 10 Compressed air energy storage concept [6]](https://thumb-eu.123doks.com/thumbv2/5dokorg/4697799.123394/23.918.134.787.283.703/figure-compressed-air-energy-storage-concept.webp)
![Figure 12 Schema of a flow battery [6]](https://thumb-eu.123doks.com/thumbv2/5dokorg/4697799.123394/26.918.196.718.625.1002/figure-schema-flow-battery.webp)
![Figure 14 Efficiency and lifetime comparison [3]](https://thumb-eu.123doks.com/thumbv2/5dokorg/4697799.123394/28.918.209.713.110.525/figure-efficiency-and-lifetime-comparison.webp)
