Va
A This to as valu eval achi envi walk envi show tradi stan invo K J Cent SE-1 Swe wwwaluing pe
Abstract s study uses a ssess how va uation of wal luating polici ieved, indica ironment in t k time in diff ironment for wing that resitionally use ndard CBA. A
olved in acce
Keywords: in
JEL Codes: D
tre for Tra 100 44 Sto eden w.cts.kth.s
erceived
Maria Börje a stated choi arious securit lking time wh ies to improv ating that thethe welfare a ferent physic r women than sults by socia d in transpor A contributio essing the pub
nsecurity, wa D61, R41, R4 ansport Stu ockholm se
insecurit
to pu
esson – Roya CTS Wor ice experime ty-promoting hen accessin ve perceived method is pr analysis. The cal environm n for men. Th al sciences ca rt and welfar on of this stu blic transporalk time weig
42, C25, J22 udies
ty associ
ublic tran
al Institute o rking Papeent and drawi g factors in th ng public tran d security are romising for e results indic ments and it is his paper the an be verifie re analysis an udy is the insi rt system is a ght, value of 2
iated with
sport
of Technolo r 2012:9 ings of four d he built phys nsport. Valua e obtained. C r incorporatin cate a system s more depen ereby contrib d using meth nd may there ight that the a welfare loss walk time, ph use of a
ogy (KTH) different type sical environ ations that ca onsistent res ng aspects in matic variatio ndent of the p butes to the lihods and theo efore be incor perception o s that can be public transpo
and acce
e-environme nment influen an be applied sults are n the physica on in value o physical iterature by ories rporated in of insecurity e quantified. ortss
ents nce d for l f1
INTRODUCTION
In this paper we use stated choice to elicit the valuation of various security-promoting factors in the built physical environment when accessing and using public transport. The relative valuations of in-vehicle travel time, walk time and wait time associated with public transport use are estimated by applying an experimental setting in which the access walk takes place in one of four type-walk-environments.
A high quality transport that is safe and secure is the first (of seven) policy objectives mentioned in the European Commission’s Communication on the Future of Transport (European Commission, 2009. Authorities in many countries in Europe and in North America have also integrated women's concerns about insecurity in their transport policy. For instance, the Swedish transport policy states that the transport system should strive to become more secure, contribute to a gender-equal society and stimulate public transport use and walking (Ministry of Enterprise, Energy and Communications, 2009) and Transport for London produced its first Women’s Action Plan in 2004, stating their wish to provide a public transport system that meets women’s needs in terms of greater personal security, flexibility, accessibility and affordability.
A key factor for perceived and real personal security is the design of the physical environment. Nevertheless, investments aimed at improving traveller’s perceived security are seldom evaluated by using standard cost benefit analysis (CBA). Ortúzar and Willumsen (2001) point out the importance of elucidate valuations of perceived security to be able to allocate recourses to improve it efficiently. To be able to include attributes such as perceived security in CBA, valuations must be identified empirically. This paper produces valuations of perceived insecurity implicitly in the value of time.
The value of time may pick up the value of insecurity because it comprises two components: the direct value of time and the value of time as a resource (de Serpa, 1971). The direct utility of travel time will usually vary between different travel conditions, depending on factors such as the travel mode, perceived pleasantness or insecurity of the travel environment, and the possibility to use the travel time productively. Specifically, the value of time will usually differ between travel components such as in-vehicle travel time, walk time and wait time associated with public transport. Wardman (2004) provides an overview of empirical research on relative valuations of public transport travel time components. He finds that empirical studies typically show that walk time is valued higher than in-vehicle time, presumably because it incurs a greater effort and because the travel time cannot easily be used productively. Wardman (2001) also notes that the value of time components can be expected to depend strongly on weather conditions, local environment and time of day, but that dependencies of this type are typically not isolated in empirical studies.
It has long been known that the built physical environment influences insecurity. Jacobs (1961) emphasized in here famous work in urban planning how the design of the built physical environment, including good sidewalks, public spaces and neighbourhood stores may help in protecting the inhabitants from crimes, partly by
2
creating public spaces providing by more ‘eyes on the street”. Specifically, several studies have found that some particular factors in the environment, such as darkness, isolation and desertion, increases the perceived insecurity among women more than men (Kelly, 1986; Warr, 1990; Wekerle and Whitzman, 1995; Valentine, 1990, Grönlund 2001; Grönlund 2009; Trench, S., Tiesdel, 1992; Koskela, 2000). For this reason the issue of perceived insecurity has become part of the field of gender research.
There is a large and established body of research dedicated to describe general differences in travel by gender (Rosenbloom, 2006). For instance, it is found that females use public transport more often than males and use an automobile less (Best and Lanzendorf, 2005; Polk 2004). Specifically, a number of studies have found that security concerns may prevent women from using the existing transit services or to take detours when accessing transit services (Lynch and Atkins, 1998; Reed et al. 2000, Department for Transport, 2002; Envall (2007)). Also in the Swedish context there are several empirical studies showing that women feel more insecure than men when accessing public transport. Johansson and Wettermark (2003) found that 50 percent of the women feel occasionally feel insecure when using public transport. In a study interviewing 8000 Swedes, 27 percent of the women stated that they feel insecure when walking alone after dark in their neighbourhood (Brottsförebyggande rådet, 2008).
Women’s security while travelling was a major topic at the Conference on Research on Women’s Issues in Transportation in Chicago 2004 (summarised in Rosenbloom (2006)). At the conference the key issue identified for future research was preference and behavioural differences between women and men, improving the possibilities to evaluate transport policies and urban planning from a gender perspective. Key research topics raised by keynote speaker Susan Handy was “How do the personal security concerns of women differ from those of men when it comes to using transit?” and “What kinds of technologies are being used to increase transit safety and to what degree do these technologies address the safety concerns of women?” The present paper addresses these key questions.
Despite the substantial body of literature showing that insecurity affects people, indicating that it causes substantial welfare losses, there is only one previous study, reported in Ortúzar (2007) and Sillano et al. (2006), deriving willingness to pay for insecurity and thereby providing the opportunity to include perceived insecurity in welfare calculations. Ortúzar (2007) uses stated choice to estimating the willingness to pay for factors in the built physical environment that improve the perceived security for residents walking through poor neighbourhoods. The results were mostly consistent with prior expectations. Respondents were willing to pay a higher rent if their house was located in an area with walking path environments associated with higher maintenance levels, surrounding buildings with windows, presence of other pedestrians and corner shops. Some of the results, however, were not consistent with expectations. Ortúzar and Willumsen (2001) also note that the problem of using revealed preference data for valuing factors like perceived insecurity is that the observed behaviour may be dominated by a few factors.
In the present study, we use a method resembling the one used by Ortúzar (2007) to derive the willingness to pay for perceived security, but in the specific context of
3
accessing public transport. A binary stated choice experiment was designed and administered to public transport travellers, comprising choices between alternatives differing in three dimensions: walk time to access the station, headway and in-vehicle time. The physical environment of the walk to access the station was presented to the respondents by coloured drawings and varied between different choice situations. The physical environments were distinguished by factors that typically are found to influence the feeling of insecurity. The a priori expectation would be that the perceived insecurity implied by the different walking environments affects the direct disutility of the walk time. The experiment therefore allows us to implicitly estimate how the direct disutility of walking time depends on the physical environment.
The findings suggest that the method is consistent and thereby promising for incorporating aspects in the physical environment in the welfare analysis. The results indicate a systematic variation in value of walk time in different physical environments and it is more dependent of the physical environment for women than for men. The results are thus consistent with results from social sciences, discussed above. This paper thereby contributes to the literature by showing that the attributes and concepts that social sciences have found important can be valued using methods and theories traditionally used in transport and welfare analysis and may therefore be incorporated in traditional CBA. For this reason the study may help in bridging the gap between these fields of research.
New policy implications emerge from this study. The results show that women’s discomfort associated with accessing public transport in some physical environments, because of perceived insecurity, generates a welfare loss. The perceived discomfort may, however, often be reduced by reasonably cost efficient methods, thereby generating a net gain in welfare. It is unlikely that the present type of valuations will be used in traditional CBAs on a regular basis, because CBAs are rarely used in urban planning. The results may still be important for, and have an impact on, urban planning in signalling that diminishing the perceived insecurity of the physical environment can often be defended from a cost-benefit perspective.
The model is specified in section 2. Section 3 describes the data and the experimental design. In section 4, the estimation results are reported. Section 5 adds a discussion on the application of the results and section 6 concludes.
2
THEORY
2.1 Factors influencing perception of insecurity
Ortúzar and Willumsen (2001) discuss how to define qualitative attributes, such as insecurity, in stated choice experiments. They argue that it is more precise to describe facilities affecting the perceived security, rather than describing environments as more or less secure. For this reason, the present study will explore how the value of walk time is affected by the characteristics of different type-environments. Since the study explicitly aims at valuing security-promoting factors, and not security alone, the respondents were intentionally not asked to think about whether they would be more or less secure in the different type-environments, to avoid over-focus on insecurity.
4
Earlier research in social science provides a basic understanding of the type of factors in the physical environment that generally improve the perceived security. Several studies have found that darkness, isolation and desertion have a negative impact on the perceived security (Kelly, 1986; Warr, 1990; Wekerle and Whitzman, 1995; Valentine, 1990; Grönlund, 2001; Grönlund, 2009; Koskela, 2000; Trench, S., Tiesdel, 1992). To be more precise such factors are:
• A mix of different functions, e.g. housing and services • A mix of socio-economic groups
• A well-integrated transport system, for instance enabling walkers to be seen by drivers, and enabling secure transfers between bus or train lines.
• Long sight lines along pavements (no ill-placed bushes) • Walkways visible from nearby buildings
• No confined spaces to entrances and courtyards • No poor light conditions
The above listed factors all improve the chance of being seen, of seeing and of
escaping, which thus seem to be key factors for high perceived security. These factors
also resemble the attributes found in focus interviews carried out by Ortúzar (2007). All type-environments used in the experiment were constructed based on the list above and were presented to respondents as drawings rather than photographs, to give the impression of type-environments with different characteristics linked to perceived insecurity. If photographs had been used, the experiment would instead have generated the valuation of the particular environment in the photograph. Ortúzar (2007) used a similar method to ensure that the type-environments would not be associated with negative or positive variables not linked to perceived insecurity, such as noise, which might contaminate real environments. Type-environments also allow the attributes to be clearly perceived.
2.2 Model specification
Assume that we have binary choices between a left- and a right-hand side alternative differing in three dimensions: in-vehicle time, walk time to access the station and headway. Assume further that the discomfort of walking through the environments differs between the binary choices, because respondents are asked to imagine that they would walk through one of the type-environments when making the choice. This experimental setting enables us to isolate the effect of the discomfort associated with the walking environment on the relative valuations of the three travel time components. Assume then that the difference between the left- and right-hand side alternatives in each the binary choice takes the form:
Δ = Δ + Δ + Δ + Δ
∆
TI ,∆
THi and∆
TWi denote the difference in the travel time components in-vehicle time, walk time and headway for type-environments = {0 − }.α
Ii,α
Hi andα
Wi denote the marginal disutility of each travel time component in type-environment i.denotes the extra marginal disutility for females, compared to males, of walking in environment i, capturing possible differences between males and females in this respect. As discussed in the introduction, it is evident from earlier literature that the
5
perception of insecurity is more strongly linked to physical environment for women than for men. It can therefore be expected that the valuation of walk time is linked more strongly to the security-promoting factors in the built physical environment for females.
Adding a iid standard logistic error term to Δ , a logit model results. The relative weight of walk time and headway with respect to in-vehicle travel time can then be computed as the ratio of marginal utility of walk time and headway and the marginal utility of in-vehicle travel time.
There is no reason to expect that valuation of in-vehicle time or headway depends on the walk environment. As the model is specified, however, all parameters are estimated for each specific environment, which is equivalent to estimating a separate model for each environment. If the results are consistent with expectations and if the response scale is independent of the environment, the parameters for in-vehicle time and headway should not differ between type-environments.
3
DATA COLLECTION
3.1 Survey method
The data originate from the Swedish value of time study 2008. A stated choice questionnaire was administered to travellers using local and regional buses and trains in October and November 2008. The recruitment was evenly distributed between weekdays and weekend and over time of day to capture a representative distribution of trip purposes. Only travellers above 18 years old, making private trips with in-vehicle travel time in excess of 10 minutes, were recruited. About 50 percent were recruited on local public transport and 50 percent on regional public transport. Local public transport travellers were recruited in the three Swedish cities Stockholm, Gothenburg and Malmö. Regional public transport travellers were recruited on the buses and trains operating between different towns or between suburbs and city centres.
When recruiting respondents on board, travellers were asked to report their address and telephone number. Respondent could choose to respond to the questionnaire by Internet or by a call-back telephone interview. All travellers agreeing to participate in the study received one lottery ticket. Respondents choosing to respond via the Internet received a letter containing information and instructions, login information and a brief travel diary with details of the current trip as a memory aid. Respondents declining to respond via the Internet but accepting a telephone interview received the same material, except for login details. Instead, telephone respondents received paper sheets to write down the characteristics of the alternatives in the stated choice experiment, which were read out over the telephone, in order to visualize the alternatives. All materials were printed in colour and contained the logos of the National Road and National Rail administrations.
Respondents choosing the Internet questionnaire were sent a postal reminder, if they did not respond within three days. If still not responding within another three days, they received a telephone reminder, or alternatively, the option to respond to the survey over the telephone. At least six attempts were made to reach each respondent by telephone and the response rate was finally 75 percent. However, approximately 10
6
percent already declined to participate in the survey at the recruitment, so effectively the response rate was approximately 65 percent. We also note that the vast majority, 83 percent of bus travellers and 89 percent of train travellers, responded to the survey over the Internet.
The questionnaire first listed some questions about the reference trip on which the respondent was recruited (travel time, start time, headway, access mode and access time etc.). This was followed a stated choice experiment including two alternatives differing in the dimensions travel cost and in-vehicle travel time. The respondents were asked to state which of the two alternatives they would prefer. They had also the option to respond that “both alternatives are equally good”. Then followed a second choice experiment comprising six binary choices between alternatives differing in three dimensions: in-vehicle travel time, headway and access time (on the access mode used on the reference trip). Half of the sample, selected randomly, received a third choice experiment aimed at investigating how the value of walk time is affected by various security-promoting factors in the built physical environment. This experiment is described in detail in the next subsection. The other half of the sample was faced with a third choice experiment involving an alternative main travel mode, and is not analysed in this paper.
In total, 1,802 individuals responded to 17,055 stated choice questions. 915 respondents were recruited on buses and 887 respondents were recruited on trains. 478 bus travellers and 456 train travellers responded to the questionnaire including the choice experiment attached to different type-environments.
In the data cleaning process, 7,689 observations were discarded from the total sample of 17,055. 767 observations were discarded because they had reported an in-vehicle time of less than 10 minutes or because vehicle time or the walking time in any of the alternatives in the stated choice experiment accidentally became zero. 5,693 observations from the reference experiment were discarded because the access mode was not walk.
Hence, final estimations sample contained 10 595 observations (5104 from the reference experiment, 1346 from environment 1, 1369 from environment 2, 1387 from environment 3, 1389 from environment 4) from 1,314 individuals (of which 919 responded to the insecurity experiment). For 1,229 observations the “both are equally good” alternative was chosen, equally distributed between the reference experiment and the four environments.
3.2 Characteristics of respondents and their trips
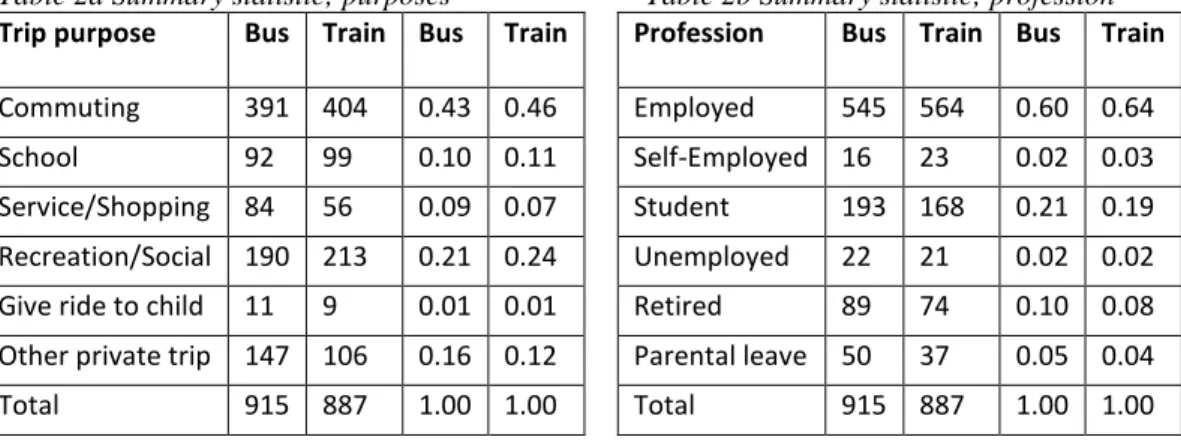
Table 1 summarizes the characteristics of the reference trip, in terms of in-vehicle time, access time and headway. 56 percent of the bus travellers accessed the bus by walking, 6 percent by bicycle, 5 percent by car and 32 percent by another public transport mode. Of the train travellers, 40 percent had walk as main access mode, 10 percent bicycle, 12 percent car and 38 percent another public transport mode. Table 2 summarizes the travel purpose and occupation of the trips and travellers. The share of women is 64 percent both among bus and train respondents.
7
Table 1: Summary statistics of reference trips of the final estimation sample.
Mode Bus Train
Min Max Mean Min Max Mean
In-vehicle time 10 120 38.57 10 120 40 Walk time time 2 135 14.09 1 180 12
Headway 5 64 38.22 5 64 39
Table 2a Summary statistic; purposes Table 2b Summary statistic; profession
Trip purpose Bus Train Bus Train Profession Bus Train Bus Train
Commuting 391 404 0.43 0.46 Employed 545 564 0.60 0.64 School 92 99 0.10 0.11 Self-Employed 16 23 0.02 0.03 Service/Shopping 84 56 0.09 0.07 Student 193 168 0.21 0.19 Recreation/Social 190 213 0.21 0.24 Unemployed 22 21 0.02 0.02 Give ride to child 11 9 0.01 0.01 Retired 89 74 0.10 0.08 Other private trip 147 106 0.16 0.12 Parental leave 50 37 0.05 0.04 Total 915 887 1.00 1.00 Total 915 887 1.00 1.00
The median age in the final estimation sample is 40 years, the first quartile is 27 years and the third quartile is 54 years.
3.3 Experimental Design
The second stated choice experiment related to the reference trip including in-vehicle travel time, headway and access time (but not in different environments), was built on a design comprising 96 rows for binary choices including three factors with five levels developed by de Jong et al. (2007). We refer to this choice experiment as the ‘reference experiment’. The factor levels of in-vehicle travel time, headway and walk time were generated as percentage changes from the corresponding travel time components in the reference trip. The five levels of each time component were the reference time, ±20 percent of reference time and ±30 percent of the reference time. The third stated choice experiment involving different type-environments was also related to the reference trip, but respondents were asked to imagine accessing the train station or bus stop by walking through one of four type-environments (even if they had used another main access mode for the reference trip). We refer to this choice experiment as the ‘insecurity experiment’. Type-environments were illustrated in coloured drawings. Different environments were attached to each of the choice situations (but the environment was always the same in the two alternatives within the same choice situation), and administered to the respondents on paper sheets.
The environments were designed using various inputs and previous experiences, mainly the list of security indicators shown in section 2 and the images developed in the study by Ortúzar (2007). An artist who previously had been involved in studies on perceived security of physical environments in public spaces (unpublished work by Nina Waara in collaboration with Bo Grönlund) was engaged to produce the
8
drawings. Several attempts were made to produce drawings that were found to be realistic but also perceived as more/less secure by men and women in focus groups. A pilot survey indicated different valuations of walk time in the different environments. The people appearing in the type-environments are sketchy, not revealing what they look like (some types of persons could have a negative effect on perceived security). From a policy perspective it is obviously easier to have an impact on the built physical environment than the appearance of the people in it. There are two persons walking in each environment and a third person on the balcony in the open environments. Hence, the number of persons remain similar between the environments (although open environments provide some extra “eyes” on the street from the surrounding buildings and from the road), to keep the influence on the walk time weight of the people as small as possible. If there are interaction effects between the presence of people and darkness, these would not be captured. The limited number of people in the environments could tend to increase the walk time weight. On the other hand, Sweden is a sparsely populated county, so the small number of people is by no means unrealistic or unusual.
Here follows a description of the type-environments, and they are shown in Figure 1 - Figure 4.
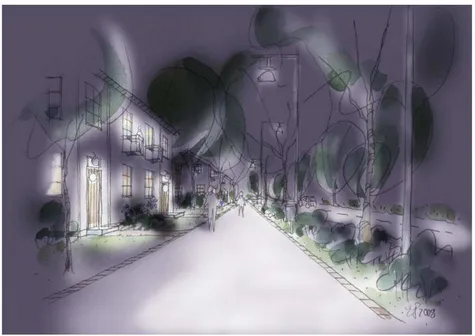
1. Type-environment 1: ‘open’ and in daylight.
The impression of openness of the first type-environment was created by doors, windows and balconies overlooking the street. Other people are visible on the footpath although they are few and sketchy and only visible at some distance.
There are no high bushes blocking the view over the road, making a walker on the footpath visible from passing vehicles. The picture gives the clear impression of an environment that provides several possibilities of escaping if an unforeseen threat should appear.
Figure 1: Type-environment 1.
9
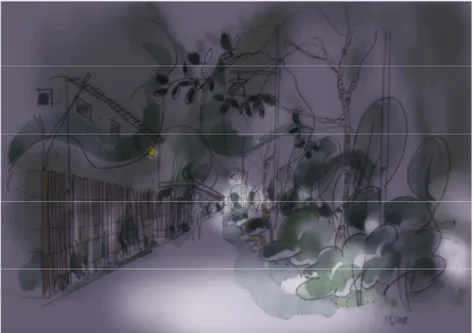
In this picture, there are no windows overlooking the footpath, but a high fence. There are high bushes effectively blocking the view over the nearby road and the chance of being seen by drivers on the road. The bushes and fence both reduce the possibilities of escaping.
Figure 2: Type-environment 2.
3. Type-environment 3: ‘open’ but dark (not in daylight).
The impression of openness of the first type-environment was created by use of the same factors as in Figure 1. In addition, there are streetlamps lightening up the footpaths.
Figure 3: Type-environment 3.
4. Type-environment 4: closed’ and dark.
The impression of closeness of the second type-environment was created by use of the same factors as in Figure 2. In addition, there are several streetlamps that are out of order, emphasizing the impression of darkness.
10
Figure 4: Type-environment 4.
Apart from the drawings, there were no descriptions of the different environments. Moreover, respondents were never explicitly asked to think about whether they would be more or less secure in any of the environments, avoiding unnecessary over-focus on the security issue. The instruction for the choice task was formulated as:
We now ask you to pick up the sheets with pictures describing different settings. Think of the walk to the bus stop where your journey began. If you did not walk to the bus, we ask you to imagine you walked there. We ask you now to make choices between different alternatives, similar to the previous choice task. When you make the following choices, imagine that you walk to the bus stop in one of the four environments described by the pictures. For each choice, you are told which picture to look at when making the choice.
For the insecurity experiment, an orthogonal pivot design comprising three factors (in-vehicle travel time, headway and walk time) and three levels was used. For the insecurity experiment, the base design includes thus only 9 rows which is considerably fewer than in the reference experiment. This is done to guarantee that interaction effects between the type-environments and walk time weight can be estimated, the number of rows in the base design must then be multiplied by the number of environments, resulting in 36 choices in the full choice set. In this sense there are actually 4 insecurity experiments, one for each of the four type-environments, although these are mostly denoted ‘the insecurity experiment’.
The differences between the left- and right-hand side alternatives were constructed using an orthogonal design table with nine rows and one column for each factor. The three levels of each factor difference are shown in Table 3. The same design was used for all four insecurity experiments. The attribute levels were set so as to maximize the standard error of the parameter estimates (on the condition that attribute levels were still realistic) under the assumption that the true parameters were known and that respondents behave exactly according to the MNL model specified in section 21. The
11
absolute level of each factor facing the respondents took many more levels, also determined by the absolute level of the factors in the left-hand side alternative.
Simulation was undertaken over a wide range of model specifications and parameter values, which also included the parameter values that were achieved in the pilot and the main study. This guarantees sufficient efficiency in parameter estimates and that the design retrieves underlying preferences for different model specifications.
The absolute levels of in-vehicle time and headway in the left-hand side alternative were determined by the reference trip of each respondent. The walking time in the left-hand side alternative was set to 15 minutes for all respondents, irrespective of access mode and access travel time in the reference trip. Each person responded to six choices in three different type-environments, and hence two choices in each environment
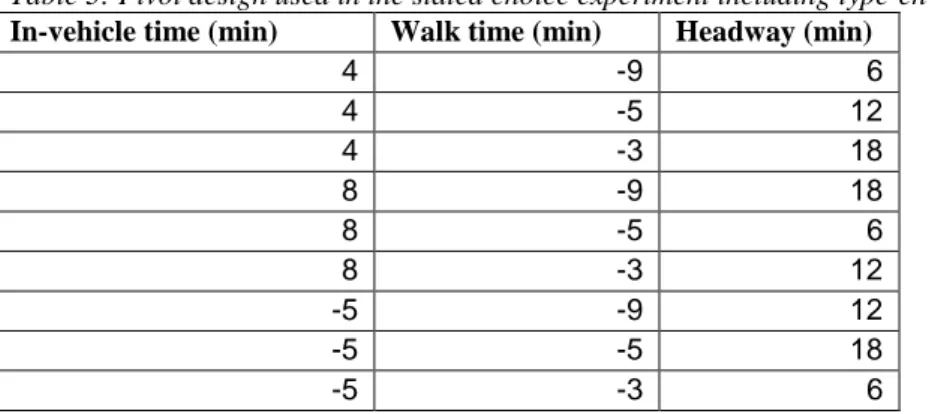
Table 3: Pivot design used in the stated choice experiment including type-environments.
In-vehicle time (min) Walk time (min) Headway (min)
4 -9 6 4 -5 12 4 -3 18 8 -9 18 8 -5 6 8 -3 12 -5 -9 12 -5 -5 18 -5 -3 6 3.4 Lexicographic answers
In the reference experiment, the share of lexicographic answers was low. 1 percent of respondents chose consistently, through all six choices in any of the experiments, the shortest headway. 12 percent chose the shortest walk time and 5 percent chose the shortest in vehicle travel time in all choices. In the insecurity experiment the share of lexicographic answers was slightly higher, presumably at least partly because the range of the factors was smaller than in the reference experiment. 9.8 percent of respondents chose consistently the shortest headway, 21.9 chose consistently the shortest walk time, and 2.7 percent chose consistently the shortest in vehicle travel time thought all choices. These respondents are seemingly non-traders with this experimental design. In addition, 2 percent of the respondents choose consistently the “both are equally good” alternative.
Killi et al. (2007) and Börjesson et al. (2010) find that lexicographic behaviour primarily is due to steep indifference curves in combination with insufficient ranges of attributes, and not to deviations from utility maximizing behaviour. For this reason, we have not discarded these observations. Lancsar and Louviere (2006) comment on the deletion of such observations by saying “it seems somewhat paradoxical, if not paternal, to design and implement discrete choice experiments because one is covariance matrix (inverse of the negative of the Fisher ‘information matrix’ obtained by the second derivative of the log-likelihood function).
12
interested in consumer preferences, but if the results do not conform to researchers’ a priori expectations of how preferences ‘should’ behave, to then impose one’s own preferences on the data by deleting such responses”.
4
MODEL ESTIMATION
Applying the model structure set up in section 2, a base model is estimated. Since the design includes a “both are equally good” alternative, the model is estimated as and ordinal logit model using Biogeme (Bierlaire, 2003; Bierlaire, 2008).
The estimation is carried out in different steps. The first model, the base model, is least constrained, in the sense that different sets of parameters are estimated for the five different choice experiments, namely the reference experiment and the four insecurity experiments (one for each type-environment as described in section 3.3). This is equivalent to estimating five different models. The five experiments are pooled in one model for convenience. Based on the result of the base model, model 2 is constrained such that all parameters but the one for walk time are equal across all insecurity experiments. In the final model 3, non-linearity in valuations in walk time and headway are added to model specification 2.
The ordinal logit model applied does not take into account the correlation of observations from the same individual. However, all models have also been estimated as mixed binary logit models taking account of this correlation (excluding the “both are equally good” alternative), specified as:
Δ + + ≥= 0
The error term is taken to be iid standard logistic and is normally distributed. The results are robust and the valuations of the mixed logit models change less than five percent compared the models not taking care of the panel effect.
In the base model, the difference in observed utility between the left- and right-hand side alternatives is:
Δ = ∑ Δ + Δ + Δ + Δ + Δ + Δ .
The four different type-environments have index = {1,2,3,4}, corresponding to the labelling of environments made in section 3. Index i=0 refers to observations from the reference experiment.
∆
TIi,∆
TWi and∆
THi denote the differences of in-vehicle travel time, walk time and headway between left- and right-hand side alternative in each binary choice. Note that since different sets of parameters are estimated for each type-environments and the reference experiment, the model does not restrict the response scales to be the same in any of the five experiments. The age effect on walk time weight corresponding to environment three and four is captured by the additional marginal utilities and , where index Y refers to young travellers (25 years or less). An alternative specific constant in the left hand side alternative was, as expected, found insignificant (t-value 0.4) and therefore not included in the models. The estimated parameters of the base model are shown in the leftmost column of Table 4. The leftmost column of Table 5 shows the weights of walk time and headway relative to in-vehicle travel time implied by the model. First, note the clear difference13
between men and women in how the environment influences the walk time weight. For men, the walk time is relatively independent of the environment. For women, however, the environment is clearly linked to walk time weight, which is consistent with our prior expectation. We will discuss these results in detail further below. The only age effect that could be found is that the youngest travellers (below 26 years) have a relatively higher disutility of walk time in darkness. For young women, the extra disutility applies both to the closed and the open environment in darkness. For young men the extra walk time weight applies only to the closed environment in darkness.
The base model reveals no significant impact of different environments on the in-vehicle travel time or headway parameters. This is consistent with theory and indicates that the response scale is similar across the insecurity experiments. Model 2 therefore includes one pooled in-vehicle time parameter, $ , and one pooled headway parameter, $ , for all type-environments. Moreover, since the parameter for difference in walk time weight between men and women is insignificant for the reference trip environment, this parameter is removed in model 2:
Δ = Δ + Δ + Δ + $ Δ $ + $ Δ $ + Δ + Δ
+ % & 'Δ + (Δ )
$ .
Applying the χ2-test we find that the base model is not significantly better than the restricted model 2; see Table 4. In both the base model and model 2, the walk time weight in the reference experiment is unexpectedly low. In model 3, the walk time and headway are therefore introduced in a more sophisticated manner.
Many studies have found that the marginal valuation of headway declines with increasing headway. The final model, Model 3, therefore uses five headway variables for the reference experiment to obtain a piecewise linear variable with kinks at 10, 30, 60 and 120 minutes. The specification of the headway is A = β1·min( ,10) +
β2·(min( ,30)-10)·1{ >10} + β3·(min( ,60)-30)·1{ >30} + β4·(min(
,120)-60)·1{ >60} + β5·( -120) ·1{ >120}, where is headway. In the insecurity experiment, the headway is never below 15 minutes, so for this sample, the kinks are at 30, 60 and 120 minutes, resulting in four headway variables: B = ω1·min( ,30) +
ω2·(min( ,60)-30)·1{ >30} + ω3·(min( ,120)-60)·1{ >60} + ω4·( -120) ·1{
>120}.
We also introduce a piecewise linear function for walking time for the reference experiment sample. The kinks are set at 15 minutes and 30 minutes, implying the specification C =
µ
1·min( ,15) +µ
2·(min ,30)-15)·1 >15} +µ
4·( -30) ·1{>30}, where is walk time. In the insecurity experiment, the walking time is never below 15 minutes and is therefore not introduced in the model as piecewise linear.
Δ = Δ + Δ+ + Δ, + $ Δ $ + Δ- + θ Δ +θ Δ
+ % Δ + θ Δ )
$ ,
The model fit of this final model improves significantly. The empirically estimated parameters of the final model are shown in the rightmost columns in Table 4 and the relative weights in the corresponding column in Table 5. The relative weights of walk
14
time are also shown in Figure 5. The first point to note is that the walk time weight in the reference experiment has increased relative to the previous models, but is still lower than the walk time weights in any of type-environments. We will discuss this further in the discussion section.
In environment 1, open and in daylight, men and women do not have significantly different walk time weights, which are 1.3-1.6 times relative to in-vehicle time. For women, the walk time weight is 2.0 in environment 2, closed but still in daylight. In environment 3, dark but open, the walk time weight increases further to about 2.3. Finally, the walk time increases drastically to 3.3 in environment 4, dark and closed. Women’s walk time weight is hence 2.6 times higher in the dark and closed environment compared to the open and light environment. For men, walk time weight is less dependent on environment. The walk time weight is, however, significantly higher in the dark and closed environment, 2.3, compared to the other type-environments. Men’s walk time weight is hence 1.4 times higher in the dark and closed environment than in the open and light environment.
Figure 5: Walking time weights for men and women in the reference experiments and in the four type-environments (weighted mean over the two age groups).
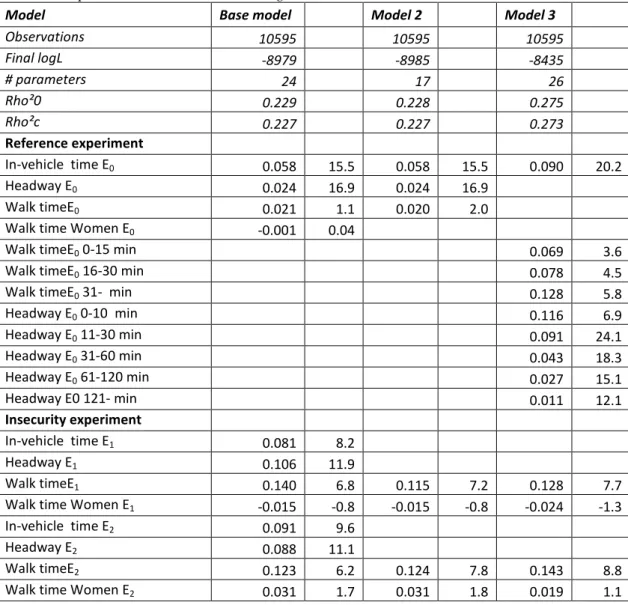
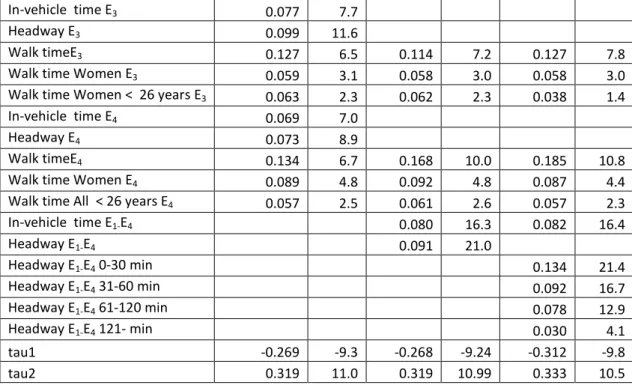
Table 4: Empirical models. All variables are given in the unit minutes.
Model Base model Model 2 Model 3
Observations 10595 10595 10595 Final logL -8979 -8985 -8435 # parameters 24 17 26 Rho²0 0.229 0.228 0.275 Rho²c 0.227 0.227 0.273 Reference experiment In-vehicle time E0 0.058 15.5 0.058 15.5 0.090 20.2 Headway E0 0.024 16.9 0.024 16.9 Walk timeE0 0.021 1.1 0.020 2.0 Walk time Women E0 -0.001 0.04
Walk timeE0 0-15 min 0.069 3.6
Walk timeE0 16-30 min 0.078 4.5
Walk timeE0 31- min 0.128 5.8
Headway E0 0-10 min 0.116 6.9 Headway E0 11-30 min 0.091 24.1 Headway E0 31-60 min 0.043 18.3 Headway E0 61-120 min 0.027 15.1 Headway E0 121- min 0.011 12.1 Insecurity experiment In-vehicle time E1 0.081 8.2 Headway E1 0.106 11.9 Walk timeE1 0.140 6.8 0.115 7.2 0.128 7.7
Walk time Women E1 -0.015 -0.8 -0.015 -0.8 -0.024 -1.3
In-vehicle time E2 0.091 9.6
Headway E2 0.088 11.1
Walk timeE2 0.123 6.2 0.124 7.8 0.143 8.8
15
In-vehicle time E3 0.077 7.7
Headway E3 0.099 11.6
Walk timeE3 0.127 6.5 0.114 7.2 0.127 7.8
Walk time Women E3 0.059 3.1 0.058 3.0 0.058 3.0
Walk time Women < 26 years E3 0.063 2.3 0.062 2.3 0.038 1.4
In-vehicle time E4 0.069 7.0
Headway E4 0.073 8.9
Walk timeE4 0.134 6.7 0.168 10.0 0.185 10.8
Walk time Women E4 0.089 4.8 0.092 4.8 0.087 4.4
Walk time All < 26 years E4 0.057 2.5 0.061 2.6 0.057 2.3
In-vehicle time E1-E4 0.080 16.3 0.082 16.4 Headway E1-E4 0.091 21.0 Headway E1-E4 0-30 min 0.134 21.4 Headway E1-E4 31-60 min 0.092 16.7 Headway E1-E4 61-120 min 0.078 12.9 Headway E1-E4 121- min 0.030 4.1 tau1 -0.269 -9.3 -0.268 -9.24 -0.312 -9.8 tau2 0.319 11.0 0.319 10.99 0.333 10.5
Table 5: Value of walking time and headway in relation to in-vehicle travel time derived from the three models presented in Table 4 (weighted mean over the two age groups).
Base model Model 2 Model 3
Walk timeE0 0.36 0.36
Walk timeE0 0-15 min 0.76
Walk timeE0 16-30 min 0.86
Walk timeE0 31- min 1.42
Headway E0 0.42 0.42 Headway E0 0-10 min 1.29 Headway E0 11-30 min 1.01 Headway E0 31-60 min 0.48 Headway E0 61-120 min 0.30 Headway E0 121- min 0.12
Walk time Men E1 1.73 1.44 1.56
Walk time Men E2 1.35 1.56 1.74
Walk time Men E3 1.64 1.43 1.55
Walk time Men E4 1.95 2.11 2.26
Walk time Women E1 1.54 1.25 1.26
Walk time Women E2 1.69 1.95 1.98
Walk time Women E3 2.41 2.16 2.25
Walk time Women E4 3.25 3.26 3.32
Headway E1 1.31 Headway E2 0.96 Headway E3 1.28 Headway E4 1.06 Headway E1 –E4 1.14 Headway E1-E4 0-30 min 1.63 Headway E1-E4 31-60 min 1.12
16
Headway E1-E4 61-120 min 0.95
Headway E1-E4 121- min 0.36
We end this section by noting that several variants of the base model were estimated to explore other possible differences between traveller segments. The base model was estimated separately for train and bus travellers. None of the parameters differed significantly between the modes, except that bus passengers have a significantly higher valuation of headway compared to train travellers in the reference trip setting (environment i = 0). The χ2-test showed no significant improvement in mode specific models compared to a pooled model. Second, the base model was estimated separately for men and women. Again, none of the parameters differed significantly between men and women, except walk time weights. The χ2-test showed no significant improvement in mode specific models compared to a pooled model.
5
DISCUSSION
To empirically derive the value of perceived insecurity is a complex, deep and difficult task. However, the method used in this study seems to give promising and theoretically consistent results. First, the relative valuation of walk time in the four type-environments shows results in line with prior expectations. Walk time in open environments induces less disutility than walk time in closed environments and walk time in daylight induces less disutility than walk time in darkness. Second, valuations of perceived insecurity differ between men and women, consistent with earlier findings in the field of social psychology, showing that perceived insecurity is more strongly linked to the characteristics of the physical environment for women than for men. Third, the fact that the value of walk time is found to be much less dependent on the walking environment for men than for women further strengthens our trust in this method; the experiment will not induce artificial differences in walk time disutility. Fourth, no difference was found in valuation of in-vehicle travel time and headway, which further supports the conclusion that the experiment does not induce artificial differences.
The most serious concern we have regarding the method is that walking time weights are consistently higher in the insecurity experiment, even in the open and light environment, than in the reference experiment. There may be several potential reasons for a higher valuation of walk time in the “insecurity” experiment compared to the more normal reference situation. First, there are no or few and distant people in the type-environments. Although this fulfilled a purpose (i.e. that the type and impression of people are difficult to control by policy measures), earlier research referred in the introduction suggests that people feel more insecure when streets are empty. Second, the difference between the reference and the insecurity experiment could be due to a focussing effect. That is, by visualizing the walking environments and not the environments for the other trip components, extra focus is placed on the walk time relative the other trip components. A third potential reason is that, in the insecurity experiment, respondents are asked to imagine walking in artificial and unfamiliar environments that they have not chosen themselves.
In practical use, the remedy for this inconsistency could be to rescale the walking time weights achieved for different walking time environments according to the relative
17
difference of the weights between the two experiments. The mean weight, for both men and women, is 1.41 for type-environment 1 and 0.76 for walk trips shorter than 15 minutes in the reference experiment. An appropriate rescaling factor would therefore be 1.41/0.76= 1.9.
It is worth pointing out again that the valuations obtained in the present study have an impact on the perceived insecurity, which might be very different from the real risk of actually encountering crime. Interestingly, women run no greater risk of encountering crimes in public spaces than men (Brottsförebyggande rådet, 2008). The difference between men and women in valuation of perceived insecurity may thus be due to differences in their perception of risk level. Another explanation is that the perception of the consequences of encountering crimes is more severe for women. In fact, women do run a higher risk of encounter sexual assault and rape whereas men run higher risk of encountering assault or being mugged (Brottsförebyggande rådet, 2008). Still, the gap between risk of encountering crime and valuation of perceived insecurity indicate that humans in general have difficulty in internalizing external risks in their valuations in an objective way. We should thus be careful not to interpret the results of this study as the willingness to pay for reducing the real risk of becoming a victim of crime when walking to access stations.
This section will close by discussing the practical use of the results achieved in this study. The values can, in principle, be used in CBAs to take into account the welfare gain from improving perceived security, for example, by installing streetlights or clearing away high bushes blocking the view. Potentially, this can be important when prioritizing between different policies, such as shortening unsecure walk paths through more bus-stops, decreasing headway and reducing the feeling of insecurity by rerouting or improving the walk paths in this respect.
It is, however, unlikely that the present type of valuations will be used in traditional CBAs on a regular basis, because CBAs are rarely used in urban planning. The main contribution of this study is rather the insight that the perception of insecurity involved in accessing the public transport system is a welfare loss, with the implication that improving the walk environments in this respect may be very beneficial socially.
We continue to apply the valuations to assess the benefit of improving walking environment by making some assumptions. The value of time for local/regional rail is taken from the present value of time study, €7.09/h. The weight 1.9 is used for taking out the focus effect that overestimates the walk time weight, as discussed earlier in this section. For women, the value of walk time difference between open and closed environments in daylight is then 7.09(1.26-1.98)/1.9 = €2.7/h. The corresponding difference in darkness would be €4.0/h. For men, the value of walk time difference between open and closed environments is €0/h in daylight and €2.6/h in darkness. Assuming that 50 percent of the walkers are women and that 33 percent of the trips occur in darkness, the average value of time difference between open and closed environments become €2.0/h. Given a walking speed of 4.5 km/h, it takes 13.3 minutes to walk one km. The value of converting one ‘closed’ link of one km to an open link is thus worth €0.45 per traveller. Assuming 1000 individuals and 300 days/year, the yearly benefit would be € 133 508.
18
The benefits are thus likely to far exceed cost of such as new street lighting or clear away high vegetation in an urban environment. Given the high valuations of perceived security found, we expect that improvements in this respect would also generate increased public transport travelling. Envall (2007) finds that good street lighting had a potentially positive impact on public transport use, which is consistent with evidence presented in some previous studies (CfIT 2001; Painter, 1996; Tight et al., 2004).
These insights could help bridge a gap between the perspectives of transport economists and social scientists. Social scientists have been successful in identifying factors that are important for the perception of insecurity, while transport economists have traditionally focused on valuing transport qualities such as time and money. The present study indicates that the methods traditionally used in transport economics can be extended to valuing transport quality in terms of comfort and insecurity and thereby estimating welfare effects of improvements in these respects. Consequently, transport economics can very effectively use knowledge developed by social scientists and quantify how important the factors are relative to other attributes of the trip.
6
CONCLUSIONS
Few previous studies have applied discrete choice methods to valuing the perception of insecurity. We have valuated different security-promoting factors by estimating the walking time weight relative to in-vehicle travel time in different type-environments. The method used in this work provides results that are consistent with theory and expectations.
We conclude that women have a significantly lower disutility of walking in physical environments that are characterized by factors creating openness, improving the chance of being seen, of seeing and of escaping compared to more closed environments. Women also have a lower disutility of walking in daylight compared to darkness. Men have a significantly lower disutility of walking in open physical environments, compared to more closed environments, when it is dark but not in daylight.
19
REFERENCES
Best, H. and M. Lanzendorf (2005). Division of labour and gender differences in metropolitan caar use: An empirical study in Cologne, Germany. Journal of Transport Geography, 13, 109-121.
Bierlaire, M. (2003). BIOGEME: a free package for the estimation of discrete choice models, Proceedings of the 3rd Swiss Transport Research Conference, Monte Verità, Ascona, Switzerland.
Bierlaire, M. (2008). "An introduction to Biogeme", http://biogeme.epfl.ch.
Brottsförebyggande rådet (2008). NTU 2008 Om utsatthet, trygghet och förtroende. Brottsförebyggande rådet Rapport 2009:2. http://www.bra.se/ extra/faq/?module_instance=2&action=question_show&id=492&category_id=0.
Lates accessed 20101209.
Börjesson, M., Fosgerau, M., Algers, S. (2010) Catching the tail: Empirical Identification of Value of time Distribution. Paper presented at the 2009 European Transport Conference.
CfIT (2001) Public attitudes to transport in England. Commission for Integrated Transport, London. Available at: www.cfit.gov.uk.
de Jong, G., Tseng Y., Kouwenhoven M., Verhoef, E., Bates, J. (2007) The value of travel time and travel time reliability, Survey design, Final report. Prepared for: The Netherlands Ministry of Transport, Public Works and Water Management.
Department for Transport, 2002. People’s Perceptions of Personal Security and Their Concerns About Crime on Public Transport: The Literature Review. UK Department for Transport, London.
De Serpa, A.C., (1971) A theory of the economics of time, The Economic Journal, 81, 828— 846.
Envall, P. (2007) Accessibility Planning: a chimera? The University of Leeds, Institute for Transport Studies. European Commission (2009): A sustainable future for transport: Towards an integrated, technology-led and user-friendly system. COM (2009) 279 (final) of 17 June 2009.
Grönlund B (2009) Tryggare för gående
http://homepage.mac.com/bogronlund/get2net/KrimSydplan0111.html. Lates accessed 20101209.
Grönlund B, (2001) Trygga gatu- och stadsrum. http://homepage.mac.com/bogronlund/ get2net/KrimSydplan0111.html. Lates accessed 20101209.
Jacobs, J. 1961 The Death and Life of Great American Cities New York: Random House. February 1993 [1961].
Johansson, M. and Wettermark, K. (2003): Perceived security in public transport (in Swedish). Chalmers University of Technology, Vatten Miljö Transport Nr 2003:3. Kelly, E., 1986. What makes women safe? Housing Review 35 (6).
Killi, M., Nossum, Å. and Veisten, K. (2007). Lexicographic answering in travel choice: Insufficient scale extensions and steep indifference curves? EJTIR, 7, no. 1 (2007), pp. 39-62.
Koskela, H and R. Pain 2000. Revisiting fear and place: women's fear of attack and the built Environment. Volume 31, Issue 2, May 2000, Pages 269-280.
Lancsar, E. and Louviere, J. (2006). Deleting ‘irrational’ responses from discrete choice experiments: a case of investigating or imposing preferences? Health Economics. 15: 797–811.
Lynch, G. and Atkins, S. (1988): The influence of personal security fears on women's travel patterns. Transportation Volume 15, Number 3, 257-277.
Ministry of Enterprise, Energy and Communications (2009): Objectives for future travels and transports (In Swedish). Government Bill 2008/09:93.
20
Ortúzar, J.D. (2007): Valuation of intangibles with stated preference methods: A view from the fringe of the empire. Oslo Workshop on Valuation Methods in Transport Planning, March 19-20, 2007.
Ortúzar, J. de D., and Willumsen, L. G., 2001, Modelling Transport (New York, U.S.A.: John Wiley).
Painter K. (1996) The influence of street lighting improvements on crime, fear and pedestrian street use, after dark. Landscape and urban planning. Vol. 35. pp.193-201.
Polk, M. (2004). The influence of gender on daily car use and on willingness to reduce car use in Sweden. Journal of Transport Geography, 12, 185-195.
Reed, T. B., R. R. Wallace, and R. Rodriguez. Transit-Passenger Perceptions of Transit-Related Crime Reduction Measures. In Transportation Research Record: Journal of the Transportation Research Board, No. 1731, TRB, National Research Council, Washington, D.C., 2000, pp. 130–141.
Rosenbloom, S. (2006). Understanding Women’s and Men’s Travel Patterns. in Research on Women’s Issues in Transportation: Report of a Conference. Transportation Researchh Board: Washington, DC. 7-28.
Sillano, M., Greene, M. and Ortúzar, J.D. (2006): Cuantificando la percepción de inseguridad ciudadana en barrios de escasos recursos (in Spanish). Revista eure (Vol. XXXII, Nº 97), pp. 17-35. Santiago de Chile, diciembre de 2006.
Tight M. R., Kelly C., Hodgson F. C., & Page M. (2004) Improving pedestrian accessibility and quality of life. 10th World Conference on Transport Research. Istanbul, Turkey. July 4-8, 2004.
Trench, S., Tiesdel, I.S., 1992. Safer cities for women: perceived risks and planning measures. Town Planning Review 63 (3), 279– 296.
Valentine, G., 1992. Images of danger: women's sources of information about the spatial distribution of male violence. Area 24, 22± 29.
Wardman M. (2004) Public transport values of time. Transport Policy; 11(4): 363–77.
Warr, M., 1990. Dangerous situations: social context and fear of victimisation. Social Forces 68 (3).
Wekerle, G.R., Whitzman, C., 1995. Safer Cities: Guidelines for Planning, Design and Management. Van Nostrand-Reinhold, New York.