THE EFFECTS OF HUMOROUS AND
IRRITATING ADVERTISING ON BRAND
PERCEPTION IN THE FOOD
INDUSTRY
MYLLYOJA, HOLLY-LAURA BEJO ČEH, NIKA
SAID, YACOUB
School of Business, Society & Engineering
Course: Bachelor Thesis in Business Administration Supervisor: Edward Gillmore Course code: FOA230 Date: 8th June 2020 15 ECTS
ABSTRACT
Date: 8th of June 2020
Level: Bachelor Thesis in Business Administration, 15 ECTS
Institution: School of Business, Society and Engineering, Mälardalen University Authors: Holly-Laura Myllyoja Nika Bejo Čeh Yacoub Said (98/07/23) (96/08/24) (95/01/01)
Title: The effects of humorous and irritating advertising on brand perception in the food industry.
Tutor: Edward Gillmore
Keywords: Advertising, Branding, Humorous Advertising, Irritating Advertising, Brand Perception.
Research
Question: What are the outcomes of humorous & irritating advertising on brand perception in the food industry?
Purpose: The purpose of this study is to see how food advertising that is considered humorous and irritating is perceived by consumers and how this affects their brand perception.
Method: This study uses a quantitative approach by using a survey method. The data collected was analyzed by the use of a descriptive method.
Conclusion: The way people perceive humorous advertisements varies due to many affecting factors. This will have positive and negative results in brand perception depending on how the advertisement has been perceived, failed humor, plain humor, or humorous and irritating.
CONTENTS 1 INTRODUCTION ... 1 1.1 Problem Background ... 1 1.2 Problem Statement ... 3 1.3 Purpose ... 4 1.4 Research Question ... 4 1.5 Definitions ... 4 2 LITERATURE REVIEW ... 6 2.1 Consumer Behavior ... 6 2.2 Advertising ... 9 2.2.1 Humorous Advertising ... 10 2.2.2 Irritating Advertising ... 13 2.3 Branding ... 14 2.3.1 Brand Perception ... 16 3 THEORETICAL FRAMEWORK ... 18 3.1 Conceptual Framework ... 18 4 METHODOLOGY ... 20 4.1 Research Approach ... 20 4.2 Epistemology ... 20 4.3 Data Collection ... 21 4.3.1 Use of Literature ... 21 4.3.2 Primary Data ... 21 4.3.3 Data Analysis ... 24
4.4 Validity and reliability ... 26
4.5 Limitations ... 26 5 EMPIRICAL FINDINGS ... 29 6 DISCUSSION ... 47 6.1 Type of respondent ... 47 6.2 Burger King ... 48 6.3 Haribo ... 49 6.4 KFC ... 50
6.5 Comparison ... 51
7 CONCLUSION ... 56
7.1 Further studies ... 56
TABLE OF FIGURES
Figure 5.1: Age (according to generations) ………...……… 30
Figure 5.2: Gender ………..………. 30
Figure 5.3: Nationality ………..……….. 31
Figure 5.4: Location ………..……….. 31
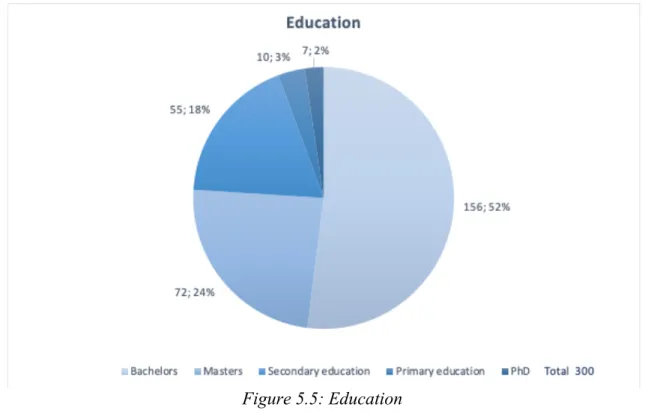
Figure 5.5: Education ………..………… 32
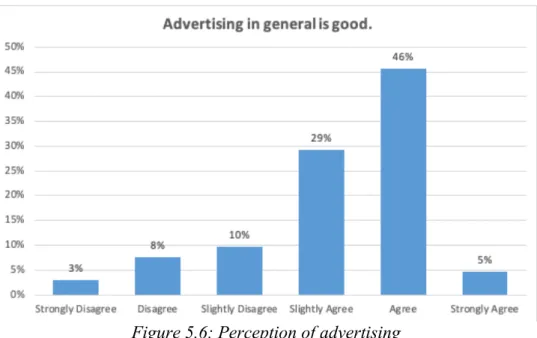
Figure 5.6: Perception of advertising ………..…...…… 33
Figure 5.7: Interest in advertising ………..……….. 33
Figure 5.8: Enjoyment of advertising ……….………. 34
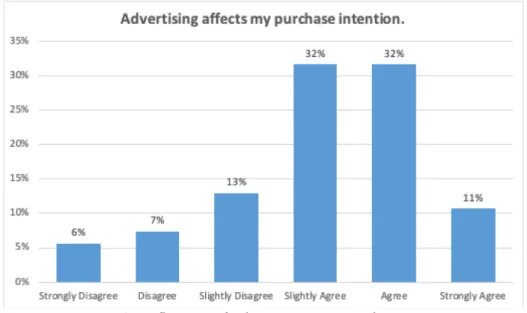
Figure 5.9: Influence of advertising on purchase intention ……….…………. 34
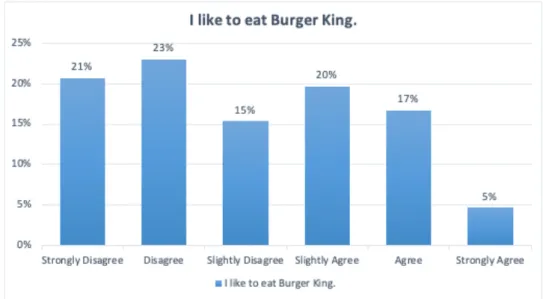
Figure 5.10: Opinion about Burger King ……….………... 35
Figure 5.11: Quality of Burger King ……….……… 36
Figure 5.12: Opinion about Haribo ………. 36
Figure 5.13: Emotional connection to the brand ……….…………. 37
Figure 5.14: Opinion about KFC ………...………… 37
Figure 5.15: Quality of KFC ……… 38
Figure 5.16: KFC´s environment ……….. 38
Figure 5.17: Humor in the advertisement ……….……….. 39
Figure 5.18: Irritation in the advertisements ………...………….. 40
Figure 5.19: Acceptance of the advertisements ……….……….. 40
Figure 5.20: Positive or negative influence of the advertisements towards the brands ...… 31
Figure 5.21: Persuasion of the advertisements ……… 41
Figure 5.22: Opinion about Burger King before and after seeing the advertisement ……… 42
Figure 5.23: Opinion about Haribo before and after seeing the advertisement ………. 43
1. INTRODUCTION
This part of the thesis will start with an explanation of the field chosen in which the rest of the paper will continue. It will start with the history and a broader explanation of what advertising is and evolve into a closer focus on humor and irritation in advertising.
1.1 Problem Background
Advertising has existed since the 17th century, but most marketing theories start later in the mid-19th century (Tungate, 2015). The earliest advertising began as soon as forms of commerce began but with the industrial revolution and mass production, the beginning of mass marketing started (Tellis & Ambler, 2007). According to McFall (2004) advertising is the relation between meaning and reality, advertising is the method of transforming brand meanings into text, video and, etc. However, it is important to acknowledge that advertisements are not perceived the same in different industries. In the food industry, media and advertising are ever-present and influence food-related behaviors (Loewenstein, 1996). Food advertisements can often result in a precise and extensive effect on food-related behaviors, which consumers may not even be aware of (Bargh & Morsella, 2008).
There is a chance when advertising does not achieve providing information that it might be perceived as irritating, which affects the customers' attitude towards a brand. One way that advertising can be looked at is as an irrational system that affects our emotions (Dyer, 1982). Be that as it may, people can ignore any kind of advertising. However, it may be difficult to ignore advertisements since they affect emotions and cause irritation especially if already exposed to them. It is also hard to know what happens when attempts at humor in advertising are not perceived by the audience as funny (Gulas & Weinberger, 2006).
Toncar (2001) states that “Humor is shown to be a good way for companies to reach customers and create brand awareness. Humor is also a good tool for companies to use to get the customers' attention. The purpose of using humor in ads might be the same from country to country but how a company effectively designs ads and how they appeal to humor differs.” Advertisers often try to pair a neutral product or service motive with an event or situation that causes positive feelings, such as humor (Belch & Belch, 2018). Advertisements are easily identified if they aim for attention and some form of shock appeal which is assumed to underline the ability to breach advertising clutter and capture the attention of a target audience which then listens and acts on the connected message (Swani et al., 2013). When transferred to an ad, humor triggers an instant affective response, which is then transferred to the ad and the brand (Wang et al., 2019). However, those ads may also bring negative reactions from the perceived humor which in turn hurts a brand (Holbrook & Batra, 1987). Humor is not and never has been a miracle solution that [indiscriminately] assures more successful advertising (Weinberger & Campbell, 1991). Humorous advertising can not only please an audience but also reduce negative opinions of the brand or a product and reach the goal of advertising (Wang et al., 2019).
Irritation is a feeling that consumers respond to for a particular reason. An irritating advertisement can cause consumers to develop a specific attitude towards the brand (Chakrabarty & Yelkur, 2005). Aaker and Bruzzone (1985) studied causes of irritation in advertising and defined an irritating commercial as “one that is provoking, causing displeasure and momentary impatience”. Irritation always results in a negative attitude towards the ad and the ad becomes less preferable (Pelsmacker & Van der Bergh, 1999). Trying to be funny can evoke negative feelings and decrease consumers’ attitudes towards the brand in the same
1.2 Problem Statement
We live in a globalized world where different types of humor in an advertisement are perceived in another way. An advertisement´s success is influenced by many different aspects such as the length of the advertisement, language, picture, colors, etc. (Panda & Mishra, 2013). It is important to understand the components of advertising, such as feelings to entirely comprehend the impact of an advertisement to some extent because there are many reasons for liking or disliking an advertisement. For example, advertisements evoke diverse responses as warmth, humor, and surgency which could be equally liked but effective very differently. (Aaker, et al., 1988) From its earliest days, advertising has served to inform, persuade, and remind consumers just as it does today (Tellis & Ambler, 2007). 21st-century advertising is concerned with different end benefits a product has on people, focusing on psychological and emotional connection, ingredients, and product formulation (Fletcher, 2010).
There have been many relevant studies of humor in advertising which have been implemented in the last few 25 years but understanding the impact of humor has been difficult. Because many factors influence the humorous message, which are the nature of the product, audience factors, communication goals, humor relatedness, humor style, and humor placement, generalizations about the effects of humor have been rare (Spotts, Weinberger & Parsons, 1997). Humorous and irritating advertisements tend to have multiple outcomes on customer reach and perception due to their sensitivity. As stated by Panda and Mishra (2013), “The use of humor as an executional tactic is of particular interest to marketers, since marketing performance depends on effective and successful advertising.”
The problem that arises is that humor can be perceived differently in reality and may cause diverse reactions and sensitivities or irritation. This study will investigate the gap that is
founded between what a company wants to deliver by using humorous advertisement, and how customers perceive an advertisement and in turn how they perceive a brand.
1.3 Purpose
This thesis explores the outcomes of customers' perceptions of advertising to understand if, how, and why these advertisements affect customers' brand perception, in regard to being humorous and irritating. This paper will provide a description of advertising and how humorous and irritating advertising could affect marketing campaigns and what could be done to avoid negative effects on customers when humorous advertising becomes an attempt at humor. This thesis will provide companies with informative ways to improve their campaigns without losing the interest of customers.
1.4 Research Question
What are the outcomes of humorous & irritating advertising on brand perception in the food industry?
1.5 Definitions
Consumer behavior: Consumer behavior is the study of how individuals, groups, and organizations select, buy, use, and dispose of goods, services, ideas, or experiences to satisfy their needs and wants. (Kotler & Keller, 2016)
Advertising: “Any paid form of non-personal communication of ideas or products in the prime media, i.e. television, the press, posters, cinema and radio” (Jobber, 2004).
Humorous advertising: Advertising that uses humor. Humor can be used in advertising in various ways such as puns, understatements, jokes, ludicrous situations, satire, and irony (Hoyer, Pieters & Macinnis, 2013).
Irritating advertising: Advertising that causes irritation. ‘’An irritating commercial is one that is provoking, causing displeasure and momentary impatience.’’ (Aaker & Bruzzone, 1985).
Branding: “To brand a product, it is necessary to teach consumers ‘who’ the product is — by giving it a name and using other brand elements to help identify it — as well as ‘what’ the product does and ‘why’ consumers should care. Branding involves creating mental structures and helping consumers organize their knowledge about products and services in a way that clarifies their decision making and, in the process, provide value to the firm.” (Keller, 2003).
Brand perception: Perception is an individual process that a consumer receives, selects, organizes, and interprets information to create an idea about a brand. It depends on the internal factors of consumers such as individuals' beliefs, experiences, moods, needs, and expectations (Belch & Belch, 2018).
2 LITERATURE REVIEW
In this part of the study, the authors will examine relevant literature. Consumer behavior, advertising, humorous advertising, irritating advertising, branding, brand equity, and brand perception. Give a brief understanding of each of the variables.
2.1 Consumer Behavior
Consumer behavior is a complex subject, which has been defined by many. According to Kotler and Keller (2016), consumer behavior is the study of how individuals, groups, and organizations select, buy, use, and dispose of goods, services, ideas, or experiences to satisfy their needs and wants. Sandhusen (2000) describes consumer behavior as the knowledge that raises questions to the mind of managers such as how, when, where, and why people buy a specific product.
Other studies define consumer behavior as the decision-making process through physical and psychological activities that start with seeking the need for a product and ends with the end of the product life cycle (Khan, 2006). Consumer behavior is the understanding of how individuals spend their resources, such as money, time, or effort on various items (Nair, 2009). In the decision-making process, companies have to investigate how sociology, psychology, and economics cooperate to affect consumers’ decisions (Macinns & Folkes, 2010).
The differences between a customer and a consumer can affect the real understanding of consumer behavior. Customers can be individuals or a group who buy a product, while a consumer is a person or group that uses the product. So, a customer is the one who buys a product but not necessarily the one who uses it, and the consumer is the user but might not be the one who bought it. The relationship between the two terms can affect how brands define
consumer behavior (Nair, 2009). Koufaris (2002) stated that consumer behavior in a virtual and a traditional environment share the same characteristics. Other studies talked about consumer behavior in the virtual world and stated that it is not so different from consumer behavior in the traditional world. In short, consumer behavior in both worlds follows the same pattern (Lee & Chen, 2010).
By understanding why consumers buy particular products, marketers can understand not only which products are needed and where they are needed, but also how to best present them to the consumer. If marketers know how best to advertise to consumers, they can create buying motives, which will lead to a purchase decision (Kotler & Keller, 2016). Therefore, consumer behavior is an inseparable part of marketing. The importance of studying consumer behavior is to understand the huge effect it plays in our lives as consumers. Khan (2006) says “We spend a lot of time in shops and marketplaces. We talk and discuss with friends about products and services and get a lot of information from TV. This influences our daily lives.”
Word of mouth is a huge advertising strategy. It can affect consumers and influence their decision to purchase products or services. However, Solomon’s study (2006) shows that about 80% of our purchasing decisions are influenced by people´s recommendations. The group approval system is a key factor in how consumer behavior can be changed due to the group of people the consumer is surrounded by. That is, if a person is living in a luxurious society, people will be forced to purchase expensive clothes just to make sure they fit into society (Solomon et al., 2013). Engel et al. (1995) state that, the group of people that influence the purchasing process is called a reference group, which consists of the people who make notes that can affect other individuals’ behavior. These reference groups have values, standards, and norms that have an effect on the person. Reference groups can be founded as formal or informal, but usually,
they are formal groups that consist of family, friends, and acquaintances that have an impact on purchasing decisions (Engel, Blackwell & Miniard, 1995).
Solomon et al. (2013) discuss factors that marketers use to influence consumers’ minds when they market a product or service. The authors say “the consumers’ evaluations of products are affected by their appearance, taste, texture, and/or smell. We may be influenced by the shape and color of the package, as well as by more subtle factors, such as symbolism used in the brand name, in an advertisement, or even in the choice of a cover model for a magazine”. (Solomon et al., 2013). The factors discussed can affect consumer behavior and purchasing decisions.
The choice of the product depends on how much the consumer believes that the product will satisfy his/her needs and how they perceive this feeling depends on how they perceive the packaging. Otherwise stated, this is called visual communication and how it can influence consumer behavior (Kupiec & Revell, 2001). The packaging is a top tool that companies use to attract consumers and influence the decision-making process. It is a great way to transfer all the information the company wants and strengthen the position of the product in the minds of the consumers (Butkeviciene, et al., 2008).
Marketers have determined what is the game-changer that helps them to gain a competitive advantage, they have to focus more on the consumer and understand the consumers’ behavior (Nair, 2009). Companies invest huge amounts of money on consumer behavior studies to try to find out more about the purchasing behavior of their customers and get all the information the company needs to be able to attract more consumers (Armstrong, Kotler, Saunders & Wong, 2002). The knowledge marketers gather about consumer behavior helps them analyze and understand the needs of the consumers. This tool is very important to the success of any
marketing strategy in the long term; however, the success of their marketing strategies will help brands target the right market selections, consumer needs, wants, and gain profit (Khan, 2006).
2.2 Advertising
Advertising is a form of marketing communication. At its most basic, the purpose of advertising has always been to sell a product which can be goods, services, or ideas (Moriarty, Wells & Mitchell, 2012). It can be defined as any compensated form of nonpersonal communication about an organization, product, service, or idea by a recognized sponsor (Belch & Belch, 2018). Advertising is a process of selling services, products, ideas, and information, producing the end product of advertising. Advertising is a continuously changing process that cannot be defined in one or two words (Green, 2012). “Advertising is built upon metaphors and stories in order to create brand identity and relations” (O`Barr, 2015).
Advertising can be a beneficial tool for building company or brand equity. It is an influential way to provide consumers with information as well as to influence their perceptions. It can be used to create encouraging and uncommon images and relations for a brand which can be important for companies that sell products or services that are difficult to differentiate based on functional attributes (Belch & Belch, 2018).
Advertisements can be created to produce advertising end products or advertise brand images. “Advertising is a paid form of persuasive communication that uses mass and interactive media to reach broad audiences in order to connect an identified sponsor with buyers (a target audience), provide information about products (goods, services, and ideas), and interpret the product features in terms of the customer’s needs and wants’’ (Moriarty et al., 2012). In short, advertising does not only grab attention but creates a relation of exchange and mutual publicity
as it aims to create a good word of mouth between people which affects customer reach and perception. The relationship between the consumer and the product is created via the brand image using symbolism and values in the advertisement, to help create a relatable relationship between the product and the consumers perception. As it was described by Broadbent & Cooper (1987) “In order to be successful, images and symbols must relate to, and indeed, exploit, the needs, values and life-styles of consumers in such a way that the meanings involved give added values, and differentiate the brand from other brands”.
Choosing a specific type of advertising and advertising strategy is not an easy process since it affects customer reach. Customer reach is the percentage of the target audience that is exposed to the advertising message in a specified time frame at least once. You could also express this as an opportunity to see the advertisement. Customer reach is an important part of advertising as it is considered when selecting the vehicle to reach the target audience, but advertisers can never be sure if they will in fact be able to reach the intended audience (Shimp & Andrews, 2013). Each type of advertisement has its specific circumstances and criteria that make it succeed or fail compared to other advertisements.
2.2.1 Humorous Advertising
Humor can be used in advertising in various ways such as puns, understatements, jokes, ludicrous situations, satire, and irony (Hoyer, Pieters & MacInnis, 2013). There is, however, no clear theory for humor. Even so, Gulas and Weinberger (2006) have concluded a unity among theories in their study. They concluded that “contextual cues play a vital role in turning an ordinary incongruity, disparagement, or arousal situation from being fearful, strange, or simply tension-filled. These cues may be embedded in the surrounding situation and social context (Rothbart, 1976; Foot & Chapman, 1976), other observers of the humor (i.e., audiences)
(Chapman & Foot 1976), the deliverer of the humor (McGhee, 1979), the stimulus itself (Berlyne, 1972; Freud, 1905: 1960; Zillmann, 1983), or internal cues related to the subjects’ own mood or predisposition and affective and behavioral response (Leventhal & Cupchik, 1976).” (Gulas & Weinberger, 2006)
The humor process typically includes an agent, an object, and an audience. The agent is the source of the humor, the one that tells the joke. The object is the target of fun and the audience is the recipient of the humor (Gulas & Weinberger, 2006). Therefore, humor is a complex subject as humor is affected by many factors and can be interpreted in a way that it was not intended to. The outcome of humor response may impact the recipients’ feelings, thoughts, or actions which vary from positive to negative outcomes (Gulas & Weingberger, 2006). This may lead to attempted humor, as humor and attempted humor are two different phenomena. Attempts of humor are not likely to be perceived as funny (Gulas & Weingberger, 2006), hence advertising with attempted humor could be categorized as irritating advertising. The misuse of humor may reduce credibility, decrease trust, distort the communication of information, but also create barriers (Bergeron & Vachon, 2008). However, Warren, Barsky, and McGraw (2018) suggest that an advertisement can be perceived both “funny and discomforting, be amused and disgusted, or laugh despite being offended”.
When using humor, it is important to know the target audience as some humor may be found offensive to others. However, a type of humor may be found as offensive to the people outside of the audience, which leaves the effectiveness of humor to be questionable as it may work as a restricting factor instead of an enhancing one (Plester, 2009). This results from people perceiving things through their perspectives rather than from a neutral perspective. (Speck, 1991) Any humorous advertisement could be perceived wrong depending on their cognitive
perception (Lee & Lim, 2008). Humorous ads that have triggered negative reactions in addition to laughter and amusement can hurt brand attitudes (Warren, Barsky & McGraw, 2018).
However, if used correctly humor is an efficient tool in advertising to influence consumers’ perceptions and understanding, moreover, to influence and persuade them, as according to Bergeron and Vachon (2008) humor increases feelings of credibility and overall likability. An ad with humor may result in higher recall and higher attention levels (Hoyer, Pieters & MacInnis, 2013). According to Warren, Barsky, and Mcgraw (2018), humor is a peripheral cue which means it is easier to process than some other factors which also adds on to the perks of using humor as it increases recall through effortless and incidental learning.
In Weinberger et al.’s (1995) study, they found that the use of humor differed by the media and product type. TV and radio advertisements used humor the most and low-risk items such as snacks were the most common product to be advertised with humor (Weinberger et al., 1995). Humor works better on TV and radio as they have more means to express. However, it has been studied that people’s brains process electronic content differently than print as paper ads caused more emotional processing (Dooley, 2012). But also, humor is more appropriate for the low-involvement product, such as food products, as less thought process goes into choosing that type of products, hence creating positive feelings about the ads for these types of products is critical (Warren, Barsky & Mcgraw, 2018). This is particularly why this study is focusing on the two biggest advertising types print ads and commercials and more specifically in the food industry.
2.2.2 Irritating Advertising
A way of describing irritating advertising is “one that is provoking, causing displeasure and momentary impatience” (Aaker & Bruzzone, 1985). It is important for marketers to understand irritation as according to Chakrabarty and Yelkur (2005), irritating advertising can plausibly cause consumers to develop specific reactions towards the advertised brand. In fact, there is criticism of advertisements regarding offensiveness, wastefulness, and annoyance (Levitt, 1984). Aaker and Bruzzone (1985) discovered that there are factors that raise irritation towards advertisements. Specific humorous advertising factors that are used are physical (e.g., tickling) and identity threats (e.g., teasing), as well as behaviors that break cultural (e.g., inappropriate attire), social (e.g., flatulence), moral (e.g., bestiality), conversational (e.g., sarcasm), linguistic (e.g., wordplay), and logic norms (e.g., absurdities) (Warren, Barsky & McGraw, 2018). Veatch (1998) calls these factors violations, which refers to something that subjectively threatens a person’s well-being, identity, or normative belief structure. If something is perceived as threatening it usually leads to a negative affective reaction such as anger, fear, or disgust (Rozin, Lowery, Imada & Haidt, 1999).
Using irritation as a purposeful advertising method may not be effective since consumers attempt to minimize negative emotions, such as shame and guilt, but emotional appeals that are based on conflicting emotions may also result in less favorable attitudes (Warren, Barsky & McGraw, 2018). A negative attitude to an advertisement such as irritation translates into a negative attitude towards the brand and intention to purchase (Sabri-Zaaraoui, 2007). This is why factors such as taboos or violations are dangerous tools for advertising if the meaning is not transferred correctly. Because even if a negative emotion was stimulated unintentionally through humor or some other way, it can generate negative attitudes and purchase intentions (Warren, Barsky & McGraw, 2018).
There is a correlation with the types of commercials where irritation levels are higher and with commercials where humor works well. Factors that may increase ad irritation are, according to Aaker and Bruzzone (1985), the advertised product itself (a sensitive product); advertisements that portray a contrived, phony, or unbelievable situation; advertisements that threaten an important social relationship; and advertisements that demonstrate a physical discomfort. When, on the other hand, factors in an advertisement had a happy or warm mood, a credible spokesperson, humor, or useful information lowered irritation levels. However, it is seen that very humorous advertising can irritate some who don’t appreciate or are tired of humor (Aaker & Bruzzone, 1985).
2.3 Branding
Over the century, branding has become a major interest for businesses and society. Before, it was only an occasionally studied phenomenon. Traditional commercial brands are present everywhere and compete for the consumers’ attention. The way consumers interact with brands is also changing as a result of growing digitally native brands, the global access to information and products through digital and mobile channels, and the broad accessibility of smart, connected devices (Swaminathan et. al, 2020).
It is argued that because brands today have a big effect on people´s emotions, proceeding beyond commerce, the companies started to have a higher level of involvement in customers’ lives and their well-being. This commitment and increased sensitivity to people is one of the factors that acquire a market today (Pandey et al., 2012). Brands are formed through a combination of rational and emotional elements and those emotions caused by brands may increase buying and consumption processes (Hirshman & Holbrook, 1982).
Branding has been around for centuries as a way to differentiate the goods of one producer from another, which creates mental structures and helps consumers establish knowledge about a particular product or service which later supports their decision making. During the process, value to the firm is provided (Keller, 2013). Branding is about building and maintaining an attractive identity and image of the company and its products or services in the perception of the consumer (Belch & Belch, 2018). It is also one of the most crucial elements in the field of marketing (Gaski, 2010). Branding is a controlled process used for building awareness and extending customer loyalty (Wheeler, 2018). Branding is a system of signs which are associated with products, services, organizations, cultural products, places, people (Jones, 2017). For branding to be achieved, the goals are to build and maintain brand awareness and interest; develop and enhance the view toward the company, product, or service; and to build and encourage relationships between the consumer and the brand (Belch & Belch, 2018).
“Trust is the cardinal driver of loyalty because it creates exchange relationships that are highly valued.” Brand loyalty does not specifically focus on repeated purchases but on the internal tendencies or attitude toward the brand (Delgado-Ballester & Munuera‐Alemán, 2005). Brand loyalty appeared to be an important marketing concept for many customer-oriented businesses. Customers with a high level of loyalty are likely to spend more money on the products or services that provide easier decision-making than others. It is familiar that the level of loyalty is firmly related to different purchase behaviors, such as sensitivity to price, positive word-of-mouth, and increased tolerance to the quality of products or services (Kim et al., 2007). Brand loyalty is a measure of the bond that a customer has to a brand (Aaker, 1991) and is the core aspect of brand equity (Aaker, 1996). For marketers, it is important to establish brand loyalty which results in repeated purchases. Customer loyalty is developed through different types of products and services (Belch & Belch, 2018). Odin et al. (2001) state that brand loyalty can be either behavioral or attitudinal.
2.3.1 Brand Perception
Perception is an individual process that a consumer receives, selects, organizes, and interprets information to create an idea about a brand. It depends on the internal factors of consumers such as individuals' beliefs, experiences, moods, needs, and expectations (Belch & Belch, 2018). Brand perception is created through two factors: the consumer and the company. The company uses advertisements as a tool to send the identity of the company and the products that they are selling/producing to the consumers in order for them to create their own brand perception. The customer, on the other hand, creates a brand perception based on his/her experience and environment with the product and the way it was advertised (Henderson Britt, 1971; Timney & Chamberlain, 2017; Chan, Chan & Tang, 2017). Simply put, it is a way of how consumers act and create a brand perception (Ataman & Ülengin, 2003).
Consumers' brand perception is of great importance since it affects the relationship between a consumer and a company by creating long-term relationships, loyalty, and trust. Put differently, creating a good picture of the company to consumers' minds (Fournier, 1998; Low & Lamb, 2000). An example is when consumers tend to give automatic trust to a company no matter what their new products are. This creates reputation trust. Low and Lamb (2000) affirms and assures the importance of delivering the right brand perception to the consumers since it acts as a messenger between the brand image of the company and the consumers.
The brand perception is focused on how consumers feel, how they connect to the product, and how it makes them feel. That is, how the product/service appeals to the consumers' feelings, creating a brand image based on their perception (Keller, 1993: Low & Lamb, 2000). An example is based on how the product/service will contribute to the consumers feeling and resilience after purchasing this product/service (Keller, 1993; Koll & von Wallpach, 2009).
Riezebos (2003) says that the brand image: “is formed through three different inductive processes: marketing communication, consumption experience, and social influence”. However, Chan et al. (2017) state that advertising is the most effective way to create a brand image since advertising is an indirect way to connect to the whole population and not just the consumers. It exposes the products/services’ quality and validity to consumers' experience, building a brand perception and creating eagerness for the consumer to try a product and form a perception about it (Subramaniam et al., 2014). Antonova and Latosha (2018) explain that validity is an important variable for consumers' perception since it creates a relationship based on feelings, eagerness to discover the product and enthusiasm to try the product for the first time. Here it can be seen how advertising is used as a tool to create a brand image. It attracts the consumers to create a brand perception, which starts an indirect relationship that changes to a long-term relationship based on the consumers' positive perception and feelings towards the products/service.
3 THEORETICAL FRAMEWORK
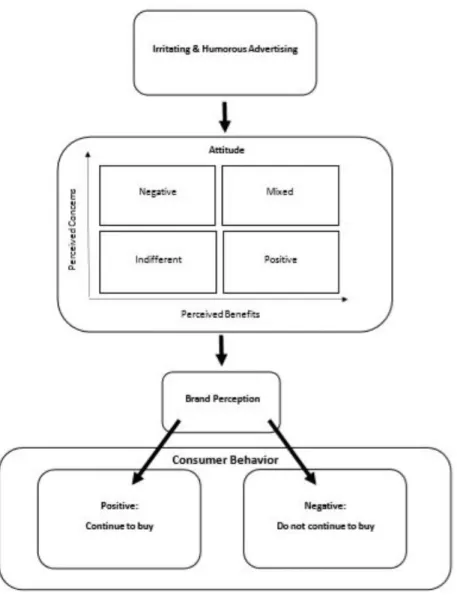
In this part, the authors will present the model this study will use. A clear description of how the variables mentioned in the model work with each other. The model shows how humorous and irritating ads affect the last decision consumers take.
3.1 Conceptual Framework
One of the main sources to create brand perception is through advertising which affects the consumer’s cognitive perception. The conceptual framework figure 3.1.1. was inspired by the consumer online behavioral advertising perception model by Dehling et al. (2019) and the dual-mediation hypothesis described by Hoyer, Pieters & MacInnis (2013), which are used in the figure. The conceptual framework the authors created with the help of these two theories explains how the attitude to an irritating and humorous advertisement influences brand perception which then effects purchasing intention. The way a person responds to an ad creates attitude which in turn will affect brand perception. This brand perception will then shape consumer behavior, which is measured by the intention to purchase (Hoyer, Pieters & MacInnis, 2013). In figure 3.1.1., the focus is on how the perception of a brand is affected specifically by humorous and irritating advertising as advertising shapes brand perception. However, humorous and irritating advertising is a riskier tactic as they can be perceived in various ways by different people leading to different outcomes as they affect consumer behavior, this is described by the attitude scale that is from Dehling et al.’s (2019) model. This scale shows the possible variations of attitudes that were affected by the advertisements, if people perceive concerns, they feel negative and if they perceive benefits, they feel positive. If the advertisement is perceived positively, customers are more likely to turn to positive consumer behavior and buy the product advertised but if it is perceived negatively, they will see the brand in a negative
light and most likely avoid purchasing from the brand (Pelsmacker & Geuens, 1999). This part the authors modified from the dual mediation hypothesis, as they added brand perception in-between attitude and consumer behavior. The irritating and humorous advertising was modified to fit this study as in both models used to create this one used advertising in general, which was too broad for this study.
4 METHODOLOGY
In this chapter, a description of the research approach, epistemology, data collection, and limitations will be presented, including an indication of the validity and reliability of the research.
4.1 Research Approach
There are two types of research approaches: deductive and inductive. For the purpose of this study, the authors used a deductive approach for the research as the research is using a survey method. A survey method is commonly associated with a deductive research approach. With this approach, it can answer ‘what’, ‘who’, ‘where’, ‘how much’ and ‘how many’ questions (Saunders et al., 2016). Evans and Over (2013) describe deduction as an objective to give evidence that is already believed and that makes it true.
4.2 Epistemology
Epistemology is the philosophy concerned with the theory of knowledge. According to Bryman and Bell (2013), it is specifically about the question of what is (or should be) regarded as acceptable, valid, and legitimate knowledge in a discipline. There are many branches of epistemology regarding research, such as pragmatism, positivism, realism, and interpretivism. These are different types of research philosophies regarding the researcher’s views on what constitutes acceptable knowledge, such as types of phenomena and different focuses.
This study is positivist in its epistemological position as the study is conducted by testing and analyzing data. Positivism supports the application of the methods of the natural sciences to the
study (Bryman & Bell, 2013). In this study, the authors only accept observable phenomena based on data and facts as knowledge. They were limited to data collection and interpretation objectively, as they were independent of the study. As this study is of the deductive kind, it fits within the principles of positivism because the theory and facts gathered lay ground for this study. This theory will then lead to a subject of study which will be assessed and explained. It is criticized that the use of positivism relies on the status quo, as the studies are only descriptive and hence lack a more in-depth insight.
4.3 Data Collection
In this section collection of data used for this study will be introduced which includes the design of the survey, methods, and sampling used during this research.
4.3.1 Use of Literature
In this paper, the authors used literature that was gathered from books, school journals, and prior studies. The use of this literature helped the authors understand more about the ideas they present in the paper and gave them the ability to define some definitions to the readers. The literature used will increase the validity of this research and give a clearer analysis of primary data, that was gathered by the survey in this study.
4.3.2 Primary Data
The authors decided to conduct a survey using a quantitative method. The survey was in the form of an online questionnaire that was powered by Office Forms, an online survey application. It is a convenient and easy way of gathering data, but also fast and provides a great response rate as it can easily be shared with many people. The survey was designed to collect
answers from people from the age range of 18 to 63 years old, as it is important to get insights from all ages in the case of advertising. The age difference influences the way respondents would answer questions in the survey due to different generations having dissimilar cognitive perceptions of their surroundings which leads to young people perceiving humor and information differently from older people which in other affects brand perception and consumer behavior between generations (Ardila, et al., 2000). However, since it was limited to over 18-year-olds, it is then most likely that the respondents are in charge of their purchasing decisions. The sample was not geographically limited; hence the collected responses were from different countries around the world. This was because the authors wanted to have a wide sample.
The sample was targeted by sharing the survey on social media, such as Facebook, but also emailed to many. Thus, the convenience sample together with snowball sampling was used as they were seen as the most fitting sampling methods (Bryman & Bell, 2013). The main objective of using convenience sample was due to readily accessible information collection from research subjects for this study and because it is not known how well a convenience sample will represent this study, a diverse cross-section of ages, backgrounds, and nationalities was deliberately included to be able to concentrate on people with specific traits who will be better to assist with the relevant research (Etikan, 2016). These methods work well as social media is used widely no matter the age group, though it is used most by younger people. This might explain the higher percentage of younger respondents. This way, people who see the survey can share it, hence the snowball sampling method. The choice of method can, however, be seen in the responses as the countries where the authors are from and live in are of the highest rate. The data was collected with the survey for 12 days from the 29th of April 2020 to the 10th of May 2020. The survey covered 300 people from all over the world which was a more than expected number of respondents.
The survey was designed by researching previous literature. The survey used a six-point Likert scale ranging from ‘strongly agree’ to ‘strongly disagree’ to measure the level of agreement to the statements about the topic. The questions were conducted using the tri-component structural approach to attitudes, as it is important to uncover reasons for arising feelings and the type of actions they could result in (Evans, Foxall & Jamal, 2009). In this study, attitude towards advertising, ad irritation, ad humor, brand attitude (prior and post-exposure), purchase intention, and ad credibility were measured with the six-point Likert scale.
The questions stated in the survey are presented in Appendix A at the end of this paper. Therefore, for a description of the items used to measure the study variables mentioned above (see Appendix A). The questions were carefully created by researching studies that used the same scales (Likert scale) to make sure they were reliable to use in this study.
The first section of the survey begins with general questions about the participants: age, gender, nationality, location, education. This information will help us when analyzing the findings and to distinguish the differences between different age groups, gender, and culture. The second section of the survey consists of a general questioning of the respondent’s attitude towards advertising and if they believe advertising affects their purchasing intentions. These questions are providing the base for this research. To get more insight into the respondents' preferences, the questions were created specifically to fit each brand and to measure attitude toward the brands. Thus, the items for these questions were derived from mission statements found on the companies’ websites. Questions about three brands of the authors’ choice followed, such as, if they like to eat from the brand, how they perceive it, and if emotions are a part of the preference towards the brand. The questions about the specific brands were created by using scales to measure attitude toward a brand prior to seeing an irritating and funny advertisement.
The ads for the survey were chosen according to the criteria of having a focus on irritation, humor, and failed humor. Three advertisements of different brands in the food industry were presented to gain knowledge about brand perception. The first advertisement is the Burger King company which is a print advertisement of a molding burger stating, “The beauty of no artificial preservatives”. This way the brand was trying to convince consumers that they offer high-quality food. The Burger King advertisement is taking a humorous approach to making fun of other brands, but the overdramatized visual itself could be considered as irritating and being too invasive. The second advertisement is the Haribo company, which was aiming to attract consumers by displaying a humorous commercial of grown-ups talking in a childish manner with exaggeratedly high-pitched voices while eating Haribo candy. And the third company was KFC. In the commercial they showed an alive chicken strutting; however, KFC offers fried chicken tenders. Therefore, did this advertisement fail in humor, and was it inappropriate or irritating to see?
4.3.3 Data Analysis
The data collected from the survey was converted into a Microsoft Excel sheet and adjusted correctly when incorrect or inaccurate spelling parts of the data occurred. The analysis was conducted by using a descriptive analysis method where the data was described with bar charts, pie charts, and combination charts. The data collected was of the categorical data type, such as age and gender, but more specifically ordinal data as the Likert scale was used for the most part of the questionnaire. With ordinal data, you are aware of the relative position of each case within your data set, even though the numerical measures are not recorded (Saunders, Lewis & Thornhill, 2016). Despite this, some argue that this type of data can be analyzed as if they were numerical interval data (Bloomberg et al., 2014).
The data were analyzed with the comparative analysis method, as this study is of comparative design. In the case of a comparative study, social phenomena can be better understood when they are compared to two or more contrasting cases or situations (Bryman & Bell, 2013). Hence in this study, the three companies were compared to each other, according to the responses collected. The proportions of total occurrences of different categories were compared for the variables in question. Comparison enables the authors to test the theories across divergent settings and for the evaluation of the scope and significance of certain phenomena, thus contributing to the development of the universally applicable theory (generalization). (Esser & Vliegenthart, 2017) A comparative design allows the characteristics of the cases to act as a springboard for theoretical reflections about the contrasting findings, which illuminate existing theory as a result. (Bryman & Bell, 2013) Comparative proportional pie charts were used to compare proportions of a category and the totals for the variables (Saunders, Lewis & Thornhill 2016). The other types of charts used are a percentage component bar chart, as well as a multiple bar chart, as they are easy to compare with adjacent bars. It was also seen that it is easier to see changes in occurrences with a combination of a percentage component bar chart and a line graph. To entirely exploit general benefits that comparison brings, it is essential that the objects of analysis are compared to the common theoretical framework and that this is performed by drawing on similar conceptualizations and methods. Besides, that comparisons account for the fact that systems and cultures are not frozen in time; meaning, they are continuously changing under the effect of transformation processes, such as Americanization, Europeanization, globalization, modernization, or commercialization. This indicates that these transformation processes and different contexts affect the results in different ways. (Esser & Vliegenthart, 2017)
4.4 Validity and reliability
Validity is the measurement of the accuracy of the data collected. Another way to measure validity is to make sure that the methodology of the survey created is well designed to answer the research question. In this study, the research question is: What are the outcomes of humorous & irritating advertising on brand perception? The survey questions collected direct responses about brand perception since the survey participants were asked about their perception of humorous and irritating advertisement by asking their opinion in general about advertisements, their opinion before showing them the advertisements and after showing them. Thus, the data had internal validity and criterion validity since the questions aimed for results based on the information that was presented to the respondents, meaning we had content validity.
Reliability, on the other hand, measures the consistency of the data. An example is overtime reliability which explains the consistency of the data collected by getting the same results if the test was repeated (Heale, 2015). In this case, the items used in the survey are reliable and could be repeated. However, the results are affected by many factors such as time, age, education, background, and in general anything that influences a person's perception. This is why the answers might differ in each repeated study. Based on the authors’ assessment; the study has got high validity and reliability since the study has got large variability and variance which are seen to be valid. The survey asked about the age range, educational background, country of living, and nationality specifically to give the data more validation.
4.5 Limitations
method redefined the discourse of irritating and humorous advertising strategy to its application in different countries, regions, cultures, and the specified age groups. However, multi-culturalism might have an impact on the results as globalization and cultures affect the respondents’ perception of the type of advertisement used in different time ranges, advancement, and tolerance. Another methodology which the authors saw as an applicable option to collect data was the experimental research method and expert interviews which were quickly crossed out due to time limits and the global epidemic (COVID-19). The epidemic made the authors use the most convenient routes as meeting people was not an option during this time. The experimental method would have been based on showing different types of advertisements to a specific group which would have required resources that were not accessible in this period of time.
For this study convenience sampling was used which can create bias, sample errors, and little credibility but on the other hand it's based on first impressions, non-probable, saves time, is less costly, and helps collect data in a short time (Bryman & Bell, 2013). As Bryman & Bell (2013) state, “The data will not allow definitive findings to be generated, because of the problem of generalization, but they could provide a springboard for further research or allow links to be forged with existing findings in an area.”.
Humor changes within cultures. Therefore, humor should not be used generally in any form if the advertisers are not aware of the target audience. Thus, globally scaled advertising is trickier as the target audience is bigger which makes it more difficult to segment the audience (Alden, Hoyer & Lee, 1993). Gulas and Weinberger (2006) explain that humor can be implemented as a close to standardized package, but there is no one-size-fits-all model in humor.
The authors chose neutral based gender advertisements to avoid bias responses. The authors chose specifically to use advertisements from the food industry in order to get broad and
insightful data. If the survey was conducted in a different format it might be possible that the survey would present different data but have a worse response rate, as it would not be conducted online.
5 EMPIRICAL FINDINGS
In this section, findings will be presented, which was collected from the survey. The data will be presented in figures, with a short description of each figure.
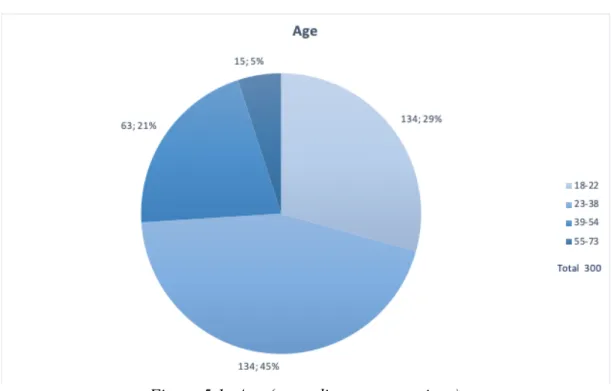
Figure 5.1: Age (according to generations)
Figure 5.1. illustrates the age of the respondents according to generations. The age of the respondents varied, a majority were Generation Y, while others consisted of Beneration Z, Beneration X and Baby Boomer Generation .
Figure 5.2: Gender
In this figure, the gender of the respondents is shown. The respondents were mainly women (66.3%), following men (33,3%) and a small percent of those who did not want to disclose their gender (0,3%).
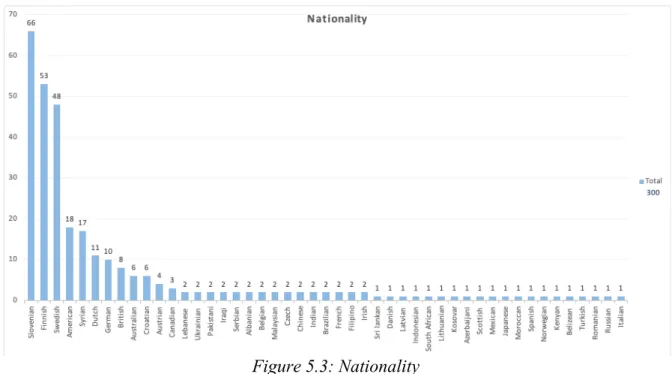
Figure 5.3: Nationality
The respondents appeared from diverse countries around the world, which were easy to reach for this study. Nationalities consist of Slovenian, Finish, Swedish, American, and so forth. It is
evident that the majority of the respondents consist of nationalities of which researchers or their connections are from.
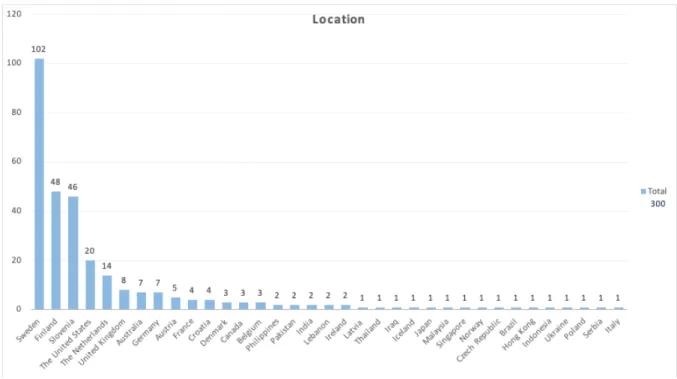
Figure 5.4: Location
Figure 5.4. shows the location of where respondents are residing. As in figure 5.3. the same implication applies regarding the respondents and why the nature of those responses is from those nationalities and countries. One may be of one or two nationalities but might reside in another, which may not comply with an individuals´ nationality.
Figure 5.5: Education
As seen in the figure, the education of the respondents was researched. This way, the complete survey was more reliable, regarding the corrected of the answers. Thus, as some individuals’ may not have completed education and therefore the researchers would question the reliability of this study.
The following figures will show the questions and responses of the participants when asked a general question about their perception of advertising.
Figure 5.6: Perception of advertising
From the figure above, it is seen that most of the respondents believe advertising, in general, is good, thus the respondents varied between slightly agree to strongly agree, while a smaller amount of the respondents opposes with the same statement.
Figure 5.7: Interest in advertising
As seen on the graph, it shows how the respondents react to a question about interest in advertising. Hence, amount of the responses was equal when slightly agree and agree and lower when strongly agree, which is shown by the figure. Similar to the previous figure, the amount of the responses was approximately equal when opposing to this statement.
Figure 5.8: Enjoyment of advertising
In this figure, it is seen how the respondents answered regarding the enjoyment of advertising in general, which shows that most of the respondents slightly agree (38%). Lower amount of the respondents opposes, meaning they do not like advertising as much.
Figure 5.9: Influence of advertising on purchase intention
Final question about advertising in general is indicating how the respondents answered when asked about the influence of advertising on purchase intention. The responses were identical when slightly agree and agree, which appeared to be 32% each. Here, and through previous questions, lower about of the respondents consistently opposed to the statements of advertising
The following questions were asked which include three different brands in the food industry in order to gain knowledge about respondents' preferences to those brands. These questions were formulated according to individual brand visions and statements.
Figure 5.10: Opinion about Burger King
This figure represents the respondents’ answers when asked about how they think about the brand and if they prefer it. Thus, their opinion about Burger King. It is shown that the respondents were alike with opposing and accepting this statement. Out of all, 23% of the respondents, which is the greatest amount, disagree that they like to eat Burger King.
Figure 5.11: Quality of Burger King
From the figure above is it seen how the respondents perceive the quality of the brand, which was asked to gain additional knowledge of brand preferences. The overall number of respondents oppose that Burger King serves high-quality food, while some may slightly agree. This shows that the respondents were aware that the Burger King is a fast-food restaurant which in turn reveals the negative answers.
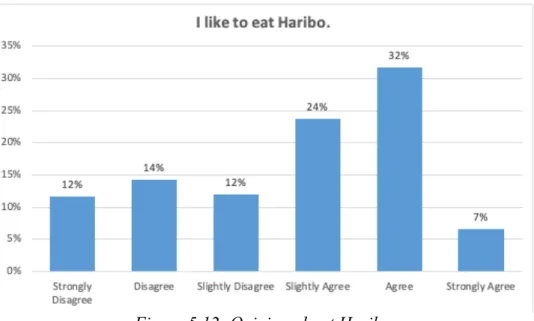
Figure 5.12: Opinion about Haribo
This question was made to understand how respondents think about the brand and if they prefer it. The figure shows that 32% of the respondents agree in this statement which is the larger
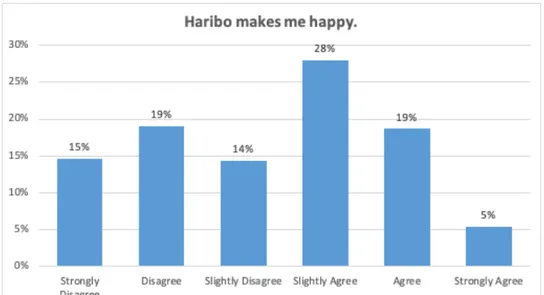
Figure 5.13: Emotional connection to the brand
To gain knowledge about respondents liking a brand, the question was asked corresponding to the brand vision itself. When asked if Haribo makes them happy, 28% of respondents slightly agree, while majority oppose this statement. This can occur due to the word “happiness” which is an emotion and in turn powerful.
Figure 5.14: Opinion about KFC
From the figure above, the respondents’ opinion about KFC is shown, which indicates that the opposing and accepting sides were similar but slightly different in the amount of the percentages of each variable. This implies that KFC is a fast-food restaurant, which explains negative
responses, but considering that the brand presents its products as fresh, this can explain the respondents’ answers who are positive about this statement.
Figure 5.15: Quality of KFC
In this figure, the opinion about the quality of KFC was questioned which shows that 28% of respondents disagree on this. The figure is visibly declining thus fewer respondents are accepting of this statement, which can also be clarified that KFC is a fast-food restaurant and may not be seen as high-quality.
Figure 5.16: KFC´s environment
Here, the respondents were asked about KFC´s environment. The figure shows that the majority of the respondents answered with slightly agree (28%). Thus, compared to those who oppose, 24% slightly disagree. The responses can be interpreted that some respondents never drew attention to the brands’ environment but mostly a product.
In this part of the questionnaire, the respondents were requested to answer the questions according to a specific advertisement presented. The following figures show three brands of which advertisements are compared according to humor, irritation, acceptance, influence, and persuasion. Burger King advertisement focused on irritation, as did the KFC, which also included attempted humor, while Haribo focused purely on being humorous.
Figure 5.17: Humor in the advertisement
As seen in the graph, Haribo shows a strong agreement that the advertisement is humorous, with 36% of respondents who answered with agree. Burger King, on the other hand, is not perceived as humorous, with 26% of the respondents strongly disagreeing, while for KFC 24% of the respondents did slightly agree and did find this advertisement somewhat humorous.
Figure 5.18: Irritation in the advertisements
In this figure, advertisements are compared according to the irritation. It is shown that Haribo advertisement was mainly seen as not irritating, meaning 34% of the respondents disagree that the advertisement was irritating. On the contrary, the majority also disagree that Burger King advertisement was irritating, moreover similar result appeared for KFC of which 24% disagree in the same statement. Reason for this could be that irritation leads to a stronger emotion, which was not the case for these respondents.
Figure 5.19: Acceptance of the advertisements
This figure reveals how favorably the respondents react to a certain advertisement and it is shown that 30% of the respondents agree and react to the Haribo advertisement favorably. Secondly, the respondents disagree and do not respond favorably to the Burger King advertisement. However, the respondents also oppose to the KFC advertisement and disagree with the statement. These findings could be clarified that the respondents saw an advertisement once and did not feel connected or reacted in any way to the advertisement unless it was humorous.
Figure 5.20: Positive or negative influence of the advertisements towards the brands
In this figure, the respondents were asked if the advertisement made them feel positive about the brand. It is seen that the respondents disagree that Burger King advertisement made them feel positive about the brand, which corresponds to 30% of the responses. On the contrary, 27% of the respondents agree that Haribo made them feel positive, which is shown by 27% of the respondents. However, when asked about KFC, 27% of the respondents disagree that the brand made them feel positive; thus, they felt negatively towards the brand.
Figure 5.21: Persuasion of the advertisements
In this figure, it is presented if the advertisements were convincing. 31% of the respondents disagree that KFC advertisement is convincing, following Haribo where 27% respondents slightly agree in this statement. However, 26% respondents disagree that Burger King advertisement was convincing. This can be explained due to the fact that Haribo advertisement was humorous, while Burger King was in print media.
Figure 5.22: Opinion about Burger King before and after seeing the advertisement
strongly disagree to recommend Burger King after seeing an ad, compared to 68 (23%) before seeing an advertisement. When recommending 57 (19%) of the respondents slightly agree before an ad and 50 (17%) after seeing it. The least amount of the respondents 10 (3%) would strongly agree in recommending before seeing an ad and 7 (2%) after it.
Figure 5.23: Opinion about Haribo before and after seeing the advertisement
Two questions were asked about the recommendation of the brand to a friend, before and after seeing the advertisement. From this figure, it is seen that most of the respondents slightly agree 75 (25%) and agree 77 (26%) to recommend Haribo to a friend before seeing an advertisement. After seeing the advertisement, 68 (23%) slightly agree and 58 (19%) agree.
Figure 5.24: Opinion about KFC before and after seeing the advertisement
From this figure, it is visible that 72 (24%) respondents disagree with recommending KFC before seeing an ad, compared to 102 (34%) respondents who also disagree in this statement, after seeing an ad. 52 (17%) respondents strongly disagree before seeing an ad and 70 (23%) strongly disagree after.
6 DISCUSSION
In this chapter, the empirical findings are analyzed by reflecting on the theoretical framework. The discussion starts with the general part of the survey, and further, it is divided into part of deeper analysis.
6.1 Type of respondent
This paper is studying the effect of irritating and humorous advertising on brand perception. This study was conducted by the use of a survey of 300 respondents from different countries around the world. Nearly 66% of the participants were European and the other 34% were from other continents (Figure 5.3). Over half of the respondents were women, while 33% were males and 1% identified as others (Figure 5.2). This should not affect the study because the authors chose advertisements from the food industry that were gender and age-neutral so that they are easily applicable to all people. In age, there was a significant difference between the participants 74% of the respondents were under 40 years old and only 5% were over 55 years old (Figure 5.1). The age difference affects the way respondents would answer questions in the survey because different generations have dissimilar cognitive perceptions of their surroundings. This leads to young people perceiving humor and information differently from older people which in turn affects brand perception and consumer behavior between generations (Ardila, et al., 2000). Additionally, some of the respondents might be customers but not consumers of the product. The difference between a customer and a consumer may result in different brand perceptions and a variety of answers to the survey since a consumer gets influenced by the usage of the product (Nair, 2009). To go into more detail, figure 5.5 shows that 78 % of the participants had a higher education than high school, while 22% had a high school education or lower. Educational background may play a role in how a person understands and how open they
are. As a person with higher education tends to think differently. People with a higher educational background tend to analyze and perceive data and information differently than people with lower education (Ardila, et al., 2000). The participants were in favor of advertising in general when first asked about it and they thought that it is a great tool that companies can use to promote a product or service. Almost 75% always was in favor of advertising in every question (Figure 5.6-5.8). This could have skewed the study into a more positive direction than if the respondents had been against advertising. Lastly, most respondents (75%) agreed that advertising affects their purchasing decisions (Figure 5.9). It shows that people already are aware that they are influenced by advertising.
6.2 Burger King
The brand perception that respondents have about Burger King is already negative before seeing the advertisement (Figure 5.10 & 5.11). The Burger King advertisement shown to the respondents was not perceived in an intended way. Thus, this advertisement was a failed attempt at humor as over half thought that the advert was not funny (Figure 5.17) and they were divided about the fact if it was irritating or not (figure 5.18) (Gulas & Weingberger, 2006). Irritation for advertising differs depending on a personal perspective, maybe some people did not perceive it to go against their logic norms enough to be considered absurd (Warren, Barsky & McGraw, 2018). The respondents found the advert to be confusing as the attitude towards it was very mixed and reacted to the ad in a negative way (Figure 5.19). Even though the meaning of the advertisement was to make consumers see the brand in a positive light, people seemed to not understand the humor in it, and it harmed the brand perception and consumer behavior (Figure 5.20 & Figure 5.21) (Moriarty, Wells & Mitchell, 2012). If people see the brand in a negative light, people do not intend to purchase it. Most respondents would not recommend