J
Ö N K Ö P I N GI
N T E R N A T I O N A LB
U S I N E S SS
C H O O LJÖNKÖPING UNIVERSITY
The Return of VC/PE Funds Financed
Projects in China:
An empirical study of the years 2009 to 2011
Bachelor Thesis within Finance
Author: Yinqiao Fu, 900702-3659
Tutor: Agostino Manduchi, Assistant Professor Sofia Wixe, Ph.D Candidate
Table of Contents
1 Introduction ... 1
2 The VC/PE Industry and Stock Market ... 3
2.1 The Definition of Venture Capital and Private Equity ... 3
2.2 The History of China’s VC/PE industry before 2000 ... 4
2.3 China’s VC/PE industry after 2000 ... 5
2.4 China’s Stock Market and Regulation ... 6
3 Literature Review ... 8
3.1 Macro Factors ... 8
3.2 The Overall Quality of VC/PE Funds ... 9
3.3 Industries and Sectors ... 9
3.4 Investment Duration, Funding Scale and Fund Size ... 10
3.5 The Overall Quality of Financed Projects ... 10
3.6 Other Factors ... 11
4 Theoretical Framework and Hypotheses ...12
4.1 Knowledge and Experience ... 12
4.2 External Relationship and Syndication... 13
4.3 Investment Duration ... 14
4.4 Investment Scale ... 17
4.5 Ownership Type and Institutional Environment ... 17
4.6 Geographical Perspective ... 18
5 Data and Methodology ...20
6 Regression and Analysis ...24
6.1 Model and Regression ... 24
6.2 The Analysis of Statistical Results ... 25
7 Conclusion ...27
8 References ...28
9 Database ...33
Bachelor Thesis in Finance
Title:
The Return of VC/PE Funds Financed Projects in China: An empirical study of the years 2009 to 2011Author:
Yinqiao Fu, 900702-3659Tutors:
Agostino Manduchi, Assistant Professor Sofia Wixe, Ph.D CandidateDate:
January 2013Keywords:
Venture Capital, Private Equity, investment, IPO, returnAbstract
This paper presents an empirical study of the determinants that drive the investment performance of China’s venture capital (VC) and private equity (PE) funds. Using data on VC/PE funds backed initial public offerings (IPOs) from ChiNext between October 2009 to October 2011 and the internal rate of return (IRR) as the measurement for investment performance, this paper finds that fund experience has a positive influence on investment performance whereas investment scale and investment duration have a negative influence on investment performance.
1. Introduction
The venture capital (VC) and private equity (PE) industry is playing an essential role in corporate finance and thus influences the global financial markets and the world economy (Robbie and Mike, 2003). Nearly 187.4 billion USD of private equity investment was invested globally in 2010, according to Ernst & Young. As for the venture capital industry, 45.6 billion USD of venture capital investment was invested in 2010 globally with an annual growth rate of 33.3 percent, according to Dow Jones VentureSource. The total investment in the global VC/PE industry in 2010 was equivalent to 1.55 percent of the total gross domestic product (GDP) of the United States in 20101.
The past performance of funds is a vital indicator of their capability to attract investors (Gompers, 1996) and potential investors often refer to it when making investment decisions (Nagy and Obenberger, 1994). It is thus crucial to study the performance of VC/PE funds. The purpose of this paper is to analyze the influence of key determinants on the investment performance of the VC/PE funds in China. Funds’ knowledge and experience, external relationship, investment duration, investment scale, ownership type differences and headquarter location differences are the key variables in the empirical study of this paper. Based on data on China’s VC/PE funds financed projects that exited through the initial public offerings (IPOs), individual investment performance is measured by the internal rate of return (IRR) in order to interpret the fund-level performance. The main contribution of this paper is the empirical understanding of the strong factors that drive the investment performance of China’s VC/PE funds. These crucial performance determinants are not only valuable for the decision making process of potential investors and our understanding of the common characteristics of successful investments but also helpful for the future development of China’s VC/PE industry.
Generally, the business model of VC/PE funds starts with project screening (Zacharakis and Meyer, 2000). First of all, to identify the valuable firms with outstanding attributes, VC/PE funds must go through thousands of proposals they have received to evaluate which deserves further consideration. Those ventures that stand out from the first stage then advance to the due diligence stage (Zacharakis and Meyer, 2000). VC/PE funds will carry out a rigorous evaluation process, including the due diligence process, to assess the core commercial value and the business idea of the firm, the capabilities of its core management team, the feasibility and maturity of its revenue model and its key competitive advantages (Camp, 2002). After signing term sheets and contracts with the VC/PE funds that provide capital, a financed firm is able to use the investment to expand its business. Meanwhile, the VC/PE funds will monitor the financed firm as well as provide it with extensive range of value-added services such as financial consulting services and network resources (Gompers, 2012; Hsu, 2005). The best investment outcome for the VC/PE funds is to exit at an optimal
1
point after the commercial value and hence the valuation of the financed firm have risen up (Lerner, 1994a). However, VC/PE funds may receive little or no returns on their investments if there is a bankruptcy liquidation (Mann and Sager, 2007).
VC/PE funds have four major ways to exit and realize returns: IPO, acquisition and merge, sale of equity (including buyback from the financed firm and sale to other investors) and bankruptcy liquidation (Mann and Sager, 2007). The performance of VC/PE funds is the result of the aggregated returns of financed projects that exited through all these methods, and therefore it is comprehensive to study the performance on a fund level. However, this paper will only focus on the performance of China’s VC/PE funds financed projects that exited through IPOs for the following three reasons. First, data on exit methods other than IPO in China is extremely difficult to obtain for research. Second, Cumming and MacIntosh (2003a) point out that IPOs are the core of the venture capital investment process and the most frequently selected exit methods for high quality firms. Third, Black and Gilson (1998) argue that IPO is the most important and profitable exit method and the primary driver of the development of the VC/PE industry.
2. The VC/PE Industry and Stock Market
According to the database of the National Bureau of Statistics of China, China is developing rapidly with an average annual GDP growth rate of 9.6% between 1979 and 2004. China is now becoming one of the most promising markets for the VC/PE industry (Pukthuanthong and Walker 2007). Despite the fundraising growth in China’s VC/PE industry, much is still not known about the VC/PE funds there (Ahlstrom et al, 2007). Since VC/PE funds are playing essential roles in many well-known firms (such as the recent listed firms Baidu and Tencent on the New York Stock Exchange), Chinese investors are interested in why those VC/PE funds are crucial for those giant firms and how they function. In addition, investors are attracted by the recent disclosures of the profit and fund size of China’s VC/PE funds and are wondering why a huge amount of money has been invested in this industry and how the VC/PE industry in China can earn windfall profits.
2.1 The Definition of Venture Capital and Private Equity
The primary difference between venture capital funds and private equity funds is that venture capital funds are not interested in the control of financed firms for which private equity funds seek (Kelly, 2012). Although some private equity funds also invest in financed firms without intentions to control, private equity funds typically concentrate on firms that are in the mature stages such as the expanding stage or the pre-IPO stage (Robbie and Mike, 2003). In contrast, venture capital funds typically focus on firms that are in the early stages such as the seed stage or the infancy stage (Kelly, 2012). Although the broad definition of private equity includes both venture capital and buyout (Weidig and Mathonet, 2004), the narrow definition excludes venture capital. This is also why private equity fund is often called private buyout fund or simply buyout fund (Kaplan and Schoar, 2005) whereas venture capital investment is typically defined as the long-term equity investment by professional investors in newly established firms where the primary rewards are ultimate capital gains and dividend yields (Robbie and Mike, 2003).
It is thus common to differentiate between private equity and venture capital in research such as Metrick and Yasuda (2010) who find vast differences between venture capital funds and buyout funds. They report that depending on past experience, buyout managers enlarge the size of their funds faster than venture capital managers do. This leads to higher returns per partner in buyout funds that focus on the later stage investment.
Despite of those differences, both venture capital and private equity refer to capital that is not quoted on a public exchange and VC/PE funds make investments directly into private firms (Black and Gilson, 1998; Jeng and Wells 2000). Capital for VC/PE funds is raised from retail and institutional investors and can be used to finance R&D, bolster business expansions or increase a firm’s working capital (Lerner and Schoar, 2004). Many scholars in the Western world and China, such as Cao and Lerner (2009)
and Xin and Zhang (2011), find that the boundary line between venture capital and buyout funds is increasingly obscure. They point out that private equity funds that normally made buyout type of investments in the past also often engaged in venture capital investments. As a result, people are not able to define the deal type just by evaluating the characteristics of the investors (Cao and Lerner, 2009).
As a result, this paper will not differentiate between venture capital funds and private equity funds or use control variables to study their differences because the boundaries between them are extremely blurry in China (Xin and Zhang, 2011), as noted by Cao and Lerner (2009). Like private equity funds in other countries, most of private equity funds in China focus on the pre-IPO investment or the later stage investment. However, traditional venture capital funds in China are also becoming interested in the later stage investment (Zang, 2009). An interpretation of this phenomenon is that the number of potential technological innovation projects in China is not sufficient for all the domestic venture capital funds and they are not able to invest in other countries because of the high costs related to the barrier to international investment (Stulz, 2012). As a result, these domestic venture capital funds invest idle funds into traditional industries. For private equity funds, the situation is the same. They are looking for all the profitable business opportunities including venture projects to spend their idle funds. For instance, according to the latest official disclosures from several well-known VC/PE funds, the private equity giant Carlyle Group also sets foot in venture capital investment in China such as the investments in Xicheng.com and Target Media Holdings Limited2.
2.2 The History of China’s VC/PE industry before 2000
China’s financial system for new ventures to raise capital has emerged over the last two decades in the context of China’s excruciating transition from centrally-planned economy to more market-based economy (White et al, 2005). The VC/PE industry in China started in 1985, when the Chinese government established the first state-owned venture capital firm called China New Technology Startup Investment that went bankrupt in 1997. The first foreign venture capital fund IDGVC Partners entered China in 1992 (Ahlstrom et al, 2007).
Despite early failures, an increasing flow of support from the Chinese government to the VC/PE industry can be observed. The starting point of the government policy support is 1998 when one of the most well-known proposals promoting the VC/PE industry was announced (Yang and Ma, 1999). According to the historical record of the Chinese People's Political Consultative Conference, the name of the proposal is “Accelerate the development of venture capital industry”.
2
2.3 China’s VC/PE industry after 2000
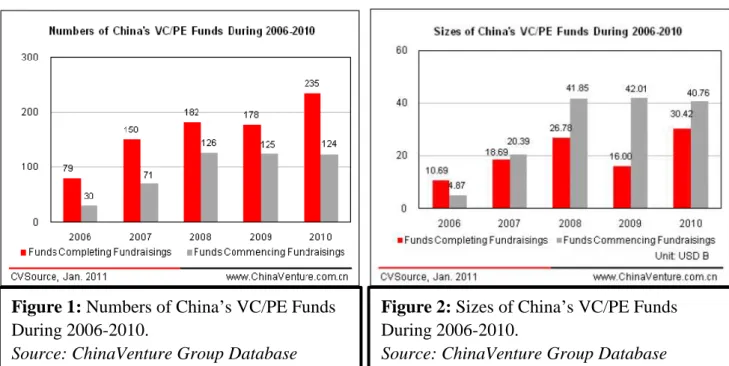
After the burst of the Dot-com bubble in 2000, China's VC/PE industry, supported by several government policies announced since 1998, has started to thrive with the new investment focus, clean-tech, energy and material industry (Wang and Liang, 2008). According to the database of ChinaVenture Group, in 2010 China's venture capital investment industry disclosed 804 deals involving a total investment amount of 5.668 billion USD, increased by 65.1% in the deal number and 93.3% in the total investment amount respectively compared with the data in previous year. The total investment amount exceeded the record peak seen in 20083. In the meantime, China’s prosperous capital market witnessed a total of 375 disclosed private equity investment deals involving a total investment amount of 19.613 billion USD in 2010, increasing by 114.0% in the deal number and 16.1% in the total investment amount respectively compared with the data in previous year, and hitting their respective record peaks4. The development of China’s VC/PE industry in recent years is shown in Figure 1 and Figure 2 below.
Figure 1 and Figure 2 show that the number of China’s VC/PE funds and fund size keep increasing these years, from 79 funds and 10.69 billion USD completed fundraisings in 2006 to 235 funds and 30.42 billion USD completed fundraisings in 2010. However, the industry is greatly influenced by the financial crisis in 2008 and therefore we can observe a significant downturn in 2009, with 16.00 billion USD completed fundraisings in 2009 compared to 27.78 billion USD completed fundraisings in 2008.
3
The former record peak is USD 5.40 billion seen in 2008 4
The former record peak is 234 deals seen in 2007 and USD 16.89 billion seen in 2009
Figure 1: Numbers of China’s VC/PE Funds During 2006-2010.
Source: ChinaVenture Group Database
Figure 2: Sizes of China’s VC/PE Funds During 2006-2010.
Figure 3 and Figure 4 show that the investment scale is increasing over time, from 3.86 billion USD venture capital investments and 10.88 billion USD private equity investments in 2006 to 5.67 billion USD venture capital investments and 19.61 billion USD private equity investments in 2011. However, the industry was influenced by the financial crisis in 2008 and 2009, and the downturn is particularly evident in the venture capital industry that the investment scale plunged from 5.40 billion USD in 2008 to 2.93 billion USD in 2009. According to the database of ChinaVenture Group, TMT (Technology, media and telecommunications), Manufacturing, Healthcare and Energy remained the most popular sectors for venture capital investments in 2010. As for private equity investments in 2010, they were scattered in 20 sectors, with Manufacturing, Energy and Healthcare being the top three deal winners.
2.4 China’s Stock Market and Regulation
There are two stock exchanges in China: the Shanghai Stock Exchange and the Shenzhen Stock Exchange. Before 2009, firms could only go public on the Main Board or the Small and Medium Enterprise Board (SEM) in the stock exchanges. The currency used in China’s Stock Market is Renminbi (RMB). The primary conditions for listing on the Main Board or the SEM are:
1) Realized positive profit in the recent three financial years with an accumulated profit of at least 30 million RMB;
2) The accumulated operating net cash flow is at least 50 million RMB in the recent three financial years, and the accumulated operating revenue is at least 300 million RMB in the recent three financial years;
3) The proportion of intangible assets to net assets should be less than 20%. Figure 3: Domestic VC Investment Scales
During 2006-2010.
Source: ChinaVenture Database
Figure 4: Domestic PE Investment Scales During 2006-2010.
The situation shifted in 2009. The China Securities Regulatory Commission introduced its first ever Growth Enterprise Market named ChiNext in the Shenzhen Stock Market on October 23rd, 2009. This is a milestone for China’s VC/PE industry. Before the foundation of ChiNext, it was hard for VC/PE funds financed firms in China to exit through IPOs on the Main Board or the SEM because of those strict conditions. For ChiNext, the conditions for listing are much lower since the primary conditions changed to:
1) Realized positive profit every year with an accumulated profit of at least 10 million RMB and positive annual growth rate in the recent two financial years; 2) The profit in the latest financial year is at least 5 million RMB with at least 50
million RMB operating revenue, and the annual growth rate of operating revenue should be at least 30%;
3) The net asset at the end of latest financial year is at least 20 million RMB. Since China is during its transition from a central-planned economy to a market economy (Chow, 2002), there are two important regulations for the stock market decreed by the China Securities Regulatory Commission. These two regulations might significantly influence the study presented in this paper.
Firstly, according to Article 5.16 of Chapter V of “Shenzhen Stock Exchange Listing Rules - 2012”, “the shares subscribed by all the controlling shareholders or actual controllers of the enterprise it controlled shall not be transferred to others within 36 months after IPO and the enterprise shall not buy back their shares.” This regulation means that VC/PE funds are forbidden to sell any of their shares within three years after the date of IPO. The purpose of this regulation is to back up the stock market in case of a huge stock price downturn of the newly listed firm and to stabilize the stock market as well as to protect the subscribers of the new shares.
Secondly, in June 2009, the Ministry of Finance, the State-owned Assets Supervision and Administration Commission, the China Securities Regulatory Commission and the National Council published No.94 Notice for Social Security Fund named “About Issuing the Implementing Measures for the Transfer of Some State-owned Shares from the Domestic Securities Market to the National Social Security Fund”. Article 6 of Chapter II states that “after the implementation of the policy of separating the new from the old in the share-trading reform, a joint stock limited firm with state-owned shares which makes IPO and gets listed in the domestic securities market shall, unless it is otherwise provided for by the State Council, transfer some of its state-owned shares to the National Council for Social Security Fund, namely 10% of the actual number of the IPO stocks. If the number of shares held by the state-owned shareholder is lower than the number of shares which should be transferred, the transfer shall be made on the basis of the number of the shares actually held by it”.
3. Literature Review
Many scholars, such as Cumming (2001, 2003a, 2003b and 2010) and Lerner (1994a, 1994b, 2002, 2004 and 2012), did extensive research on the VC/PE industry in other countries. However, the literature in this field is very limited in China, especially the studies on fund performance. Two possible explanations can be given. First, VC/PE is a young industry in China and thus scholars did not pay much attention into analyzing its performance so far. Second, it is very hard to access data of this industry because almost no funds are willing to disclose their investment data.
To study the performance of China’s VC/PE funds backed projects, this paper will first review previous literature in this section. Previous research topics of fund performance can be divided into three categories:
1) The performance of individual VC/PE investment projects.
2) The performance of VC/PE funds from a general partner (GP) perspective (return before all other management expenses and fees).
3) The performance of VC/PE funds from a limited partner (LP) perspective (return net off all other management expenses and fees).
The literature on the last category will not be presented since management expenses and fees that influence fund performance are not the focus of this paper, and therefore this paper will only analyze gross-fee performance.
3.1 Macro Factors
Macro factors are found to be significant in driving fund performance. Based on the market prices of exchange traded funds of funds (FOF) that invest in unlisted private equity funds, Jegadeesh et al (2009) find that the projected returns of private equity funds are positively correlated with GDP growth rate and negatively correlated with credit spread. In the venture capital industry, Gottschalg et al (2003) find that venture capital fund performance (measured by profitability index: the present value of cash inflows divided by the present value of cash outflows) is sensitive to business cycles. Using several valuation models, Peng (2001) and Hwang et al (2005) compute two different venture capital indices and derive the correlation between the indices and public stock market indices. Bygrave and Timmons (1992) also report that the performance of venture capital funds is influenced by economic cycles and varies in different time periods.
To summarize, the literature presented above shows that macro factors such as GDP growth rate, credit spread and stock market index might influence the investment performance of China’s VC/PE funds.
3.2 The Overall Quality of VC/PE Funds
The overall quality of VC/PE funds – measured by variables such as fund experience, professional knowledge and capability of providing value-added services – was studied by many scholars. For instance, Kaplan and Schoar (2005) find that GP’s experience is a key determinant of fund performance (measured by IRR). They find that performance increases with GP’s experience. In the study of venture capital funds in the United States and Europe, Hege and Palomino (2003) measure the fund performance in two ways: the type of exit methods and the IRR of investment projects. They find a result similar to Kaplan and Schoar’s study (2005), and they interpret the result that U.S. venture capital funds perform better than European funds is because U.S. funds have greater experience, which leads to better screen skills.
Mason and Harrison (2002) report that venture capital funds could provide financed firms with value-added services such as finance, strategy, market and management. Gompers and Lerner (1999) find that venture capital funds strengthened the relationship between financed firms and other venture capital funds, law firms, accountancy firms and investment banks. Large and Muegge (2008) also find that the key factor that influences the returns of venture capital funds (measured by IRR) is the value-added services that funds are able to provide. Nevertheless, Fan (2012) chooses to study the overall quality of venture capital funds rather than just GP’s experience, and he measures the quality of funds by variables such as network (the number of other venture capital funds that this venture capital fund has cooperated with before the current round of investment).
To sum up, the literature indicates that fund experience, knowledge and value-added services that funds are able to provide might influence the investment performance of China’s VC/PE funds. The theories for experience and knowledge will be reviewed in section 4.
3.3 Industries and Sectors
More than half of the total GDP in the developed countries is related to high-tech industries such as internet, telecommunications, clean technology and biotechnology industries, according to the report of Organization for Economic Cooperation and Development (OECD) in 2010. High growth rates are a remarkable characteristic of firms in high-tech industries. This high-growth nature of technology-based industries distinguishes them from traditional types of industries such as textile and material industries. Firms in high-tech sectors normally grow much faster than firms in traditional industries in the early phase (Kohers, 2000), which results in higher return on capital (ROC) ratio. Since most venture capital funds typically concentrate on early stages high-tech projects to seek high returns with relatively short investment duration, industry variance is found to be valuable in explaining the performance of VC/PE funds with different investment focus on high-tech sectors or traditional sectors.
For instance, Fan (2012) reports in his research on Chinese venture capital funds that the main variable that may affect the quality of a financed firm and hence influence the investment performance (measured by the type of exit methods) is the industry that the financed firm belongs to. However, Kaplan and Schoar (2005) suggest that industry does not drive investment performance, and Mason and Harrison (2002) also report in their empirical study on UK angel investments that the rate of return (measured in terms of the book rate of return and the length of the holding period) in high-tech industries is not significantly different from traditional industries.
The literature points out that the industry to which the financed firm belongs might have dramatic impact on the performance of China’s VC/PE funds. Financed firm’s industry will be used as a control variable in the empirical study of this paper.
3.4 Investment Duration, Funding Scale and Fund Size
There is a large literature on how investment duration, funding scale and fund size are correlated with investment performance. For instance, Cumming and MacIntosh (2001) find that as the investment duration increases, the marginal benefit that the funds obtain from providing value-added services will decrease. As a result, as the investment duration exceeds a certain length, the rate of return (measured by the type of exit methods) might be lower.
In the research on Chinese venture capital funds, Fan (2012) finds that funding scale (the total amount of capital raised in the current round for the financed firm) is a key determinant driving investment performance (measured by the type of exit methods). Moreover, Kaplan and Schoar (2005) find that fund size is a key determinant of fund performance. They observe that investment performance increases with fund size and conclude that the relationship between investment performance and fund size is concave, suggesting diminishing returns to scale.
The literature shows that investment duration, funding scale and fund size might influence the investment performance of China’s VC/PE funds. The theories for investment duration and investment scale will be reviewed in section 4.
3.5 The Overall Quality of Financed Projects
The overall quality and the stages of financed projects are found to be correlated with investment performance. Large and Muegge (2008) find that the overall quality of the financed firm influences the investment performance of venture capital funds. They conceptually proposed the capabilities of eight categories of activities to measure exit success: the ability of legitimation, outreach, recruiting, mandating, strategizing, mentoring, consulting and operating. Fan (2012) also reports his findings of Chinese venture capital funds that the quality of the financed project is the primary factor that affects investment performance. He measured the quality of the financed firms by two major variables: the ownership type of the venture capital funds and the location of the financed firm’s headquarter.
As for the studies on the stages of financed firms, Robbie et al (1998) find that the performance of the infant-stage-oriented venture capital investments is poorer than the performance of the investments in other stages. Burgel (2000) also finds similar results. However, Kaplan and Schoar (2005) report that the stage differences among financed firms do not drive the results.
The literature shows that the financed firm’s quality might drive the investment performance of China’s VC/PE funds. Ownership type and headquarter location will be studied in this paper.
3.6 Other Factors
There are many other factors that have been proved to be significant in driving investment performance. For instance, Hege and Palomino (2003) find that syndication is an influential factor that explains the performance difference between venture capital funds in the United States and in Europe. Similarly, Fan (2012) finds that syndication is an indicator of investment project quality (the number of institutional investors invested in the current round of investment).
Hege and Palomino (2003) also find that when fund performance is measured by IRR, the ratio of series A round investment over the total discounted investment is larger in the United States than in Europe and has a significant impact on investment performance.
Although most of these other factors will not be studied in the empirical study of this paper because of data limitations, the theories for syndication will be reviewed in section 4.
4. Theoretical Framework and Hypotheses
In this section, economic theories for knowledge, external relationship, investment duration, investment scale, ownership type and geographical location will be reviewed to establish the main hypotheses for the empirical study.
4.1 Knowledge and Experience
The knowledge-based theory indicates that firm performance is closely tied to the capabilities that the firm has to effectively convert knowledge internally or externally into operation (Zahra and George, 2002). By definition, knowledge is everything acquired and assimilated by an institution or an individual (Nonaka and Takeuchi, 1995) and firms enrich their knowledge by a learning process based on either direct experience (internal) or indirect experience from others (external). Since firms are able to convert prior experience into knowledge and discipline that influence future behavior (Huber, 1991), learning is playing a primary role in building competitive advantage and it enhances not only a firm’s average performance but also the capability to maintain that performance (Levinthal and March, 1993).
Three underlying logical relations can elucidate why knowledge accumulation is so important for the success of a firm in a specific field and therefore improves its performance in that specific field. First of all, deeper knowledge provides a firm with a more comprehensive grasp of the new experience it obtains (Cohen and Levinthal, 1990). This better understanding strengthens the firm’s capability to distinguish valid information from new experience and to convert it to knowledge (Katila and Ahuja, 2002). Secondly, deeper knowledge helps the firm better understand its particular field and stimulates more active interaction and more efficient coordination within its knowledge base. Based on this capability, the firm is able to utilize its knowledge to solve a broader range of problems. Thirdly, the process of knowledge acquisition increases the firm’s capabilities to absorb and digest new knowledge that the firm can apply to operations (Van den Bosch et al., 1999) and therefore automatically builds up a systematic learning process that enables the firm to exploit new knowledge more efficiently in the future (Zahra and George, 2002).
As for VC/PE funds, they acquire knowledge from past experience in investment management to enhance their competency in screening, assessment and governance of their portfolios. However, this section only focuses on the importance of internal knowledge – the experience that a fund converts into knowledge by itself – to explain VC/PE funds’ performance. The internal knowledge increment is measured by the time since fund foundation date, which implies that as a fund works in its specific field longer, it accumulates more experience and obtains more effective knowledge in operation such as projects evaluation and portfolio management.
Although using diversification is the basic way to reduce unsystematic risk, this paper argues that internal knowledge and self-accumulated experience are especially
significant for the risk management of VC/PE funds and hence is important to study their impact on investment performance. Debatably, although risk management is able to minimize and control the probability of portfolio failure, knowledge acquisition enhances the success rate of investment projects (Dimov and Shepherd, 2005). The lessons VC/PE funds have gained from their past experience in portfolio management enhance their expertise in governing current projects, which results in better investment performance (De Clercq and Sapienza, 2006). The line of reasoning leads to the following hypothesis:
Hypothesis 1
Fund experience, measured by the time from fund foundation date to investment date, positively influences investment performance.
4.2 External Relationship and Syndication
Firms seek outside sources of knowledge beyond their expertise and convert it into their own knowledge (Grant and Baden-Fuller, 2003). Based on collaboration and knowledge interchange with external partners, a firm is able to increase its capability in external knowledge conversion, which eventually leads to better performance (Lane and Lubatkin, 1998). Nonetheless, Grant and Baden-Fuller (2003) find that although the majority of leaning processes occur in the context of inter-organization relations, simply access to outside sources of knowledge gives a firm an equally essential impetus of many cooperation agreements and significantly influences its revenue performance, regardless of whether the firm intends to or has the ability to convert external knowledge into its own knowledge.
Based on previous studies, this paper contends that as a firm builds external partnerships, the knowledge that the firm lacks will be provided by those external partners (Grant and Baden-Fuller, 2003). That is to say, cooperation with more external partners suggests that the firm is able to absorb knowledge from a bigger pool, which ultimately increases the firm’s capability to apply knowledge to business operation (Grant and Baden-Fuller, 2003). In addition, studies on network indicate that wider networks bolster firm performance since external resources give a firm knowledge and skills that the firm may not possess (Burt, 1995). For instance, Liebeskind et al (1996) report that strong networks of inter-personal communication help newly established biotech firms perform better thanks to their external sources of sophisticated biotechnologies.
The arguments above suggest that the number of external partners positively influences firm performance. In the case of VC/PE syndication, two explanations can be given here to elucidate why the number of external partners positively drives investment performance. Firstly, the evaluation process of potential projects will result in deals with higher quality since syndication increases the overall quality of projects pool (Sorenson and Stuart, 2001) and will lead to more rational investment decisions because different funds are influencing the decision making process (Lerner,
1994b). Secondly, syndication leads to a broader range of value-added services that VC/PE funds can provide because all the external partners add extra necessary knowledge into the investment project (Brander et al., 2004). Since each member of the syndication team has unique expertise that is valuable for the investment project (e.g. sourcing potential customers and introducing new investors), if all other conditions do not change, increasing the number of external partners results in a larger knowledge pool that a financed firm can utilize. Based on the assumption that no members of the syndication team are free riders (i.e. partners that contribute nothing to the project but still earn profit), it is appropriate to make the second hypothesis below.
Hypothesis 2:
Syndication, measured by the number of VC/PE funds invested in the current round of investment, positively influences investment performance.
4.3 Investment Duration
Based on previous literature, this paper find that information asymmetry and diminishing marginal benefit are the two major views to explain how investment duration influences investment performance.
Diminishing Marginal Benefit with Option Theory
The effect of diminishing marginal benefit on investment performance was studied by many scholars (Cumming and MacIntosh, 2001; Giot and Schwienbacher, 2007; Cumming and Johan, 2010). They argue that once a financed firm’s expected marginal benefit (EMB) – the expected marginal value added to the financed firm’s valuation – generated from the value-added services provided by VC/PE funds exceeds the VC/PE funds’ expected marginal costs (EMC) from maintaining that investment project, investment performance will decrease. Referring to Cumming and Johan’s study (2010), the relationship between EMB and EMC is shown in Figure 5 and the accumulated investment costs and benefits are shown in Figure 6. The X-axis represents the time line where Exit0 and Exit1 are the time points at which the VC/PE funds choose to exit.
According to Cumming and Johan (2010), EMB is usually large at the beginning of the investment period and declines as time passes and the financed firm develops. A newly established firm normally has scarce resources and networks to seek business opportunities and beneficial advice, and VC/PE funds are able to provide these resources for the firm at its infancy stage. As a result, EMC is normally large but declines over time as the financed firm matures and benefits from the approximately unchanged resources and knowledge provided by the VC/PE funds. EMC also diminishes over time since the VC/PE funds devote much more effort at the beginning of the investment period to help the financed firm expand on the right way as soon as possible. However, the EMC will start to diminish more slowly than the EMB after some time point since the EMC consists of fixed costs while the VC/PE funds pay less effort into the investment project as the financed firm matures. As a result, Cumming and Johan (2010) suggest that once investors have missed the optimal point (when the EMB crosses the EMC), investment performance will decrease.
However, the view of diminishing marginal benefit is limited in reality. VC/PE funds maintain the investment project even if they missed the optimal point because exogenous factors (i.e. all the factors except the factor of diminishing marginal benefit) such as new government policies and newly joined investors are also able to influence the valuation of the financed firm. Consequently, along with the effect of diminishing marginal benefit, this paper uses option theory to explain the motivation for the VC/PE funds that maintain the investment project longer. Particularly, this paper is interesting in the investment performance after EMC crosses EMB.
Figure 6 shows that immediately after EMC crosses EMB, the accumulated benefits that the financed firm generate from the value-added services provided by VC/PE funds drop to negative. In other words, as the VC/PE funds hold the investment project longer, the net loss will become larger. However, since exogenous factors are also able to contribute to the valuation of the financed firm such as a bull market will strengthen investors’ confidence and hence increase the valuation of the financed firm, and a bear market will weaken investors’ confidence and hence decrease the valuation of the financed firm (Bouwman, 2009), the effects of those exogenous factors can either offset the net loss from maintaining the investment project or exacerbate the investment loss further.
However, given the high probability that the benefit that the exogenous factors bring into the valuation may not be sufficient to offset the ever-increasing net loss from maintaining the investment project, the potential negative effects of exogenous factors and the empirical results of previous studies (Cumming and MacIntosh, 2001; Cumming and Johan, 2010), this paper conjectures that the investment performance will keep decreasing as the VC/PE funds maintain the investment project longer. Hypothesis 3a is shown at the end of section 4.3.
Information Asymmetry
The theory of information asymmetry is also important in explaining the correlation between investment duration and investment performance. In the context of China,
information asymmetry might be more severe since stock market manipulation and insider trading are widespread and the protection mechanisms for investors are not well-established (Chakravarty et al, 1998). When VC/PE funds decide to exit, information asymmetry may emerge between the selling parties (institutional and individual investors in the financed firm) of the firm's equity and the buyers (Healy and Palepu, 2001). To be precise, since the selling parties involve with the financed firm longer, they will have more information about the financed firm, a greater capability to assess information quality and a better understanding of the financed firm’s industry thanks to their intimate relationships with the financed firm (Cumming and MacIntosh, 2001). Consequently, the selling price of VC/PE funds’ equity might be decreased by this information asymmetry (Megginson and Weiss, 2012).
This paper contends that the increment of a financed firm’s value is determined by the length of time that VC/PE funds involve with the financed firm. In other words, as the VC/PE funds guide the financed firm longer, it receives more knowledge and resources and will be more possibly to have a proven revenue model, a well-accumulated customer base, a strong core team and a well-established internal control mechanism than at the beginning period of the investment (Grant and Baden-Fuller, 2003; Hsu, 2005). The collaborations between the financed firm and suppliers, law firms, bankers and accountancy firms will be established with the assistance of the VC/PE funds (Cumming and MacIntosh, 2001). Furthermore, Lin and Smith (1998) confirm that fund reputation is a key determinant when VC/PE funds make exit decisions and a vital factor that influences the projected valuation of IPO projects. Although this paper expects that VC/PE funds will seek to attenuate information asymmetry by developing reputations, no available data and variables can be used to measure fund reputation in China’s VC/PE industry. As a result, the potential influence from fund reputation will not be studied in this paper.
The factors discussed above lower many of the potential risks that the VC/PE funds must face in the pre-IPO stage (Rosenberg, 2002). In the context of IPOs, previous empirical studies suggest that the degree of VC/PE funds’ involvement with a financed firm is an indicator of that firm’s quality to the secondary market. VC/PE funds financed firms that go public are expected to be less underpriced than those non-VC/PE financed pre-listed firms (Barry et al, 1990). Moreover, VC/PE financed firms perform better after IPOs than other firms (Barry et al, 1990). These empirical findings imply that the longer the investment duration, the stronger the indicator of firm quality and the lower the information asymmetry.
Since VC/PE funds accumulate more information about a financed firm’s quality over time (Healy and Palepu, 2001), longer investment duration possibly leads to higher firm quality and lower information asymmetry. Because reduced information asymmetry will result in a lower discount rate of the financed firm’s projected future cash flows, this line of reasoning leads to the hypothesis 3b below:
Hypothesis 3a: Investment duration negatively influences investment performance. Hypothesis 3b: Investment duration positively influences investment performance.
4.4 Investment Scale
Many VC/PE funds have firm-specific criteria on investment scale (Fried and Hisrich, 1994). Although the relationship between investment scale and investment performance is unclear (Mason and Harrison, 2002) and the utilization efficiency of the capital that a financed firm obtained is debated, this paper contends that investment scale is a significant factor that drives investment performance based on several empirical findings.
Gompers and Lerner (2000) find that the chase for investment amount negatively influences fund performance. A large number of studies also notice that the amount of series A round financing is a key determinant of firm success (Zacharakis and Shepherd 2001; Sorenson and Stuart 2003; Mullins and Forlani 2004). An interpretation of the empirical results that suggest positive correlation between investment capital committed by VC/PE funds and investment performance is straightforward. Intuitively, if a firm obtains more capital at a specific point of time, it has more power to expand business, hire a more capable management team and put more money into R&D and innovations. In contrast, if entrepreneurs are unable to obtain sufficient capital, business operation will be negatively influenced since their firms have to devote much effort to seeking investments and reducing costs under capital shortage (Mason and Harrison, 2004). In the meantime, since capital shortage also negatively influences firms’ other activities such as necessary expansions, the firms may have troubles in staff motivation, marketing and R&D, which possibly leads to business failure (Standeven, 1993). Accordingly, the fourth hypothesis should be given here:
Hypothesis 4:
Investment scale positively influences investment performance.
(Note: as one fund may invest in several rounds in one firm, this paper will not
aggregate the investment capital of each round but instead to count them as different investment projects. The reason for this separation is that investment scale and investment date for each round is different, which reflects a fund’s investing skills, experience and knowledge at different points in time.)
4.5 Ownership Type and Institutional Environment
Based on a random sample of firms in China, Dollar and Wei’s empirical study (2007) indicates that inefficient capital allocation is both statistically and economically significant in China on account of different ownership types. Empirically, Dollar and Wei (2007) find that the marginal and average returns to capital of state-owned firms are lower than domestic private and foreign firms by 23 to 54 percentage points. In the empirical study of China’s banking sector efficiency between 1994 and 2003, Berger et al (2009)’s results point out that foreign-owned banks are more efficient than state-owned banks and they strongly suggest reforming state-owned banks in
China. Berger et al (2009) find that the profit efficiencies of state-owned banks are the lowest among banks in China largely because of the low profit margins of loans for state-owned firms and unnecessary operation expenses. They contend that since the profit efficiencies of the majority of foreign-owned banks are the highest in China, moving resources from state-owned banks to foreign-owned banks might increase the overall efficiency of China’s banking system.
These empirical findings suggest that firm ownership type is an essential determinant of firm performance, and particularly China’s institutional environment is different from the Western world (Wang et al, 2008). Coupled with Chinese traditional culture, China’s history of socialism creates a unique institutional environment (Scarborough, 1998). This institutional environment greatly influences business operations and resources acquisitions of firms in China. For instance, personal relationships are more important than professional proficiency for firms to win contracts in China. The protection mechanisms for property rights are not well-founded and the regulatory systems for corporate governance are imperfect. Particularly, resources and capital allocation are influenced by other political and non-market factors. Consequently, China’s distinctive institutional environment is significant for this paper to study how institutions influence firm performance and how entrepreneurs in China work differently from those of the Western world (Peng et al, 2008).
In the specific context of VC/PE funds ownership type, basically, there are three types of VC/PE funds in China: state-owned funds (the majority of them are organized in corporations), domestic private funds and foreign funds (organized both in corporations and partnership). Firstly, since state-owned funds are basically state-owned corporations that have to consider objectives other than profitability, such as the promotion of the local industry, their performance might be considerably influenced (Dollar and Wei, 2007). Secondly, even if state-owned funds may have extra and special networks to obtain business opportunities, their corporate governance, employees motivation mechanism and screening skills are still not market-economy-based and greatly influenced by Chinese government, which is similar to the phenomenon noted by Berger et al’s study (2009) in China’s banking industry. On account of these arguments above, it is reasonable to predict that state-owned funds’ performance is poorer than other ownership type funds. Thirdly, Chinese government has special regulations for the VC/PE industry as we have partly seen in section 2.4, which directly influences state-owned funds’ performance. As a result, it is appropriate to make the fifth hypothesis below:
Hypothesis 5:
Non-state-owned funds perform better than state-owned funds.
4.6 Geographical Perspective
Despite many previous studies that suggest geographic proximity is the key determinant of the relationship and the monitoring efficiency of VC/PE funds on
financed firms and hence influences investment performance (Lerner, 2012), this paper argues that the location of the fund headquarter is more important in influencing fund performance especially in the context of China. The quality of social network is a crucial element of venture capital and private equity investment (Hoang and Antoncic, 2003). Since venture capital and private equity are strong-ties investments (Hellmann, 2000), the location of fund headquarter partly determine the quality of projects the fund can obtain. Location also matters since if the fund is based in a highly developed region, it probably has more networks and resources (i.e. it’s easier for them to access, build and maintain such resources because of the close proximity) as well as reduced information asymmetry, and therefore is able to provide higher quality value-added services for its financed firm (Zhao et al, 2005).
For instance, in Saxenian’s (1991) study of Silicon Valley, firms’ extensive networks of collaborations are found to be helpful in accelerating technological advances and new product development. Enterprise clusters are essential to business success since well-established cooperation networks promote knowledge spillovers and business cooperation. Institutional economic theory suggests that culture and custom have an enormous impact on people’s mode of thinking and behaviors, and therefore are influential to business operations. As a result, the development of the economy and the business culture of the fund headquarter location directly determine the quality of projects that the fund can obtain and hence influences investment performance. The reasoning of this argument is straightforward. Entrepreneurs seek high quality VC/PE funds because they can provide higher quality value-added services. Based on an empirical study of venture capital in 23 countries, Kaplan and Strömberg (2005) find that developed regions and markets lead to better venture capital investment performance and higher success rate.
To summarize, the social network quality of VC/PE funds is a crucial determinant of the investment performance in China’s VC/PE industry. Funds in China with high social network quality and reputation such as Sequoia Capital China Branch (based in Beijing) and Shenzhen Capital Group (based in Shenzhen) are easier to attract and obtain high quality projects and thus have a better performance. This paper chooses the location of fund headquarter as the primary variable to measure fund’s social network quality since funds based in developed cities such as Beijing (the capital city of China), Shanghai (the financial center of China), Shenzhen (the first opened city in Chinese economic revolution and also the place of ChiNext) and Hong Kong (the financial center of Asia) will have higher quality network and more resources. Based on the arguments above, it is reasonable to hypothesize that these funds will provide better value-added services that enhance their financed firms’ performance.
Hypothesis 6:
Funds whose headquarters are in highly developed cities (Beijing, Shanghai, Shenzhen and Hong Kong) perform better than funds whose headquarters are in other cities.
5 Data and Methodology
This paper focuses on China’s VC/PE funds backed investment projects that exited through IPOs from October 2009 to October 2011 based on the IPO data from the Shenzhen ChiNext (the only Growth Enterprise Market in China) for the following two reasons. First, data on exit methods other than IPO is extremely difficult to obtain in China. Second, IPOs are the most frequently selected methods of exit for high quality firms (Cumming and MacIntosh, 2003a) and the most important and profitable exit methods and have a significant impact on the development of the VC/PE industry (Black and Gilson, 1998).
Since the China Securities Regulatory Commission orders that prospectus should disclose all the confidential information about the pre-listed firm’s equity holders and the investment background, the data collection procedure of this paper is to go through all the prospectuses and collect all the data on VC/PE funds backed IPOs from ChiNext from October 2009 to October 2011 (the only continuous data period that was not interrupted by suspensions of IPO issuance examination such as the IPO suspension ordered by the China Securities Regulatory Commission between June 2012 and September 20125).
323 individual investment projects from 167 VC/PE funds backed IPOs have been collected with the information of: pre-listed firm’s name, ticker number, date of IPO, date of exit, issue price, closing price of the first trading day, issuance (both in shares and RMB), pre-listed firm’s industry, VC/PE fund’s name, fund ownership type, fund foundation date, individual investment duration, individual investment amount, shares owned before and after IPO (both in percentage and RMB), location of fund headquarter and syndication (the number of institutional investors in a financed firm). After the removal of 6 anomalies with over 1,000% abnormal IRR, 317 valid samples are left for the empirical study.
The principal performance measurement in the VC/PE industry is the internal rate of return (IRR) (Gottschalg et al, 2004). However, some scholars, such as Robbie et al (1998) and Cumming and MacIntosh (2001), choose to use the yearly book rate of return and the type of exit methods as mentioned in section 3. Since the IRR is the most commonly used and representative rate of return to reflect investment performance and to interpret empirical results, this paper will only use the IRR calculated by the closing price of the first trading day as the measurement for investment performance. Two reasons for choosing the IRR calculated by the closing price of the first trading day rather than the IRR calculated by the issue price can be presented here. First, many studies such as Chalk and Peavy (1987) and Barry and Jennings (1993) point out that the closing price of the first trading day is a more appropriate indicator than the offering price for the listed firm’s valuation. However, since this issue is not the focus of this paper, this paper will not go deeper into it.
5
The infortmation of IPO suspension is from the official announcement on the official webiste of the China Securities Regulatory Commission
Second, the stock regulation discussed in section 2.4 is important. “Shenzhen Stock Exchange Listing Rules - 2012” states that the shares subscribed by all the controlling shareholders or actual controllers of the enterprise it controlled shall not be transferred to others within 36 months after IPO and the enterprise shall not buy back its shares. This regulation suggests a more rational valuation for the newly listed firm based on the closing price of the first trading day because panic selling is prevented, which leads to a more rational valuation from all the investors.
In addition, as mentioned in section 3.3, the high-growth nature of high technology-based firms such as information technology (IT) and energy technology firms makes them different from firms in traditional industries such as textile industries. Firms in high-tech sectors typically grow much faster than firms in traditional industries in the early phase (Kohers, 2000), which results in higher return on capital (ROC) ratio. Accordingly, to study the performance of different VC/PE funds, it is important to use control variable to distinguish funds that focus on high-tech sectors from funds that focus on traditional sectors. As a result, financed firm’s industry is used as a control variable in the empirical study. This study divided financed firms’ industries into two categories: high-tech industries (IT, clean-tech, bio-tech, health care, internet, telecom or digital and broadcast TV) and traditional industries (all other industries).
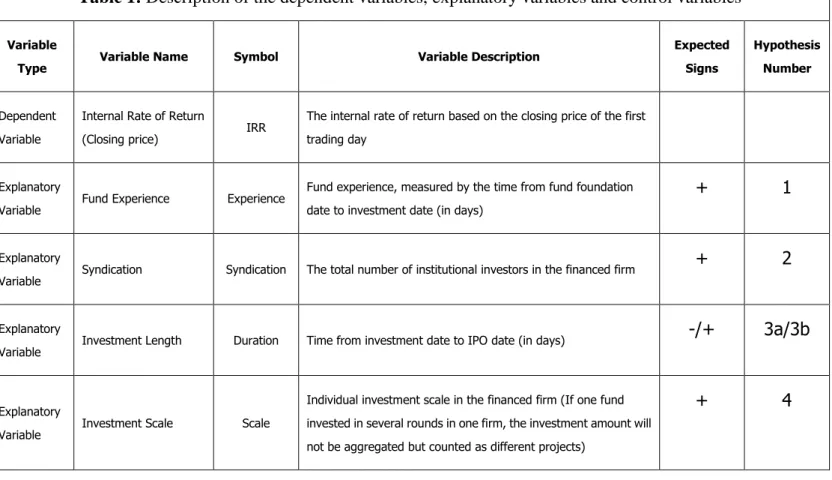
Table 1 below gives the primary description of the dependent variable, explanatory variables, control variables and symbols that will be used in regression models.
Table 1: Description of the dependent variables, explanatory variables and control variables
Variable
Type Variable Name Symbol Variable Description
Expected Signs Hypothesis Number Dependent Variable
Internal Rate of Return
(Closing price) IRR
The internal rate of return based on the closing price of the first trading day
Explanatory
Variable Fund Experience Experience
Fund experience, measured by the time from fund foundation date to investment date (in days)
+ 1
Explanatory
Variable Syndication Syndication The total number of institutional investors in the financed firm
+ 2
Explanatory
Variable Investment Length Duration Time from investment date to IPO date (in days)
-/+ 3a/3b
Explanatory
Variable Investment Scale Scale
Individual investment scale in the financed firm (If one fund invested in several rounds in one firm, the investment amount will not be aggregated but counted as different projects)
Table 2 below presents the descriptive statistics of the dependent variable, explanatory variables and control variables that will be used in the regression models.
Table 2: Statistical description of the dependent variables, explanatory variables and control variables
Variables Symbol Median Mean Standard
Deviation Minimum Maximum Internal Rate of Return
(Closing price) IRR 204.01% 388.77% 6.98 27.67% 6486.43%
Fund Experience Experience 1,179.00 1,784.38 1,475.18 56.00 6,865.00
Syndication Syndication 2.00 2.69 1.51 1.00 7.00
Investment Duration Duration 648.00 832.38 627.54 212.00 4,074.00
Investment Scale Scale ¥12,362,000.00 ¥19,075,569.58 21,418,035.28 ¥384,298.07 ¥176,400,000.00
Fund ownership type Type 0.0 0.23 0.42 0.00 1.00
Fund Headquarter
Location Location 1.0 0.70 0.46 0.00 1.00
Financed Firm’s Industry Industry 1.0 0.53 0.50 0.00 1.00
Firstly, Table 2 shows that the IRR varies among different investment projects when measured by the closing price of the first trading day. The mean value of the IRR is 388.77%, which is far higher than the required IRR (measured by the closing price of Explanatory
Variable Fund ownership type Type
The ownership type of VC/PE funds. If the fund is state-owned, the dummy variable is 1, otherwise 0. (Dummy variable)
- 5
Explanatory Variable
Fund Headquarter
Location Location
Location of VC/PE funds headquarters. If the headquarter is in the developed cities Beijing, Shanghai, Shenzhen and Hong Kong, the dummy variable is 1, otherwise 0. (Dummy variable)
+ 6
Control Variable
Financed Firm’s
Industry Industry
Industry the financed firm belongs to. If the firm belongs to the high-tech industry (IT, Clean-tech, Bio-Tech/ Health Care, Internet, Telecom or Digital and broadcast TV) the dummy variable is 1, otherwise 0.
Control variable
the first trading day), found by Manigart et.al. (2002) in a five-country study, that for early stage venture capital investors is 40% and for later stage private equity investors is 28%.
Secondly, the mean of the investment duration is 832 days (approximately 2.28 years). The investment duration is relatively short considering that equity investment is long-term investment. Cumming and MacIntosh (2001) find that the average investment duration for venture capital funds in the United States is 4.75 years and for Canadian funds is 5.53 years. An interpretation of this sharp difference is that VC/PE funds in China are still constrained by the limited ways to exit. The pressure from shareholders and limited partners of the funds is also a key reason because the VC/PE industry is novel in China and these investors are not familiar with its revenue process and thus are not patient and want high return in a shorter time. As a result, VC/PE funds will exit when the valuation increased to an acceptable level and exit as soon as possible, rather than wait for higher capital gains later.
Thirdly, the investment scale varies with a standard deviation of 21,418,035. An interpretation is that the fund size in China differs significantly. Huge funds, such as Sequoia Capital that manages over 4,000 million USD6, are able to invest 100 million USD in one single project whereas tiny funds, such as Tongying Venture Capital that manages nearly 5 million USD7, are only able to invest 1 million USD because of the limited capital. In addition, the valuation of the financed firm and its demand for capital are also the crucial factors that drive this result.
Fourthly, syndication is an effective measurement for the attractiveness of the financed firm. Table 2 shows that the minimum is one investor and the maximum is seven investors. Syndication varies evidently since high quality firms attract many funds to compete for the equity whereas ordinary firms have to seek investors themselves.
The correlation matrix over the explanatory variables is shown in Appendix 10.1.
6
The infortmation of fund size is from the official webiste of Sequoia Capital 7
6 Regression and Analysis
6.1 Model and Regression
Based on the hypotheses discussed in section 4, this paper proposes the model below with one control variable, financed firm’s industry. The coefficients are estimated by ordinary least squares (OLS).
IRR = β0 + β1* Experience +β2* Syndication + β3* Duration + β3* Scale + β5*Type + β6*Location + β7*Industry + εi
As for the problem of heteroscedasticity, the result of Breusch-Pagan-Godfrey Test is shown in Appendix 10.2. The F-value is statistically non-significant even at 10% level. As a result, the null hypothesis that homoscedasticity exists in the model cannot be rejected. As for the problem of multicollinearity, Appendix 10.3 shows that all the VIF-values are around 1 and therefore the problem of multicollinearity is not statistically evident in the sample base, which can also be detected from the correlation matrix as shown in Appendix 10.1.
The statistical result of the regression model is shown in Table 3 below. Table 3:Statistical Results of Regression Model
Variable Hypothesis Number
Expected
Signs Model
Note: For each cell of variables, the upper value is the estimated coefficient and the value in the brackets is the standard error. Correlation coefficient with sign “*” indicates that the correlation is statistically evident at the significance level of 10%. Correlation coefficient with sign “**” indicates that the correlation is statistically evident at the significance level of 5%. Correlation coefficient with sign “***” indicates that the correlation is statistically evident at the significance level of 1%.
CONSTANT 8.6044*** (1.3033) EXPERIENCE 1 + 0.0007*** (0.0003) SYNDICATION 2 + -0.2863 (0.2500) DURATION 3a/3b -/+ -0.0034*** (0.0006) SCALE 4 + -2.517E-8** (0.0000) TYPE 5 - 0.4907 (0.9204) LOCATION 6 + 0.1273 (0.8329) INDUSTRY Control 0.8805 (0.7628) Sample Size 317 R-squared 0.1245
Table 3 shows that the model explains 12.45% of the variation in the dependent variable. Experience, investment duration and investment scale are the three explanatory variables that are statistically significant in driving the investment performance of China’s VC/PE funds.
6.2 The Analysis of Statistical Results
I. Fund Experience (hypothesis 1; expected sign: +)
The statistical result points out that fund experience positively influences investment performance. This correlation is statistically evident in China’s VC/PE industry and hence hypothesis 1 is accepted. This result is consistent with the studies of Kaplan and Schoar (2005) and Hege and Palomino (2003). An explanation for this statistical result is that China’s VC/PE funds accumulate experience from prior investment projects to improve their skills in screening, assessment and governance of their portfolios. In other words, the experiences that China’s VC/PE funds have gained from their previous investments enhance their expertise, which results in better investment performance.
II. Syndication (hypothesis 2; expected sign: +)
The model shows that there are no clear statistical results supporting the hypothesis that syndication positively influences the investment performance of China’s VC/PE funds. As a result, hypothesis 2 cannot be accepted. An explanation is that the data variation within the syndication sample base is statistically low. We can observe in Table 2 that the standard deviation is 1.51 and the sample range is from 1 to 7. Consequently, this paper suggests a larger sample base for future empirical studies. III. Investment Duration (hypothesis 3a and hypothesis 3b; expected sign: −/+)
The model indicates that investment duration negatively influences the investment performance of China’s VC/PE funds. This correlation is statistically significant as we can observe in Appendix 10.3. As a result, hypothesis 3a is accepted and hypothesis 3b is rejected. This result is consistent with Cumming and Johan’s study (2010). A potential explanation is that whereas the cost of providing value-added services for the financed firm declines over time, the cost also contains fixed elements, which suggests that the marginal cost will remain constant at some time point (Cumming and MacIntosh 2001). As for the marginal benefit that the financed firm generates from utilizing the value-added services provided by the VC/PE funds, although it is large at the beginning of the investment period, it diminishes as the financed firm becomes mature with experience and knowledge it obtains, and therefore additional similar value-added services contribute less benefit to the financed firm.
Although VC/PE funds have two options that they can either exit when expected marginal costs equal to expected marginal benefits or hold the investment to see if the benefit brought by exogenous factors add more value to its investment project as well as offset the negative influence of diminishing marginal benefit, the potential benefit