http://www.diva-portal.org
Postprint
This is the accepted version of a paper published in Biochimica et Biophysica Acta - Biomembranes. This paper has been peer-reviewed but does not include the final publisher proof-corrections or journal pagination.
Citation for the original published paper (version of record): Agmo Hernández, V., Eriksson, E., Edwards, K. (2015)
Ubiquinone-10 alters mechanical properties and increases stability of phospholipid membranes. Biochimica et Biophysica Acta - Biomembranes, (0)
http://dx.doi.org/10.1016/j.bbamem.2015.05.002
Access to the published version may require subscription. N.B. When citing this work, cite the original published paper.
Permanent link to this version:
1
Ubiquinone-10 Alters Mechanical Properties and Increases Stability of
Phospholipid Membranes
Víctor Agmo Hernández†, Emma K. Eriksson† and Katarina Edwards*
Department of Chemistry-BMC, Uppsala University, Box 579, SE-75123, Uppsala, Sweden † These authors have contributed equally to this work
ABSTRACT
Ubiquinone-10 is mostly known for its role as an electron and proton carrier in aerobic cellular respiration and its function as a powerful antioxidant. Accumulating evidence suggest, however, that this well studied membrane component could have several other important functions in living cells. The current study reports on a previously undocumented ability of ubiquinone-10 to modulate the mechanical strength and permeability of lipid membranes. Investigations of DPH fluorescence anisotropy, spontaneous and surfactant induced leakage of carboxyfluorescein, and interactions with hydrophobic and hydrophilic surfaces were used to probe the effects caused by inclusion of ubiquinone-10 in the membrane of phospholipid liposomes. The results show that ubiquinone in concentrations as low as 2 mol% increases the lipid packing order and condenses the membrane. The altered physicochemical properties result in a slower rate of release of hydrophilic components, and render the membrane more resistant towards rupture. As judged from comparative experiments using the polyisoprenoid alcohol solanesol, the quinone moiety is essential for the membrane stabilizing effects to occur. Our findings imply that the influence of ubiquinone-10 on the permeability and mechanical properties of phospholipid membranes is similar to that of cholesterol. The reported data indicate, however, that the molecular mechanisms are different in the two cases.
HIGHLIGHTS
- Ubiquinone-10 increases the density and the degree of order of lipid membranes. - Ubiquinone-10 reduces the membrane permeability to small solutes.
- The observable effects of ubiquinone-10 are qualitatively similar to those of cholesterol. - Lower amounts of ubiquinone-10 than cholesterol are needed to achieve similar membrane
properties.
- The quinone headgroup of ubiquinone-10 is required for these effects to arise. KEYWORDS
Coenzyme Q10; liposomes; leakage; membrane stability; solanesol 1. INTRODUCTION
Ubiquinones constitute an interesting class of fat-soluble compounds present in the plasma and inner membranes of most eukaryotic cells[1], as well as in the membranes of gram-negative bacteria[2]. They consist of a substituted quinone headgroup linked to an isoprenoid chain that is of varying length depending on the species. In humans, the chain contains ten isoprenoid units and human ubiquinone is
2
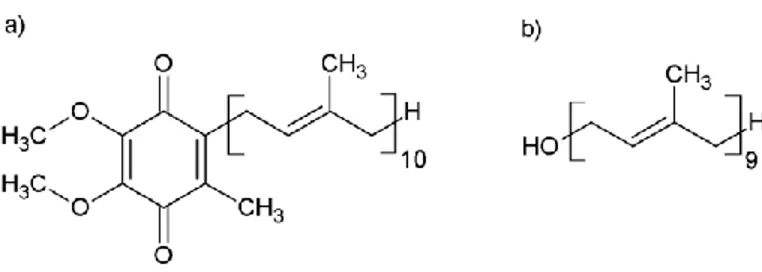
therefore referred to as ubiquinone-10 (UQ-10), or, simply, Q10 (chemical structure shown in Figure 1a). Another common name for Q10 is coenzyme Q10 (CoQ10). Q10 is involved in several aspects of the cellular metabolism, including the mitochondrial respiration chain, where it plays an essential role in the electron and proton transport across lipid membranes. Moreover, the fully reduced form of Q10,
ubiquinol, acts as a powerful antioxidant that protects the membrane lipids from peroxidation[3-6]. Some less well studied biological aspects of Q10 include its potentially important role in cell growth[7] and certain forms of apoptosis[8, 9]. The various confirmed and suggested functions of Q10 (which have been reviewed previously[3, 10]) motivate further, more detailed, studies of both the biological and physical roles of Q10 in cell membranes. Such studies are important also from a medical/pharmaceutical point of view, since genetic mutations, disease and ageing can affect Q10 levels in the cells and consequently result in serious health issues[10-13].
The exact location and orientation of Q10 in the lipid membrane, as well as its effect on the membrane physico-chemical properties, is to a great degree still a matter of discussion[10, 14, 15]. One of the most accepted models state that the isoprenoic chain is embedded in the mid-plane of the apolar region, whereas the quinone ring alternates between the membrane mid-plane and polar head-group region[14]. This central localization of Q10 has been suggested to destabilize the membrane and increase its fluidity and permeability[9, 10]. Early studies indicating that the lysis of red blood cells can be prevented by the inclusion of ubiquinone-6 (Q6) in the membrane[16] speak, however, against this hypothesis, although the observations may also suggest radical differences between the effects of Q6 and Q10. More importantly, recently published research has shown that the levels of native ubiquinones in bacteria increase by more than 100 fold when the cells are subjected to prolonged osmotic stress[17]. This has led to speculation concerning a possible mechanical-stability enhancing role of ubiquinones in lipid membranes[18]. Moreover, fluorescence anisotropy measurements performed with a series of different ubiquinones, including Q10, point towards a general pronounced and concentration dependent membrane ordering effect of ubiquinones[15]. Interestingly, the data reported by Jemiola-Rzeminska et al.[15] suggest that Q10 may cause an increase in acyl chain order that is even more pronounced than that observed for cholesterol under comparable conditions[19]. Since cholesterol is well known for its condensing and stabilizing effect in biological lipid membranes[20-22], it is tempting to speculate about a similar function for Q10. It is in this context noteworthy that several ubiquinone-rich biological membranes, such as those of mitochondria and aerobic gram-negative bacteria, typically contain very low levels of cholesterol. It is thus plausible that an additional important function of ubiquinone in these membranes is to fulfill the membrane-stabilizing role played by cholesterol in many other types of biological membranes. In order to confirm this hypothesis it remains, however, to verify that the reported Q10 dependent increase in
membrane order[15] is indeed coupled to a higher mechanical stability of the membranes.
In this study we characterize the effect of Q10 on several stability related properties of 1-palmitoyl-2-oleyl-sn-glycero-phosphocholine (POPC) liposomes, including their membrane density and permeability, resistance to solubilization by detergents, and promptness to rupture on solid surfaces. We also investigate the effect of Q10 on the degree of order of the acyl chains, as well as on the recently described
spontaneous formation of hydrophobic defects, or active sites, in the lipid membrane[23]. The results are compared to what is obtained under similar conditions with liposomes formed by pure lipids, as well as with liposomes supplemented with cholesterol or solanesol. The latter molecule is structurally similar to Q10 but contains 9 instead of 10 isoprene units and the quinone headgroup is replaced by a hydroxyl
3
functional group (see Figure 1b). Studies with solanesol will help us discern whether the quinone ring is essential for the effects induced by Q10 on the properties of the lipid membrane.
Figure 1. Molecular structure of a) Q10 and b) solanesol.
2. MATERIALS AND METHODS 2.1 Chemicals
Dry powder of 1-palmitoyl-2-oleyl-sn-glycero-phosphocholine (POPC) was either purchased from Avanti Polar Lipids (Alabaster, AL), or obtained as a kind gift from Lipoid Gmbh (Ludwigshafen, Germany). No differences between the two providers were observed in the performed experiments. Ubiquinone-10 (Q10), solanesol, cholesterol, polyethylene glycol tert-octylphenyl ether (Triton X-100),
5(6)-carboxyfluorescein (CF), octaethylene glycol monododecyl ether (C12E8), 1,6-diphenyl-1,3,5-hexatriene (DPH), methanol and hexane were purchased from Sigma-Aldrich (Steinheim, Germany). 99.5 % spectroscopic grade ethanol was from Kemetyl (Haninge, Sweden), and chloroform was from MERCK (Darmstadt, Germany). Polystyrene nanoparticles, 115±4 nm, 5 % w/v, were from MicroParticles Gmbh (Berlin, Germany). A phosphate buffer saline (PBS, 10 mM phosphate, 150 mM NaCl, pH 7.4) was used for the measurements performed at a controlled pH value. All aqueous solutions were prepared using deionized water (18.2 M Ω cm) obtained from a Milli-Q system (Millipore, Bedford, USA). Experiments were performed at room temperature (~22 °C) unless indicated otherwise.
2.2 Liposome preparation
Liposomes were prepared by either extrusion or sonication, depending on the preferred final size distribution. For both methods, the desired amount of lipid was first weighted and dissolved in
chloroform. For Q10 or solanesol containing liposomes the necessary amount from a stock solution (Q10 stock: 1 mg/mL in 1:1 chloroform:ethanol, solanesol stock: 1 mg/mL in ethanol) was added to obtain the desired composition of the lipid mixture. The solvent was then evaporated under a constant stream of nitrogen until a homogenous film was obtained. Remaining traces of solvent were removed by placing the samples under vacuum overnight (Squaroid vacuum oven, Lab Line Instruments, IL). The lipid film was thereafter suspended in the desired aqueous solution (PBS if not otherwise indicated).
To produce small unilamellar vesicles (SUVs) the lipid film was hydrated for 40 min in a water bath at 60 °C. The obtained suspension was thereafter sonicated with a tip-sonicator (Soniprep 150, MSE, London, UK) for 45 min with a surrounding ice-bath to finally obtain SUVs. Afterwards, the suspension was centrifuged for 15 min at 10,000 rpm to remove titanium debris produced during the sonication procedure. To create large unilamellar vesicles (LUVs), the lipid suspension obtained after hydration of the lipid film was subjected to five freeze-thaw cycles (freeze in liquid nitrogen, thawing in a water bath at 60 °C). The
4
suspension was thereafter extruded 31 times using a Lipofast extruder (Avestin, Ottawa, Canada) with a 100 nm pore size filter (Watman plc, Kent UK).
After preparation, the suspensions were diluted to the desired concentration and stored at room temperature for 24 hours before performing the experiments, with the exception of the spontaneous leakage experiments which are described below. This was done to account for the activation-deactivation phenomenon described in a previous report[23], where we showed that experiments with freshly prepared liposomes may result in irreproducible data. According to this report, after 24 hours of incubation the suspensions have equilibrated and the results are more reproducible and reliable.
2.3 Liposome characterization 2.3.1 Size determination
The size distribution of the liposome suspensions was measured by dynamic light scattering (DLS). A uniphase He-Ne laser producing vertically polarized light at 638.2 nm and operating at 25 mW was used as a light source. Data was collected at a 90° angle with a PerkinElmer diode detector (Quebec, Canada) connected to a ALV-5000 multiple digital autocorrelator (ALV-laser Vertriebsgellschaft mbH, Germany). The lipid concentration in the samples was between 0.5 and 1 mM.
2.3.2 Cryo-TEM characterization
The structure and morphology of the formed structures was characterized with cryogenic transmission electron microscopy (Cryo-TEM). Analyses were performed with a Zeiss TEM Libra 120 instrument (Carl Zeiss AG, Oberkochen, Germany) operating at 80 kV, in a zero-loss bright-field mode. The digital images were recorded under low-dose conditions with a BioVision Pro-SM Slow Scan CCD camera (Proscan elektronische systeme GmbH, Scheuring, Germany). All the investigated samples had a lipid
concentration of 1-10 mM. The sample preparation method before microscopy has been described in detail by Almgren et al.[24]. Briefly, a small drop (~1 µl) of sample is deposited on a copper grid, reinforced with a holey polymer film, and gently blotted to remove the excess of fluid. This thin film of sample is then quickly vitrified in liquid ethane and transferred to the electron microscope. The sample preparation was made in a custom-built climate chamber at 25 °C and at ~98-100 % relative humidity. Samples were kept below -165 °C and protected against atmospheric conditions during the transfer from the climate chamber and the sample examination.
2.3.3 Determination of Q10 and solanesol content
In order to determine the proportion of Q10 and solanesol present in the samples, the compounds were first extracted from the suspended lipid phase according to a slightly modified version of the protocol described by Kroger[25]. More specifically, an aliquot of the liposome suspension corresponding to an expected amount of 30 nmol of Q10 or solanesol, was added to a 0.5 mL mixture of 3:2 methanol:hexane and thoroughly agitated for 1 min. A volume of 0.2 mL acetone was thereafter added and the mixture was placed on a shaking table for 15 min. The mixture was centrifuged for 2 min at 4700 rpm (equivalent to 2100 g) using a Biofuge Pico centrifuge (Heraeus Instruments, Germany) to separate the aqueous and organic phases into two layers. The upper (organic) layer was collected and the extraction procedure was repeated a second time on the bottom layer. The two collected extraction phases were thereafter mixed and dried under a N2-stream and in a vacuum dryer for about 15 h. The obtained film was re-dissolved in 2 ml
5
of spectroscopic grade ethanol. The absorbance was measured directly at 275 nm for Q10 containing samples (extinction coefficient 12.6 mM-1cm-1[25]). A standard addition method was used for the
determination of solanesol. Briefly, small volumes of a concentrated solanesol stock solution (1 mg/ml in ethanol) were added to the extracted sample. The absorbance after each addition was noted at 200 nm and the obtained curve was extrapolated to obtain the initial concentration in the sample. All the absorbance spectroscopy measurements were made with a UV spectrophotometer (UV-1800, Shimadzu, Japan). In order to determine the lipid:Q10 and the lipid:solanesol ratios, the phosphorous content of the samples was determined according to the molybdenum blue method reported by Murphy and Riley[26] with the modifications introduced by Paraskova et al.[27].
2.4 Leakage assays
Both spontaneous and detergent induced leakage from liposomes was studied. The liposome suspension was prepared in a self-quenching CF solution (100 mM CF, 10 mM sodium phosphate, pH = 7.4) isotonic with PBS. Untrapped CF was thereafter removed by gel filtration using a PD-10 column (GE-Healthcare, Uppsala, Sweden) equilibrated with PBS. The elapsed time between the liposome production and the end of the separation was noted together with the time between the separation and the start of the fluorimetric measurement. In all experiments involving CF, the excitation and emission wavelengths were set to 495 and 520 nm, respectively, and the experiments were performed using a SPEX fluorolog 1650 0.2 m double spectrometer (SPEX industries, Edison, NJ) in the right angle mode.
For the spontaneous leakage experiments, each sample was diluted to 12 µM after separation to keep the concentration-dependent fluorescence signal upon CF leakage within the linear range. A volume of 50 µL of a 100 mM Triton X-100 solution was added to the samples after each experiment to induce a complete leakage from the liposomes. The fluorescence intensity recorded after Triton X-100 addition was used to normalize the obtained data to the total amount of trapped CF. The degree of leakage over time
𝑥CFrel(𝑡) was calculated by:
𝑥CFrel(𝑡) =𝐼(𝑡)−𝐼𝐼 0
tot−𝐼0 (1)
where I(t) is the time-dependent recorded intensity, I0 is the intensity at the starting-point of the
experiment and Itot is the intensity at complete leakage from the liposomes. The spontaneous leakage was recorded for at least 5 h with a sampling interval of 5 s.
In the case of detergent induced leakage experiments, the liposome samples were diluted to 24 µM after separation from free CF. In order to be able to monitor the leakage within seconds after mixing liposomes and detergent, an instant-mixer (SFA-II Rapid Kinetics Accessory, TgK Scientific, England) was used to mix the liposome suspension 1:1 with detergent solutions of different concentrations. The final liposomal and detergent concentrations are consequently half of the original. Six different concentrations of C12E8 (ranging between 0 µM - 5 mM) in PBS buffer were used. The highest C12E8 concentration (5 mM) was used to induce a complete leakage from the liposomes. The degree of leakage over time was calculated by use of eq. (1), with I(t) being monitored for ~5 min with a sampling interval of 0.5 s.
6 2.5 DPH Fluorescence Anisotropy
A volume of 2.2 µL of a DPH stock (0.91 mM DPH in methanol) was added to 2 mL of 1 mM extruded liposomes in PBS. The final DPH:lipid molar ratio was 1:1000. To assure incorporation of the DPH into the lipid membrane, the mixtures were incubated in the dark for at least 12 h before measurements. Steady-state fluorescence anisotropy measurements were performed using the SPEX instrument equipped with two polarization filters, polarizing the excitation and emission signals respectively. The excitation and emission wavelengths were set to 357 nm and 424 nm, respectively. The fluorescence anisotropy was obtained from the emission intensity obtained by setting the polarizers in all the four possible
combinations. The anisotropy <r> was calculated by: < 𝑟 >= 𝐼VV−𝐺𝐼VH
𝐼VV+2𝐺𝐼VH (2)
where 𝐺 = 𝐼HV⁄𝐼HH is an instrumental correction factor and Ixy represents the emission intensity obtained with the x and y alignments (V: vertical, H: Horizontal) of the excitation and the emission polarizers, respectively[28].
2.6 Turbidity measurements to probe detergent partition behavior
The optical density (turbidity) of the liposomal samples was followed at 300 nm while adding C12E8 in small steps and gently mixing the samples after each addition. Several solubilization curves were recorded for lipid concentrations in the range of 1-3.5 mM and used to estimate the partitioning of the detergent into the membranes (see further details in the Results and Discussion, section 3.4.2).
2.7 Affinity for hydrophobic surfaces
A suspension of hydrophobic (polystyrene, PS) particles (115 nm diameter) was added to pure POPC liposomes, POPC liposomes containing 2 mol% Q10 and liposomes containing 40 mol% cholesterol. In all cases, the lipid concentration was 12 µM. The number concentration of liposomes in the suspensions was calculated from the size distribution of the samples and the reported headgroup area of POPC in pure PC (68.3 Å2)[29], and in cholesterol containing membranes (~58 Å2)[30]. The added amount of PS-particles was calculated to obtain a particle:liposome ratio of 1:1. The interaction between the PS-particles and the liposomes was followed as changes in the size distribution of the sample. The rate and extent of the observed changes were used to deduce the affinity of the liposomes for hydrophobic particles. The measurements were performed with a NICOMP 380 instrument (Particle Sizing Systems, U.S). 2.8 QCM-D
The adhesion and spreading of liposomes on silica surfaces was followed using a Quartz Crystal Microbalance with Dissipation monitoring (QCM-D). A QCM-D E1 (Q-Sense, Gothenburg, Sweden) instrument thermostated at 21 °C and with a controlled sample flow of 150 µL min-1 was employed for all experiments. Frequency and dissipation data were collected from the fundamental sensor frequency (5 MHz), as well as the 3rd, 5th, 7th, 9th, 11th and 13th overtones. Silica QCM-D sensors were cleaned according to the procedure recommended by the supplier. Briefly, the sensors were treated for 10 min in an UV/Ozone chamber (BioForce Nanosciences Inc, Ames, Iowa), followed by 30 min rinsing in SDS 2 %. The sensors were then rinsed with water, dried with a nitrogen stream and, finally, treated again for 10 min in the UV/ozone chamber. After cleaning, the sensors were directly mounted in the QCM-D
7
instrument. The system was then equilibrated with MilliQ water. The solution was thereafter exchanged for the working solution (NaF, 50 mM) and the system was allowed to equilibrate. Sodium fluoride was chosen over sodium chloride due to the low surface activity of the fluoride anions. Once a stable baseline was obtained, a 1 mg/mL suspension of liposomes in NaF was loaded onto the system, and was left to react with the surface until the system stabilized. The system was finally rinsed with NaF to wash away any non-bound material.
3. RESULTS AND DISCUSSION
3.1 Characterization of liposome size and structure
The liposomes to be used in the experiments were characterized by means of dynamic light scattering (DLS) and cryogenic transmission electron microscopy (cryo-TEM). Data from the DLS measurements are reported in Table 1. Cryo-TEM analysis confirmed that the preparations were dominated by
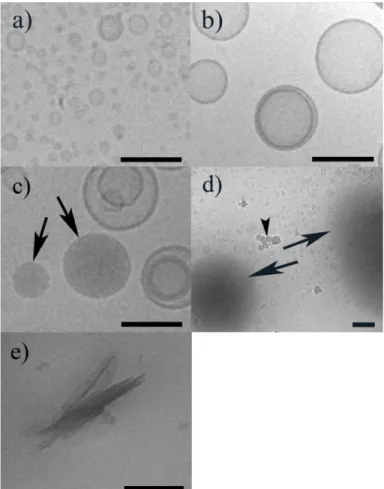
unilamellar liposomes of a fairly homogeneous size. Representative images of POPC:Q10 liposomes prepared by sonication and extrusion are shown in Figure 2a and 2b, respectively.
Figure 2. Cryo-TEM images of POPC:Q10 (2 mol% Q10) liposomes prepared by a) sonication, and b) extrusion.
Image in c) shows the aggregate structure in an extruded suspension with 6 mol% Q10 content and d) shows a sonicated suspension with 50 mol% Q10 content. Arrows in c) and d) denote Q10-rich oil-like structures. The arrow head in d) marks ice crystals deposited on top of the vitrified sample. Image in e) shows Q10 crystals formed in a pure Q10 suspension. The scale bar is 100 nm.
8
The Q10 content in the liposome preparations was determined spectrophotometrically (see details in section 2.3.3). It was observed that at low Q10 content (≤2 mol%) all of the added ubiquinone was found into the lipid membranes. However, when the Q10 concentration in the lipid film was increased, the proportion that was detected in the liposome suspension decreased significantly, especially in case of extruded liposomes. Thus, when 3.8 mol% Q10 was included in the lipid film, only 3.3 mol% was found in the liposome sample. When larger proportions of Q10 were included in the original lipid film, only a fraction of it remained in the liposome samples. For example, when adding 11 mol% Q10 to the initial film, only 6 mol% was found in the final suspension of extruded liposomes. The unincorporated Q10 is likely lost during the preparation procedure (e.g., in the filters used for extrusion, or during the
centrifugation step in case of sonicated liposomes).
Table 1: Mean hydrodynamic radius (number weighted) of liposomes prepared with different lipid compositions and techniques.
Lipid composition POPC POPC:Q10 (2 mol%)b POPC:Q10 (3.3 mol%)b POPC:solanesol (2 mol%)b POPC:cholesterol (10 mol%) POPC:cholesterol (40 mol%) Extruded liposomes (nm)a 44±3 38±6 38±6 45±10 47±12 44±10 Sonicated liposomes (nm)a 14±6 13±5 - 10±6 - -
a Averaged from at least three repetitions. Error margins represent the standard deviation of the averaged size
distributions.
b
Effectively incorporated Q10 and solanesol
Noteworthy, in extruded samples with a final Q10 concentration of 6 mol% or higher, a population of dense, oil-like structures was identified in the cryo-TEM images (see Figure 2c). Cryo-TEM images acquired for sonicated samples with an initial Q10 concentration corresponding to 50 mol% showed a large number of similar but bigger and more diffuse oil-like structures (Figure 2d). Importantly, cryo-TEM images of pure Q10 treated in the same way as for the preparation of sonicated liposomes, disclosed the presence of irregular crystals but did not show any oil-like structures (Figure 2e). This means that the oil-like particles have to consist of a large proportion of Q10 mixed with some lipids. The cryo-TEM analyses thus suggest that the POPC membrane becomes saturated with ubiquinone at Q10 concentrations somewhere between 3.3 and 6 mol%, and that increasing the Q10 content above this saturating limit will result in the appearance of an ubiquinione-dominated non-bilayer phase. It is plausible that this phase, which is represented by the oil-like structures in the cryo-TEM images, is identical to the isotropic Q10-rich phase previously identified by Stidham et al.[31] by use of light microscopy in phosphatidylcholine samples containing 5 mol% or more Q10.
The conclusion that two different phases coexist already at low Q10 concentrations is important, not least since Q10 proportions well above 6 mol% have been used in several previous studies (e.g., [5, 15, 32]). It is likely that the results obtained in these previous studies reflect the average behavior in samples
containing a mixture of Q10-saturated lipid bilayers and the isotropic Q10-rich phase. In order to avoid such complications, the experiments reported in the following sections were performed with liposomes containing at most 3.3 mol% Q10, in which case no oil-like structures were observed in the cryo-TEM analysis.
9 3.2 Acyl chain order in the membrane
The steady-state anisotropy <r> of the fluorescent probe DPH is commonly used to investigate changes in the mobility and packing order of the hydrocarbon chains in lipid membranes[33-35]. The magnitude of the anisotropy depends on the motional freedom and the rotational diffusion of DPH, where a higher anisotropy corresponds to a higher level of order in the membrane. Previous investigations indicate that incorporation of Q10 in the membrane of egg yolk lecithin and DPPC liposomes has a pronounced effect on the acyl chain ordering[15, 36]. The liposomes in these previous studies were claimed to contain up to 10 mol% Q10. As discussed above, it is likely that at these high Q10 proportions some of the Q10 is segregated into a Q10-rich phase. Under the assumption that DPH partitions also into structures belonging to this phase, the fluorescence anisotropy recorded would thus represent an average between the saturated lipid membranes and the separated non-bilayer phase. It is in this respect noteworthy that the DPH fluorescence anisotropy data reported in the cited article by Skowronek et al.[36] presents an inflection point at 4 mol% Q10 in liquid crystalline liposomes, in agreement with the Q10 concentration at which the non-bilayer phase is expected to appear. The previous studies on the effect of Q10 on DPH anisotropy[15, 36] were furthermore based on liposomes prepared by injecting ethanol solutions of lipid and Q10 into water. It cannot be excluded that the presence of trace amounts of ethanol in the membrane could have influenced the results. For these reasons we considered it important to carry out investigations to verify that an effect of Q10 on acyl chain order could be observed also in our ethanol-free POPC liposome samples at Q10 proportions below 4 mol%.
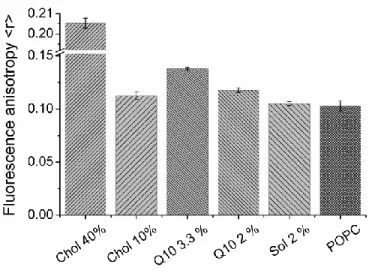
Figure 3. DPH fluorescence anisotropy (<r>) recorded for pure POPC liposomes and POPC liposomes containing
cholesterol, Q10 or solanesol in the quantities specified (given in mol%). Error bars represent the standard error from triplicate samples.
The steady-state anisotropy <r> was measured in pure POPC liposomes and liposomes containing 2 and 3.3 mol% Q10. For comparison, the anisotropy of DPH was determined also in liposomes containing 2 mol% solanesol, as well as in liposomes supplemented with 10 and 40 mol% cholesterol. The results are summarized in Figure 3. As expected, POPC membranes containing 40 mol% cholesterol present the highest fluorescence anisotropy. The obtained <r> value of 0.206±0.006 is in good agreement with previous reports. For liposomes containing 2 mol% Q10, the value of <r> is significantly (p<0.05) higher (0.118±0.007) than that determined for pure POPC liposomes (0.103±0.012). For liposomes supplemented
10
with 3.3 mol% Q10 the measured anisotropy is even higher (0.138±0.001). Our results thus confirm the trend of increasing anisotropy with increasing Q10 content in the lipid membranes, as suggested in previous studies[15]. The findings that Q10 increases the lipid chain order in membranes in the liquid crystalline phase, and that the extent of this ordering effect increases with Q10 concentration, are in line with what is typically observed for cholesterol[37]. Interestingly, as shown in Figure 3, liposomes containing merely 2 mol% Q10 display fluorescence anisotropy values that are similar to those observed for liposomes containing 10 mol% cholesterol (0.113±0.003). Moreover, the ordering effect obtained upon addition of 3.3 mol% Q10 is clearly more pronounced than that achieved by supplementing the liposomes with 10 mol% cholesterol. Solanesol does, on the other hand, not seem to have any significant membrane ordering effect (<r> = 0.105±0.002), which suggests that the quinone ring is essential for the ordering effect of Q10.
3.3 Spontaneous leakage
The lipid packing order and membrane fluidity affect the rate by which encapsulated compounds leak through the liposome membrane. In case of highly hydrophilic compounds the leakage is believed to occur primarily via the formation of defects and transient pores in the bilayer[38, 39]. Membrane additives that reduce the prevalence, or lifetime, of these structures are thus expected to reduce the leakage. In order to probe the spontaneous leakage from our liposomes, the release of CF was followed over comparably long times (>5 h). The results from these experiments are best fitted by a two-exponential term equation, as described by Agmo Hernández et al.[23]:
𝑥CFrel(𝑡) = 1 + 𝐶1𝑒−𝑡/𝜏1+ 𝐶
1𝑒−𝑡/𝜏2 (3)
where 𝑥CFrel(𝑡) is the proportion of CF released as a function of time and calculated as described in the supporting information. A parameter A can be determined from the sum of the reciprocals of the two time constants, i.e., A = τ1
-1 + τ2
-1
. This parameter also represents the sum of all the rate constants (ka, kb, kL1 and kL2) involved in the description of the spontaneous leakage according to the leakage model:
a
L1 L2 b leaked i a leaked CF k CF L k CF L k CF k (4)where CF(Li) and CF(La) represent, respectively, the average CF concentration in inactive (slow leaking, Li) and active (fast leaking, La) liposomes, ka and kb are the activation and deactivation constants, and kL1 and kL2 are the leakage rate constants for inactive and active liposomes, respectively. The activation-deactivation reaction is proposed to consist of the formation-consumption of defects in the membrane through which small soluble molecules can leak spontaneously[23]. Given that, usually, τ1 << τ2, the parameter A approaches the value of the leakage rate constant that would be determined by the more commonly used single exponential fitting. Consequently, a larger A-value corresponds to a faster leakage rate.
Table 2 shows the calculated A-values for POPC, POPC:Q10, POPC:solanesol and POPC:cholesterol liposomes. From the results it can be seen that POPC membranes modified with Q10 display a significantly lower leakage rate than do pure POPC membranes. Noteworthy, the A-value found for liposomes supplemented with 3.3 mol% Q10 is almost as low as that observed for liposomes containing 40 mol% cholesterol. Cholesterol is well known for its membrane condensing and leakage reducing
11
effect[40-42], and the low rate of CF leakage is well compatible with the high DPH anisotropy recorded for membranes including 40 mol% cholesterol (Figure 3). In case of liposomes containing 3.3 mol% Q10 we observe an almost equally low leakage rate, even though the anisotropy value is much lower than for the 40 mol% cholesterol case. This observation suggests that a comparably small increase in the lipid packing order can have a significant influence on the leakage of CF. Alternatively, changes in the membrane properties other than those probed by DPH anisotropy measurements may contribute to the reduced CF leakage. In the case of solanesol, a slight (not significant) increase in the A-value was observed as compared to pure POPC. Once again, it is clear that the quinone moiety of Q10 is necessary for the stabilizing effect to appear.
Table 2: Spontaneous leakage A-parameters for different liposome compositions. Lipid composition
POPCb
POPC:Q10 (2 mol% Q10) POPC:Q10 (3.3 mol% Q10) POPC:solanesol (2 mol% solanesol) POPC:cholesterol (40 mol% cholesterol)
A/(10-4s-1)a 4.65±0.3 (10) 3.15±0.2 (12) 2.83±0.4 (13) 5.04±0.8 (6) 2.34±0.7 (5)
a Error margins represent the standard error. Number of repetitions is given in parentheses. b Data taken from reference[23]
3.4 Resistance against detergents 3.4.1 Detergent induced leakage
In order to further verify and explore the leakage stabilizing effect of Q10 we carried out experiments in which the release of CF was promoted by addition of the detergent C12E8. When added to liposomal samples, micelle-forming detergents, such as C12E8, do in general induce a distinct increase in the membrane permeability to hydrophilic compounds. This effect is observed already at very low detergent concentrations, i.e. much lower than those needed for membrane saturation and subsequent solubilization of the lipids into mixed micelles. The mechanism behind the increased leakage is believed to involve the high spontaneous curvature displayed by detergents and their resulting tendency to accumulate in and stabilize defects and transient pores in the membrane[43, 44]. The faster leakage obtained in the presence of C12E8 allows us to assume a pseudo first-order leakage profile and a rate constant (k) can be calculated by use of the expression:
𝑥CFrel(𝑡) = 𝑦0− 𝑦1𝑒−𝑘𝑡 (5)
where 𝑥CFrel(𝑡) is the fraction of leaked CF as a function of the time t, y0 is the maximum induced leakage and y1 is a pre-exponential factor. Eq. (5) assumes that all liposomes leak at the same rate. This
assumption implies a homogeneous distribution of the detergent among the liposomes. To verify a uniform distribution, fresh CF filled liposomes from a concentrated stock solution were added to the detergent-liposome mixtures after the maximum leakage had been obtained (data not shown). It was observed that the added liposomes leaked their contents rapidly, indicating that significant amounts of free detergent were still present in the solution. This in turn suggests that the detergent is fairly homogeneously distributed among the liposomes in the mixture (in contrast to the possible scenario that all detergent has been consumed while solubilizing a fraction of the liposomes).
12
The leakage curves presented in Figure 4a show that the release of CF is relatively slow in liposome samples supplemented with 25 µM C12E8. Further, at this low detergent concentration there is no discernible difference in the leakage behavior displayed by pure, solanesol-, and Q10-containing liposomes. At C12E8 concentrations corresponding to 50 µM, the leakage is generally faster and a clear trend can be observed; the rate of CF release is higher for pure and solanesol-containing liposomes than it is for liposomes containing Q10 (Figure 4b). The difference in leakage rate is even more obvious at 62.5 µM C12E8, the highest detergent concentration tested. Calculations based on Eq. (5) suggest in this case rate constants of (27.9±0.12)10-2
s-1, (23.1±0.09)10-2 s-1, and (8.7±0.02)10-2 s-1 for pure, solanesol-, and Q10-containing liposomes, respectively. The three times lower rate of release from the Q10-containing liposomes indicates that the presence of ubiquinone renders the membrane considerably more resistant towards the permeabilizing effect of the detergent. The very modest effect of solanesol on the leakage rate suggests once more that the quinone functionality of Q10 is essential for its role as membrane stabilizer.
Figure 4. CF leakage curves for different liposome compositions at C12E8 concentrations equal to a) 25 µM, b) 50
µM, and c) 62.5 µM. POPC – black continuous line, POPC:solanesol (2 mol% solanesol) – red dashed line, and POPC:Q10 (2 mol% Q10) – blue dotted line. Notice the different time scale range of c). The lipid concentration was 12 µM in all cases.
3.4.2 Partitioning of detergents
From the results presented in the previous section it is clear that Q10 reduces the C12E8-induced release of CF from the liposomes. This implies that Q10 affects the ability of C12E8 to induce and/or stabilize membrane pores through which CF can be released. Part of the reason for this could be that the presence of Q10 alters the distribution of C12E8 between the membrane and aqueous phases. In order to investigate this possibility we conducted experiments to probe and compare the detergent partition behavior in systems containing pure and Q10 supplemented liposomes.
A common way to determine the partition coefficient is to follow, by means of UV-Vis spectrometry, the changes in optical density, or turbidity, of the liposome sample upon addition of increasing amounts of detergent. The method builds on the identification of the detergent concentration at which the liposome membranes are saturated with detergent, and solubilization of the lipids into smaller structures, such as
13
cylindrical micelles, begins. Details about the method and the mechanisms behind the solubilization of liposomes by detergents can be found in, e.g., references[45-49]. The extent of the partitioning is defined by the partition coefficient (K)[50]:
𝐾 = 𝑅e [𝑆𝑎𝑡]
[𝑆]Free(𝑅e [𝑆𝑎𝑡]+1) (6)
where Re[Sat] is the partitioned detergent/lipid ratio at saturation. Re[Sat] can be determined from the slope in a curve where the surfactant concentration at saturation is plotted against the lipid concentration. This method is described in more detail in, e.g., the paper by Johnsson and Edwards[46]. The amount of surfactant that remains free in solution ([S]Free), is given by the y-intercept of the same curve, and is usually in the same range as the critical micelle concentration (CMC) of the employed detergent[48], which for C12E8 corresponds to 75 µM[46].
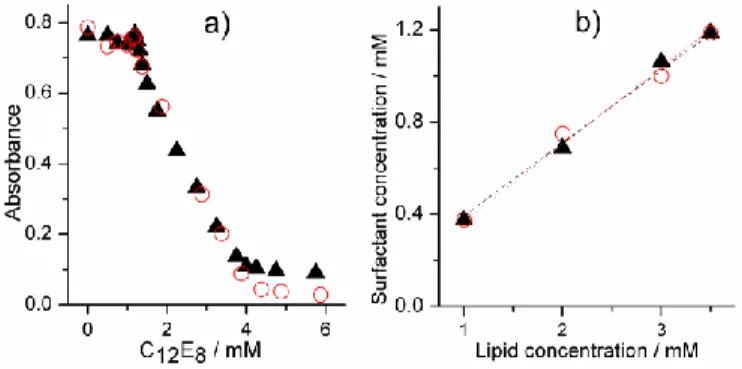
Figure 5. a) Solubilization of 3.5 mM POPC/POPC:Q10 liposomes with C12E8. b) The correlation between lipid
concentration and detergent concentration at the onset of solubilization. POPC – red circles, POPC:Q10 (2 mol% Q10) – black triangles. The dotted lines represent the corresponding linear fits.
Figure 5a shows the determined optical densities for 3.5 mM samples of POPC with and without Q10 (2 mol%) after the inclusion of different concentrations of detergent. As can be observed, both curves are practically identical. In both cases, the turbidity (measured as apparent absorbance) is almost constant until a certain concentration of C12E8 (~1.2 mM) has been reached. At this point the amount of surfactant is sufficiently high for the liposomes to start transforming into mixed micelles, and the turbidity decreases. The measurements were repeated with a series of different lipid concentrations and almost identical solubilization curves were in all cases observed irrelevant of whether or not the liposomes contained Q10. Figure 5b shows the relationship between the total detergent and lipid concentrations at the onset of solubilization. Our results indicate that there is no significant difference in the partition coefficient for C12E8 in systems containing pure POPC liposomes (K=3.2 mM
-1
) and POPC liposomes supplemented with 2 mol% Q10 (K=3.3 mM-1). Cryo-TEM investigations of the pure POPC and Q10 containing samples confirmed, moreover, that there were no visible differences in the aggregate structures during the various stages of the liposome solubilization process (images not shown). It can therefore be concluded that the decreased leakage rates observed for the Q10-containing liposomes (see Figure 4) most likely do not stem from an altered partition behavior of the detergent. The unaltered partition coefficient suggests that Q10, despite its clear ordering effect, does not change the membrane properties in a way that detectably
influences the insertion of the non-ionic detergent C12E8. Interestingly, the situation appears to be different in the case of cholesterol. Although existing data is somewhat limited, previous studies show that
14
partitioning of both ionic and non-ionic detergents into POPC membranes is hampered by the presence of cholesterol[51, 52]. For instance, even at cholesterol contents as low as 5 mol% a clear decrease in the partition coefficient for octyl--D-glucopyranoside has been observed, and at 40 mol% the effect is considerable[52]. It should be noted, however, that the interaction between detergents and phospholipid liposomes supplemented with cholesterol is complex and influenced by several factors related to the natures of both the surfactant and the lipid, as well as to environmental parameters, such as
temperature[53].
3.5 Rupture on hydrophilic (silica) surfaces
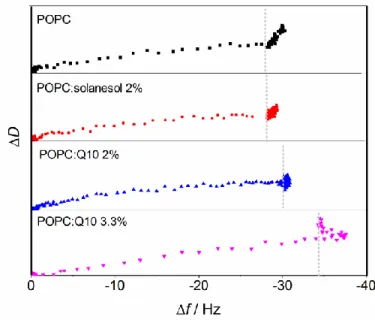
Changes in membrane properties also affect the manner in which liposomes attach, rupture and spread on smooth hydrophilic surfaces. This process can be followed with a quartz crystal microbalance with dissipation monitoring (QCM-D). The experiments involve measuring the shifts in frequency (Δf) and dissipation (ΔD) of an oscillating silica-coated quartz sensor disc after adding a suspension of sonicated liposomes. These shifts are related to the properties of the film forming on the sensor surface: negative shifts in the oscillation frequency correspond to the mass adsorbed on the surface, while the shifts in the dissipation factor report on the viscoelastic properties of the formed film[54].
Figure 6. QCM-D fingerprint curves obtained when loading with different liposome suspensions on a silica sensor.
The height of each cell corresponds to a shift in the dissipation factor of 2.5×10⁻⁶. Vertical dotted lines divide the small and large slope regions in each curve.
Figure 6 shows the ΔD vs Δf curves (also called “fingerprint” curves[55]) obtained for sonicated POPC, POPC:Q10, and POPC:solanesol liposomes. A steep slope in the fingerprint curve corresponds to the attachment of soft material to the sensor, while a completely horizontal line would correspond to the adsorption of a rigid film on the sensor. The initial slow increase in dissipation (ΔD) accompanied by a large decrease in oscillation frequency (Δf) seen for all cases in Figure 6, correlates well to the formation of a rigid supported lipid bilayer (|ΔΔf/ΔΔD| ~25×106)[56], indicating fast liposome rupture and spreading on the surface. The later sharp increase in dissipation with only a marginal shift in frequency (|ΔΔf/ΔΔD| ~2.8×10⁶) relates to the formation of a soft layer, most likely due to the adhesion of intact liposomes on
15
top of the formed bilayer and/or on the remaining free surface patches. For pure POPC and
POPC:solanesol liposomes, all non-ruptured liposomes detach after extensive rinsing (not shown in the figure), as concluded from a very small final shift in the dissipation factor (~0.3×10⁻⁶). In the case of the experiments with liposomes containing Q10, the final dissipation values after extensive rinsing were much more significant (~1×10⁻⁶ for POPC:Q10 (2 mol% Q10) and ~3×10⁻⁶ for POPC:Q10 (3.3 mol% Q10)), suggesting that a number of intact liposomes remain bound to the surface. These observations can be explained if it is assumed that, in the case of POPC and POPC:solanesol, the surface is completely coated by a supported bilayer and intact liposomes cannot therefore adhere directly to the surface, which
facilitates their removal. In the case of the Q10 containing membranes, it is likely that a few of the liposomes coming in contact with the surface do not rupture, and remain adhered to the substrate. An increase in lipid packing order leading to a more condensed membrane would nicely explain such an increased resistance to rupture, which has been observed previously for cholesterol containing liposomes[57].
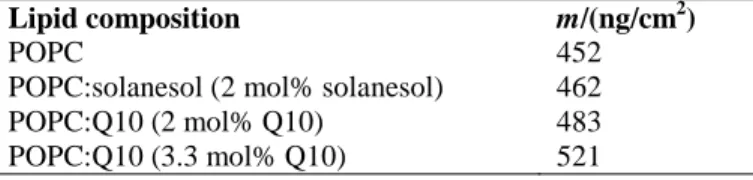
In order to demonstrate that Q10 indeed has a condensing effect in lipid membranes, the surface mass density of the formed supported lipid bilayers was calculated. To account for the frequency shifts caused by the adhesion of intact liposomes when Q10 is present, the fingerprint curves were used instead of the raw QCM-D curves. The frequency shift at the intersection point between the two distinguishable processes in the fingerprint curves (the formation of the rigid bilayer and the attachment of the soft liposomes) can be used to estimate the surface mass density m of the formed supported lipid bilayer according to the Sauerbrey relationship:
𝑚 = −𝐶∆𝑓𝑛𝑛−1 (7)
where C is the mass sensitivity constant (17.7 ng cm-2 Hz-1 at f0 = 5 MHz), ∆𝑓𝑛 the measured frequency shift at the intersection point, and n the overtone number. The determined ∆𝑓𝑛values were corrected to account for the bulk effect, i.e., for the frequency shift caused by changes in the solution density and viscosity when liposomes are present. The correction was done by assuming that, for each experiment, the dissipation shifts in the low slope part of the fingerprint curves were caused only by the bulk effect (i.e. assuming that the formed supported lipid bilayers are rigid). The corresponding correction for the
frequency shift is –2.5×10⁶ times the shift in the dissipation factor, according to Höök et al.[58]. For pure POPC and for POPC:solanesol, the corrected value of ∆𝑓𝑛 corresponded very well (less than 0.1 Hz difference) with the final frequency shift obtained after extensive rinsing. This fact allows us to assume that the introduced correction removes only contributions from the bulk effect and does not introduce any artifacts. The calculated surface mass densities for the formed supported lipid bilayers with the specified compositions are given in Table 3. The value obtained for POPC corresponds to a frequency shift of -25.5 Hz, in agreement with previous reports concerning the formation of supported lipid bilayers with similar lipids[56], further confirming the accuracy of our experiments.
Table 3: Surface mass densities of the supported lipid bilayers formed with different lipid compositions. Lipid composition
POPC
POPC:solanesol (2 mol% solanesol) POPC:Q10 (2 mol% Q10) POPC:Q10 (3.3 mol% Q10) m/(ng/cm2) 452 462 483 521
16
From the values shown in Table 3 it is clear that the inclusion of Q10 considerably increases the density of the formed supported lipid bilayers. It is very reasonable to assume that this condensing effect would occur also in the membrane of the liposomes free in suspension. A similar membrane condensing effect is typically observed also when adding cholesterol to lipid membranes[40, 59]. In the present study
measurements with cholesterol containing liposomes (40 mol% cholesterol) were unfortunately not possible, as the increased rigidity does not allow the formation of small unilamellar vesicles, which are required for the rupturing step to take place. Data reported in the literature[60], however, has shown that supported lipid bilayers formed by similar lipids and 45% cholesterol have a surface mass density of ~ 630 ng cm-2. Although apparently more significant than what is observed here with Q10, it is noteworthy that the cholesterol content in the cited case is ~15 times larger, suggesting that the membrane condensing capacity of Q10 is more effective. As can be seen in Table 3, solanesol does not seem to significantly affect the membrane density, suggesting that the quinone ring in Q10 is at least partially responsible for the observed condensing effect.
3.6 Affinity for hydrophobic surfaces
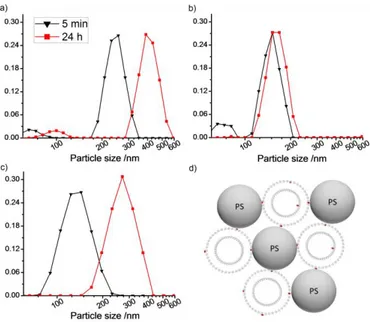
Investigations of the interaction between liposomes and hydrophobic surfaces can be used to retrieve additional information about the properties of the lipid membranes. As shown by Agmo Hernández et al.[23], a simple and convenient way of performing such studies is to mix the liposomes with PS-particles, and then follow the changes in overall particle size distribution over time. The experiment is based on the finding that large liposome-particle aggregates or clusters (see Figure 7d) tend to form when liposomes having soft membranes are mixed with hydrophobic nanoparticles of a similar size[23]. Liposomes with rigid membranes (such as gel-phase membranes), on the other hand, do not cause the growth of clusters. Instead, a slow adhesion and rupture process occurs in which the PS particles eventually become coated with a lipid monolayer.
In the case of liposomes with soft membranes, the size and rate of formation of the clusters are proposed to depend on the amount of hydrophobic defects, or active sites existing on the surface of the liposomes. These sites function as binding points for the hydrophobic particles. The model is based on the assumption that due to the highly dynamic nature of membranes in the liquid crystalline phase, a single liposome can readily present more than one active site. Therefore, the liposome is able to attach simultaneously to multiple particles, which, in turn, present attractive substrates for other active liposomes, resulting in the cluster growth mentioned. For membranes in which the concentration of active sites is very low (such as membranes in the gel phase state), liposomes usually bind to only one polymer particle and eventually rupture. Therefore, lipid coated particles instead of liposome-particle clusters are observed[23]. In order to determine which mechanism is followed, DLS can be used. The technique also allows determining the rate and extent at the initial stages of the growth of the liposome-particle clusters.
In the present study, extruded pure POPC liposomes, as well as POPC liposomes containing either 2 mol% Q10 or 40 mol% cholesterol were mixed with polystyrene nanoparticles and the extent and rate of cluster growth was followed. As can be seen in Figure 7, small aggregates (125-250 nm diameter) are formed almost immediately in all three systems. In case of pure POPC the size of these aggregates is larger (250 nm) than that observed for POPC:Q10 (150 nm) and POPC:cholesterol (125 nm). Previous studies[23] have shown that the structures observed in the two latter cases are likely to consist of a single liposome attached to a single PS particle. After 24 hours, more distinct differences between the samples can be observed. In the case of pure POPC (Figure 7a), it is clear that the liposome-particle aggregates
17
have grown to dimensions that suggest multiple liposomes and particles clustering together. This finding agrees well with previous studies of the same system in which the formation of very large clusters was confirmed[23]. For POPC:Q10 (Figure 7b) the DLS measurements reveal only a moderate change in the size distribution, suggesting that no large clusters have formed. The absence of cluster growth indicates that the Q10-containing liposomes display a smaller amount of active sites than the pure POPC liposomes. This conclusion is in accordance with the membrane stabilizing effect of Q10 that was inferred from the results described in the previous sections.
Figure 7. Normalized unweighted size distributions of different liposome-PS mixtures at 5 min and 24 h after
mixing: a) POPC, b) POPC:Q10 (2 mol% Q10) and c) POPC:cholesterol (40 mol% cholesterol). Note the
logarithmic scale on the x-axis. Vertical axis represent the relative frequency of each discrete size class. Lines are a guide to the eye. d) Cartoon showing particle-liposome clusters formed upon mixing defect-rich liposomes and hydrophobic polystyrene nanoparticles. Darker spots represent active sites in the lipid membrane. Liposomes attached to several particles may in reality be deformed.
The results obtained for the POPC:cholesterol system (Figure 7c) deserve some special attention. A possible explanation for the rather large shift in the size distribution observed after 24 h is that the large particles observed in the presence of cholesterol correspond to a few liposomes bound to a single particle without rupturing. Such structures can be formed if the liposomes present a limited amount of active sites (thus binding to only one PS particle) and, at the same time, they are rigid enough to remain intact after binding to the particle surface (thus avoiding coating the particle with a lipid film). Both conditions are likely to be fulfilled in case of liposomes supplemented with 40 mol% cholesterol.
4. SUMMARY AND CONCLUDING REMARKS
As mentioned in the introduction, there is currently no unified view on how Q10 affects the fluidity and physico-chemical properties of lipid membranes. Thus, data and arguments suggesting both a
stabilizing[15, 16, 17, 36] and a destabilizing[9, 10, 61] effect have been put forward in the literature. Taken together, the results of the present study support the hypothesis of a stabilizing role of Q10 in phospholipid membranes. Besides the fluorescence anisotropy data, which report on the ordering effect of
18
Q10 at the molecular level, our findings show that Q10 has a clear influence also on the mechanical stability and physical properties of the membranes. Thus, in the presence of Q10 the POPC membranes become more resistant towards rupture and less permeable to hydrophilic solutes. The fact that the polyisoprenoid alcohol solanesol has no, or very little, effect on the investigated membrane properties implies that the quinone moiety is important for the stabilizing function of Q10. This conclusion is in agreement with previous studies performed with isoprenoid alcohols of various lengths, which showed a general tendency of these molecules to decrease membrane stability[62-64]. It could also be argued that the differences between Q10 and solanesol may arise from the extra isoprene unit found in the former. Previous studies comparing the DPH fluorescence anisotropy of lipid membranes containing Q10 and Q9[36] have, however, shown that both ubiquinones increase the lipid-chain order in an almost identical fashion, suggesting that the small difference in length cannot account for the different effects observed with Q10 and solanesol. The specific effect of the quinone group is difficult to reconcile with a complete intermembrane location of Q10, as have been put forward in some studies[65, 66]. It can be better understood if the quinone headgroup is assumed to at least partly reside close to the lipid headgroups in the membrane, in line with the conclusions drawn by Samori et al.[14]. Interestingly, a recent study[17] shows that inclusion of Q10, as well as solanesol, protect giant liposomes from collapse due to high salt stress. This finding suggests that the benzoquinone moiety is not necessary to reinforce the membrane against the forced release of water in response to osmotic shock conditions.
The chain ordering and membrane condensing effect found for Q10 in the present study is qualitatively similar to that observed for cholesterol. Given the different molecular size and structure it is clear, however, that the molecular mechanisms must be different in the two cases. The fact that a significantly smaller amount Q10 than cholesterol is needed to produce the same effect on, e.g., lipid packing order and spontaneous CF leakage could potentially be exploited for the development of cholesterol-free liposome-based drug delivery systems. Moreover, the results and conclusions drawn from our investigations constitute a step towards expanding the understanding of the role of Q10 in living systems. Our findings imply that Q10, apart from acting as a proton/electron pump and antioxidant, may play a role in membrane stabilization. It can be speculated that this function of Q10 would be of particular importance in the cholesterol-poor mitochondrial membranes. It is in this context interesting to note that the Q10 content in mitochondrial membranes is about 0.5-2 mol% with respect to the lipid content[67, 68] and thus close to the content in the liposomes investigated in the present study. It needs to be considered, however, that ~20 mol% of the total lipid-associated phosphorous in the mitochondrial membranes is contributed by
cardiolipins[69], which are structurally substantially different from the phosphocholines employed in the current study. It thus remains to be shown that the stabilizing effect of Q10 persists in membranes that more closely reflect the lipid composition in the native mitochondrial membranes.
The influence of the redox state of Q10 is a further matter for future studies. It has for instance been proposed that the positioning of the ubiquinone molecule in the membrane depends on its oxidation state, and, more specifically, that the reduced quinol group is located closer to the phospholipid headgroups than the corresponding oxidized quinone group[5]. Whether the proposed change in configuration, or other differences due to the redox state of Q10, affects the stability of the lipid membrane is yet to be explored.
19 5. ACKNOWLEDGEMENTS
Financial support from the Swedish Research Council and the Swedish Cancer Society is gratefully acknowledged. Christoffer Mårtensson, Andreas Hähle, Samir Naim, Maik Bartsch, Daniel Martínez Muñoz and Timothy Edwards are gratefully acknowledged for assistance with the experimental work. We also thank Dr. Jonny Eriksson (Department of Chemistry-BMC, Uppsala University) for help with the Cryo-TEM experiments. Lipoid Gmbh, Ludwigshafen, Germany, is acknowledged for the generous gift of POPC material.
6. REFERENCES
[1] F.L. Crane, Y. Hatefi, R.L. Lester, C. Widmer, isolation of a quinone from beef heart mitochondria, Biochim.
Biophys. Acta, 25 (1957) 220-221.
[2] M.D. Collins, D. Jones, Distribution of isoprenoid quinone structural types in bacteria and their taxonomic implications, Microbiol. Rev., 45 (1981) 316-354.
[3] L. Ernster, G. Dallner, Biochemical, Physiological and medical aspects of ubiquinone function, BBA-Mol. Basis
Dis., 1271 (1995) 195-204.
[4] I. Bogeski, R. Gulaboski, R. Kappl, V. Mirceski, M. Stefova, J. Petreska, M. Hoth, Calcium binding and transport by coenzyme q, J. Am. Chem. Soc, 133 (2011) 9293-9303.
[5] A. Ausili, A. Torrecillas, F. Aranda, A.D. Godos, S. Sánchez-Bautista, S. Corbalán-García, J.C. Gómez-Fernández, Redox state of coenzyme Q10 determines its membrane localization, Phys. Chem. B, 112 (2008) 12696-12702.
[6] C. Martensson, V.A. Hernandez, Ubiquinone-10 in gold-immobilized lipid membrane structures acts as a sensor for acetylcholine and other tetraalkylammonium cations, Bioelectrochemistry, 88 (2012) 171-180.
[7] F.L. Crane, New functions for coenzyme Q, Protoplasma, 213 (2000) 127-133.
[8] R. Alleva, M. Tomasetti, L. Andera, N. Gellert, B. Borghi, C. Weber, M.P. Murphy, J. Neuzil, Coenzyme Q blocks biochemical but not receptor-mediated apoptosis by increasing mitochondrial antioxidant protection, FEBS
Lett., 503 (2001) 46-50.
[9] T. Kagan, C. Davis, L.I.N. Lin, Z. Zakeri, Coenzyme Q10 can in some circumstances block apoptosis, and this effect is mediated through mitochondria, Ann. Ny. Acad. Sci., 887 (1999) 31-47.
[10] M. Turunen, J. Olsson, G. Dallner, Metabolism and function of coenzyme Q, BBA-Biomembranes, 1660 (2004) 171-199.
[11] M. Bentinger, M. Tekle, G. Dallner, Coenzyme Q – Biosynthesis and functions, Biochem. Biophys. Res. Co., 396 (2010) 74-79.
[12] M.F. Beal, Mitochondrial dysfunction and oxidative damage in Alzheimer's and Parkinson's diseases and coenzyme Q10 as a potential treatment, J. Bioenerg. Biomembr., 36 (2004) 381-386.
[13] C.M. Quinzii, S. DiMauro, M. Hirano, Human coenzyme Q(10) deficiency, Neurochem. Res., 32 (2007) 723-727.
[14] B. Samorì, G. Lenaz, M. Battino, G. Marconi, I. Domini, On coenzyme Q orientation in membranes: A linear dichroism study of ubiquinones in a model bilayer, J. Membrane Biol., 128 (1992) 193-203.
[15] M. Jemiola-Rzeminska, J. Kruk, M. Skowronek, K. Strzalka, Location of ubiquinone homologues in liposome membranes studied by fluorescence anisotropy of diphenyl-hexatriene and trimethylammonium-diphenyl-hexatriene,
Chem. Phys. Lipids, 79 (1996) 55-63.
[16] J.A. Lucy, J.T. Dingle, Fat-Soluble Vitamins And Biological Membranes, Nature, 204 (1964) 156-160. [17] D.C. Sevin, U. Sauer, Ubiquinone accumulation improves osmotic-stress tolerance in Escherichia coli, Nat.
Chem. Biol., 10 (2014) 266-272.
[18] C.F. Clarke, A.C. Rowat, J.W. Gober, Is CoQ a membrane stabilizer?, Nat. Chem. Biol., 10 (2014) 242-243. [19] A. Genz, J.F. Holzwarth, T.Y. Tsong, The influence of cholesterol on the main phase transition of unilamellar dipalmytoylphosphatidylcholine vesicles. A differential scanning calorimetry and iodine laser T-jump study,
Biophys. J., 50 (1986) 1043-1051.
[20] F. de Meyer, B. Smit, Effect of cholesterol on the structure of a phospholipid bilayer, P. Natl. Acad. Sci. USA, 106 (2009) 3654-3658.
20
[22] M.R. Vist, J.H. Davis, Phase equilibria of cholesterol/dipalmitoylphosphatidylcholine mixtures: deuterium nuclear magnetic resonance and differential scanning calorimetry, Biochemistry-US, 29 (1990) 451-464. [23] V.A. Hernandez, G. Karlsson, K. Edwards, Intrinsic Heterogeneity in Liposome Suspensions Caused by the Dynamic Spontaneous Formation of Hydrophobic Active Sites in Lipid Membranes, Langmuir, 27 (2011) 4873-4883.
[24] M. Almgren, K. Edwards, G. Karlsson, Cryo transmission electron microscopy of liposomes and related structures, Colloids Surfaces A, 174 (2000) 3-21.
[25] A. Kroger, Determination of contents and redox states of ubiquinone and menaquinone, Methods Enzymol., 53 (1978) 579-591.
[26] J. Murphy, J.P. Riley, A modified single solution method for the determination of phosphate in natural waters,
Anal. Chim. Acta, 27 (1962) 31-36.
[27] J.V. Paraskova, E. Rydin, P.J.R. Sjöberg, Extraction and quantification of phosphorus derived from DNA and lipids in environmental samples, Talanta, 115 (2013) 336-341.
[28] M. Silvander, P. Hansson, K. Edwards, Liposomal Surface Potential and Bilayer Packing As Affected by PEG−Lipid Inclusion, Langmuir, 16 (2000) 3696-3702.
[29] N. Kučerka, S. Tristram-Nagle, J. Nagle, Structure of Fully Hydrated Fluid Phase Lipid Bilayers with Monounsaturated Chains, J. Membrane Biol., 208 (2006) 193-202.
[30] J. Pan, S. Tristram-Nagle, J.F. Nagle, Effect of cholesterol on structural and mechanical properties of membranes depends on lipid chain saturation, Phys. Rev. E, 80 (2009) 021931.
[31] M.A. Stidham, T.J. McIntosh, J.N. Siedow, On the localization of ubiquinone in phosphatidylcholine bilayers,
BBA - Bioenergetics, 767 (1984) 423-431.
[32] H. Katsikas, P.J. Quinn, The polyisoprenoid chain-length influences the interaction of ubiquinones with phospholipid-bilayers, Biochim. Biophys. Acta, 689 (1982) 363-369.
[33] M. Johnsson, N. Bergstrand, K. Edwards, J.J.R. Stålgren, Adsorption of a PEO−PPO−PEO Triblock Copolymer on Small Unilamellar Vesicles: Equilibrium and Kinetic Properties and Correlation with Membrane Permeability,
Langmuir, 17 (2001) 3902-3911.
[34] H.-T. Cheng, Megha, E. London, Preparation and Properties of Asymmetric Vesicles That Mimic Cell Membranes: Effect upon lipid raft formation and transmembrane helix orientation, J. Biol. Chem., 284 (2009) 6079-6092.
[35] R.E. Dale, L.A. Chen, L. Brand, Rotational relaxation of the "microviscosity" probe diphenylhexatriene in paraffin oil and egg lecithin vesicles, J. Biol. Chem., 252 (1977) 7500-7510.
[36] M. Skowronek, M. Jemioła-Rzemińska, J. Kruk, K. Strzałka, Influence of the redox state of ubiquinones and plastoquinones on the order of lipid bilayers studied by fluorescence anisotropy of diphenylhexatriene and trimethylammonium diphenylhexatriene, BBA - Biomembranes, 1280 (1996) 115-119.
[37] A. Arora, H. Raghuraman, A. Chattopadhyay, Influence of cholesterol and ergosterol on membrane dynamics: a fluorescence approach, Biochem. Biophys. Res. Co, 318 (2004) 920-926.
[38] D. Kashchiev, D. Exerowa, Bilayer lipid membrane permeation and rupture due to hole formation, BBA -
Biomembranes, 732 (1983) 133-145.
[39] S. Paula, A.G. Volkov, A.N. VanHoek, T.H. Haines, D.W. Deamer, Permeation of protons, potassium ions, and small polar molecules through phospholipid bilayers as a function of membrane thickness, Biophys. J., 70 (1996) 339-348.
[40] D. Needham, R.S. Nunn, Elastic-deformation and failure of lipid bilayer-membranes containing cholesterol,
Biophys. J., 58 (1990) 997-1009.
[41] J.M. Smaby, M.M. Momsen, H.L. Brockman, R.E. Brown, Phosphatidylcholine acyl unsaturation modulates the decrease in interfacial elasticity induced by cholesterol, Biophys. J., 73 (1997) 1492-1505.
[42] M. Silvander, M. Johnsson, K. Edwards, Effects of PEG-lipids on permeability of
phosphatidylcholine/cholesterol liposomes in buffer and in human serum, Chem. Phys. Lipids, 97 (1998) 15-26. [43] M. Ueno, Partition behavior of a nonionic detergent, octyl glucoside, between membrane and water phases, and its effect on membrane-permeability, Biochemistry, 28 (1989) 5631-5634.
[44] K. Edwards, M. Almgren, Kinetics of surfactant-induced leakage and growth of unilamellar vesicles, Surfactants and Macromolecules : Self-Assembly at Interfaces and in Bulk, Prog. Coll. Pol. Sci. S, 82 (1990) 190-197.
[45] M.T. Paternostre, M. Roux, J.L. Rigaud, Mechanisms of membrane-protein insertion into liposomes during reconstitution procedures involving the use of detergents .1. solubilization of large unilamellar liposomes (prepared by reverse-phase evaporation) by triton x-100, octyl glucoside, and sodium cholate, Biochemistry, 27 (1988) 2668-2677.
21
[46] M. Johnsson, K. Edwards, Interactions between Nonionic Surfactants and Sterically Stabilized Phophatidyl Choline Liposomes, Langmuir, 16 (2000) 8632-8642.
[47] M. Almgren, Mixed micelles and other structures in the solubilization of bilayer lipid membranes by surfactants,
BBA-Biomembranes, 1508 (2000) 146-163.
[48] D. Lichtenberg, Characterization of the solubilization of lipid bilayers by surfactants, BBA-Biomembranes, 821 (1985) 470-478.
[49] D. Lichtenberg, H. Ahyayauch, A. Alonso, F.M. Goni, Detergent solubilization of lipid bilayers: a balance of driving forces, Trends Biochem. Sci., 38 (2013) 85-93.
[50] S. Almog, B.J. Litman, W. Wimley, J. Cohen, E.J. Wachtel, Y. Barenholz, A. Ben-Shaul, D. Lichtenberg, States of aggregation and phase transformations in mixtures of phosphatidylcholine and octyl glucoside, Biochemistry, 29 (1990) 4582-4592.
[51] M. Apel-Paz, G.F. Doncel, T.K. Vanderlick, Surfactants as microbicidal contraceptives: A calorimetric study of partitioning and translocation in model membrane systems, Ind. Eng. Chem, 47 (2008) 3554-3561.
[52] M.R. Wenk, T. Alt, A. Seelig, J. Seelig, Octyl-beta-D-glucopyranoside partitioning into lipid bilayers: Thermodynamics of binding and structural changes of the bilayer, Biophys. J., 72 (1997) 1719-1731. [53] E. Schnitzer, M.M. Kozlov, D. Lichtenberg, The effect of cholesterol on the solubilization of
phosphatidylcholine bilayers by the non-ionic surfactant Triton X-100, Chem. Phys. Lipids, 135 (2005) 69-82. [54] M.V. Voinova, M. Rodahl, M. Jonson, B. Kasemo, Viscoelastic acoustic response of layered polymer films at fluid-solid interfaces: Continuum mechanics approach, Phys. Scripta, 59 (1999) 391-396.
[55] M. Rodahl, F. Hook, C. Fredriksson, C.A. Keller, A. Krozer, P. Brzezinski, M. Voinova, B. Kasemo, Simultaneous frequency and dissipation factor QCM measurements of biomolecular adsorption and cell adhesion,
Faraday Discuss., 107 (1997) 229-246.
[56] C.A. Keller, B. Kasemo, Surface specific kinetics of lipid vesicle adsorption measured with a quartz crystal microbalance, Biophys. J., 75 (1998) 1397-1402.
[57] X.M. Liang, G.Z. Mao, K.Y.S. Ng, Mechanical properties and stability measurement of cholesterol-containing liposome on mica by atomic force microscopy, Colloid Interf. Sci., 278 (2004) 53-62.
[58] R. Bordes, F. Hook, Separation of Bulk Effects and Bound Mass during Adsorption of Surfactants Probed by Quartz Crystal Microbalance with Dissipation: Insight into Data Interpretation, Anal. Chem., 82 (2010) 9116-9121. [59] D. Needham, T.J. McIntosh, E. Evans, Thermomechanical and transition properties of
dimyristoylphosphatidylcholine cholesterol bilayers, Biochemistry, 27 (1988) 4668-4673.
[60] G.J. Hardy, R. Nayak, S.M. Alam, J.G. Shapter, F. Heinrich, S. Zauscher, Biomimetic supported lipid bilayers with high cholesterol content formed by α-helical peptide-induced vesicle fusion, J. Mater. Chem., 22 (2012) 19506-19513.
[61] R. Fato, E. Bertoli, G.P. Castelli, G. Lenaz, Fluidizing effect of endogenous ubiquinone in bovine heart mitochondrial-membranes, FEBS Lett., 172 (1984) 6-10.
[62] T. Janas, T. Chojnacki, E. Swiezewska, T. Janas, The effect of undecaprenol on bilayer lipid membranes, Acta
Biochim. Pol., 41 (1994) 351-358.
[63] T. Janas, K. Nowotarski, W.I. Gruszecki, The effect of hexadecaprenol on molecular organisation and transport properties of model membranes, Acta Biochim. Pol., 47 (2000) 661-673.
[64] K. Walinska, Comparison of the influence of the polyprenol structure on model membranes, Desalination, 163 (2004) 239-245.
[65] H. Katsikas, P.J. Quinn, Fluorescence probe studies of the distribution of ubiquinone homologues in bilayers of dipalmitoylglycerophosphocholine, Eur. J. Biochem., 131 (1983) 607-612.
[66] T. Hauß, S. Dante, T.H. Haines, N.A. Dencher, Localization of coenzyme Q10 in the center of a deuterated lipid membrane by neutron diffraction, BBA-Bioenergetics, 1710 (2005) 57-62.
[67] Fleische.S, G. Rouser, Fleische.B, A. Casu, Kritchev.G, Lipid composition of mitochondria from bovine heart liver and kidney, J. Lipid Res., 8 (1967) 170-180.
[68] F. Aberg, Y.Y. Zhang, H. Teclebrhan, E.L. Appelkvist, G. Dallner, Increases in tissue levels of ubiquinone in association with peroxisome proliferation, Chem. Biol. Interact., 99 (1996) 205-218.
[69] R. Hovius, H. Lambrechts, K. Nicolay, B. Dekruijff, Improved methods to isolate and subfractionate rat-liver mitochondria - lipid-composition of the inner and outer-membrane, Biochim. Biophys. Acta, 1021 (1990) 217-226.