www.vti.se/publications
Katja Kircher Sven-Olof Lundkvist
The infl uence of lighting, wall colour and
inattention on traffi c safety in tunnels
A simulator study
VTI rapport 724APublisher: Publication:
VTI rapport 724A
Published: 2011 Project code: 40859 Dnr: 2010/0403-26
SE-581 95 Linköping Sweden Project:
TBD – Tunnel illumination and design
Author: Sponsor:
Katja Kircher & Sven-Olof Lundkvist The Swedish Transport Administration
Title:
The influence of lighting, wall colour and inattention on traffic safety in tunnels – A simulator study
Abstract (background, aim, method, result) max 200 words:
Even though the crash risk in tunnels is rather lower than on the open road network, crash consequences can be very severe. Therefore it is of high importance to assure high safety standard in tunnels, which includes, but is not limited to, an appropriate illumination. The aim of this study was to investigate in which way different levels of illumination and brightness of the tunnel walls influence the behaviour of attentive and inattentive drivers.
The study was conducted in the Simulator III at VTI, which is a high-fidelity simulator with linear motion in lateral direction. A within-subjects design was employed, and 24 participants took part in the tests. Illumination was varied on three levels and tunnel wall colour and driver attention were varied on two levels each. Driving data, eye tracking data and subjective data were collected and analysed for an overtaking event and for an event-free driving situation.
Bright walls were more important for experienced safety and comfort than high illumination level, as long as the illumination was sufficiently bright. Further, driving behaviour and gaze behaviour were heavily influenced by driver state, with distracted drivers showing more unsafe behaviour. Additionally, bright walls received slightly lower demand ratings than dark walls.
Keywords:
tunnel, illumination, driving behaviour, eye tracking, gaze, distraction, attention, inattention
Utgivare: Publikation:
VTI rapport 724A Utgivningsår: 2011 Projektnummer: 40859 Dnr: 2010/0403-26 581 95 Linköping Projektnamn:
TBD – Tunnelbelysning och tunneldesign
Författare: Uppdragsgivare:
Katja Kircher och Sven-Olof Lundkvist Trafikverket
Titel:
Trafiksäkerhet i tunnlar – inverkan av belysning, väggarnas ljushet och förarens uppmärksamhetsgrad – en simulatorstudie
Referat (bakgrund, syfte, metod, resultat) max 200 ord:
Även om olycksrisken i tunnlar är lägre än på landsvägar kan skadeföljden bli allvarlig. Därför är det viktigt att säkerställa en hög säkerhet i tunnlar, vilket bland annat ställer krav på belysningen. Denna studie har syftat till att undersöka hur belysningsnivån och tunnelväggarnas ljushet påverkar beteendet hos uppmärksamma och mindre uppmärksamma förare.
Studien genomfördes i VTI:s simulator III, som är en avancerad simulator med linjär rörelse i sidled. I studien deltog 24 försökspersoner, som alla fick köra samtliga kombinationer av belysningsnivå, tunnel-väggar och distraktion. Belysningsstyrkan hade tre nivåer, medan tunneltunnel-väggarnas ljushet och graden av distraktion hade vardera två nivåer. Kördata, ögonrörelsedata och subjektiva data samlades in och analyserades både för en omkörningssituation och under fri körning.
Ljusa tunnelväggar är viktigare för upplevd säkerhet och komfort än hög belysningsnivå så länge denna nivå är tillräcklig. Körbeteendet och ögonrörelserna påverkades starkt negativt av distraktion på så sätt att försökspersonerna körde mindre säkert då de tvingades lösa en sekundär uppgift. Ljusa väggar innebar en något mindre mental belastning.
Nyckelord:
tunnel, belysning, körbeteende, blickbeteende, blick, distraktion, uppmärksamhet, ouppmärksamhet
ISSN: Språk: Antal sidor:
Preamble
This project was commissioned by the Swedish Transport Administration. The studies were conducted in December 2010. I warmly thank all those who were involved and made this study possible. Special thanks go to Paul Green at UMTRI for generous access to the demand rating method.
Linköping June 2011
Quality review
Review seminar was carried out on 29 April 2011 where Carina Fors, VTI, reviewed and commented on the report. Katja Kircher has made alterations to the final manuscript of the report. The research director of the project manager Jan Andersson, VTI,
examined and approved the report for publication on 19 May 2011.
Kvalitetsgranskning
Granskningsseminarium genomfört 2011-04-29 där Carina Fors, VTI, var lektör. Katja Kircher har genomfört justeringar av slutligt rapportmanus. Projektledarens närmaste chef Jan Andersson, VTI, har därefter granskat och godkänt publikationen för
Table of contents
Summary ... 5
Sammanfattning ... 7
1 Introduction ... 9
1.1 Illumination and Energy Consumption ... 9
1.2 Regulations in Different Countries ... 9
1.3 Safety... 10
1.4 Comfort ... 11
1.5 Purpose of the Study ... 12
2 Background ... 13
2.1 Traffic Events and Situations ... 14
2.2 Level of Activation ... 14 2.3 Performance Indicators ... 19 2.4 Preparations ... 22 3 Method ... 30 3.1 Apparatus ... 30 3.2 Participants ... 37 3.3 Procedure ... 38 3.4 Analysis ... 39 4 Results ... 41
4.1 Performance Over Time ... 41
4.2 Performance per Factor ... 44
5 Discussion ... 62
5.1 Performance Over Time ... 62
5.2 Secondary Task Performance ... 63
5.3 Driving Behaviour ... 63 5.4 Driver Behaviour ... 64 5.5 Demand Ratings ... 66 5.6 Questionnaire ... 67 5.7 Method ... 68 5.8 Future Research ... 71 6 Conclusions ... 76 References ... 77
The influence of lighting, wall colour and inattention on traffic safety in tunnels – A simulator study
by Katja Kircher and Sven-Olof Lundkvist
VTI (Swedish National Road and Transport Research Institute) SE-581 95 Linköping Sweden
Summary
Even though the crash risk in tunnels is rather lower than on the open road network, crash consequences can be very severe. Therefore it is of high importance to assure high safety standard in tunnels, which includes, but is not limited to, an appropriate
illumination. Too low illumination levels may compromise safety, while unnecessarily high levels waste resources. In this study it was investigated in which way different levels of illumination and brightness of the tunnel walls influence the behaviour of attentive and inattentive drivers.
The study was conducted in the Simulator III at VTI, which is a high-fidelity simulator with linear motion in lateral direction. A within-subjects design was employed, and 24 participants took part in the test. Illumination was varied on three levels and tunnel wall colour and driver attention were varied on two levels each. This yields twelve different combinations, which meant that each participant drove through twelve tunnels with a length of 4 km. The order was randomised with certain restrictions between
participants. The tunnels were separated by 2 km long open motorway sections. In each tunnel the participant encountered an overtaking situation, which demanded a decision on the tactical level.
The collected data consisted of driving behaviour data as logged from the simulator, eye tracking data, secondary task performance data, subjective demand ratings while
driving, and subjective ratings and comparisons post-test. The data collected during driving were analysed for the situation with the overtaking event and in addition for an an event-free driving situation further down the tunnel.
The main results were:
Bright walls are more important for experienced safety and comfort than high illumination levels, as long as the illumination is sufficiently bright.
Driving behaviour and gaze behaviour were heavily influenced by driver state, with distracted drivers showing more unsafe behaviour.
A larger percentage of long glances away from the forward roadway and lower attention levels were found for tunnels with dark walls.
The participants experienced a higher task demand during the distracted condition as compared to non-distracted. They also experienced the overtaking event as more demanding than driving freely.
Bright walls received slightly lower demand ratings.
Secondary task performance did not vary across conditions.
It can be concluded that bright walls enhance traffic safety and are conducive to the drivers’ to feel safe and comfortable, provided an acceptable level of illumination. Absolute levels are difficult to come by based on a simulator study, as the range of illumination is much more limited in the simulator than in reality. For detailed results on
absolute illumination levels it is indispensable to run real world trials, even though the simulator proved useful for the evaluation of relative levels.
As performance was degraded for distracted drivers, it is recommended to address the issue of attention in future studies, because inattention and monotony are known risks especially in longer tunnels. It is also recommended to evaluate design features related to visual guidance, and to investigate other architectural measures, which might help decrease energy consumption without compromising traffic safety.
Trafiksäkerhet i tunnlar – inverkan av belysning, väggarnas ljushet och förarens uppmärksamhetsgrad – en simulatorstudie
av Katja Kircher och Sven-Olof Lundkvist VTI
581 95 Linköping
Sammanfattning
Även om olycksrisken i tunnlar är lägre än på landsvägar kan skadeföljden bli allvarlig. Därför är det viktigt att säkerställa en hög säkerhet i tunnlar, vilket bland annat ställer krav på belysningen. Alltför låg belysningsnivå kan medföra försämrad säkerhet, medan alltför hög nivå innebär slöseri med resurser och onödig miljöpåverkan. Denna studie har syftat till att undersöka hur belysningsnivån och tunnelväggarnas ljushet påverkar beteendet hos uppmärksamma och mindre uppmärksamma förare.
Studien genomfördes i VTI:s simulator III, som är en avancerad simulator med linjär rörelse i sidled. I studien deltog 24 försökspersoner, som alla fick köra samtliga kombi-nationer av belysningsnivå, tunnelväggar och distraktion. Belysningsstyrkan hade tre nivåer, medan tunnelväggarnas ljushet och graden av distraktion hade vardera två nivåer. Detta ger 12 olika betingelser, vilket innebar att varje försöksperson körde genom 12 tunnlar, vardera med en längd av 4 km. De 12 betingelserna presenterades i slumpmässig ordning, med vissa restriktioner. Mellan tunnlarna körde man på 2 km vanlig motorväg i öppet landskap. I varje tunnel kom försökspersonen ifatt ett annat fordon samtidigt som denne blev upphunnen av ett tredje fordon. Denna arrangerade trafiksituation framtvingade ett beslut på taktisk nivå.
Från simulatorns logg har körbeteendedata registrerats. Vidare registrerades
ögonrörelser, förmåga att lösa sekundära uppgifter samt subjektiv mental belastning. Med hjälp av en enkät efter körningen registrerades försökspersonernas subjektiva bedömning av säkerhet och komfort i tunnlarna. Data från körningen analyserades för två situationer – dels för körning utan påverkan från övrig trafik, dels för omkörning i samband med upphinnande.
Resultaten visar bland annat följande:
Ljusa tunnelväggar är viktigare för upplevd säkerhet och komfort än hög belys-ningsnivå så länge denna nivå är tillräcklig
Körbeteendet och ögonrörelserna påverkades starkt negativt av distraktion på så sätt att försökspersonerna körde mindre säkert då de tvingades lösa en sekundär uppgift
Förarna tog bort blicken från vägen framöver oftare och under längre tid samt var allmänt mindre uppmärksamma i de tunnlar som hade mörka väggar Deltagarna upplevde en högre mental belastning då de distraherades och i
omkörningssituationerna
Ljusa väggar innebar en något mindre mental belastning
Förmågan att utföra den sekundära uppgiften varierade inte över de olika betingelserna.
Slutsatsen är att ljusa tunnelväggar förbättrar trafiksäkerheten och bidrar till en känsla av säkerhet och komfort under förutsättning att belysningsnivån är tillräckligt hög. Det är svårt att från en simulatorstudie avgöra vad ”tillräckligt hög” är eftersom nivåerna i
verkligheten inte kan översättas direkt till vad simulatorn visar. Belysningsnivåer måste därför sannolikt studeras i en verklig tunnel där dessa kan varieras.
Eftersom körbeteendet försämrades vid distraktion bör detta undersökas närmare i fram-tida studier, framförallt som monotoni och ouppmärksamhet är kända riskfaktorer i långa tunnlar. Vidare bör samband mellan tunnelutformningen och den visuella led-ningen undersökas, då detta kan leda till minskad energikonsumtion utan att ge avkall på trafiksäkerheten.
1 Introduction
There are many reasons for using tunnels in road traffic, amongst those are that tunnels can help reducing the travel time, they can connect areas, and they improve the urban environment. Additionally they can keep corridors open in inclement weather by eliminating risks for landslides and avalanches across roads, and by avoiding road closures in winter. In some areas they are also built to avoid the risk of rock fall. However, there are also some disadvantages connected to tunnels. There is a lack of daylight and of visible escape routes. Walls are close to the road, hard and unforgiving. The air is not as clean as outside, and there are usually no landmarks, making navigation more difficult and instilling a feeling of “not getting anywhere” in the driver. Related to this is the lack of variation, which can lead to boredom and fatigue, especially in longer tunnels. Furthermore, tunnels with plain walls make it more difficult for the driver to estimate one’s own speed.
What makes tunnels special is the potential for catastrophes, examples for which are the Tauern tunnel fire in 1999 (Leitner, 2001), the Channel tunnel fire in 1996 (Kirkland, 2002), the Gotthard tunnel fire in 2001 (Carvel & Marlair, 2005), and the Mont Blanc tunnel fire in 1999, killing 39 people (ibid.).
1.1
Illumination and energy consumption
The illumination of a tunnel can change the impression it makes on the driver quite substantially, and it would appear obvious that a brighter tunnel should be a safer tunnel. Of course tunnels have to be safe, but is it the illumination, and the illumination alone, which determines how safe a tunnel is? Illumination consumes energy and if energy consumption could be reduced it would be good for the environment and the tunnel budgets. This, in turn, could make it possible to invest in other safety features which are more effective.
The relationship between illumination and energy consumption is not linear. Roughly, for a high pressure sodium lamp, a 50% cut of the illumination level will save 35% energy. As an example, a typical tunnel lighting fulfilling the Swedish regulations will use 20 kW per kilometre. As the lighting is on 24 hours, this means that the energy consumption is almost 180,000 kWh per year and kilometre. If this could be reduced by 35%, without affecting traffic safety or comfort, approximately 60,000 kWh per kilo-metre would be saved every year, which with today’s energy price is a significant saving.
Furthermore, as the regulations put a demand on the luminance of the road surface, even more energy could be saved by the use of a bright road surface. The luminance of the road surface is the product of the illumination and the luminance coefficient of the road surface. The latter describes the reflection properties of the surface; a high coefficient means that the luminance in the regulations can be achieved with less illumination. Consequently, energy consumption in tunnels might be reduced if both the lighting and the road pavement are adapted to the needs of the driver.
1.2
Regulations in different countries
The tunnel lighting regulations are rather complex, using different lighting levels in different zones of the tunnel. Furthermore, the requirement on lighting may be dependent on the traffic intensity, the speed limit and the outdoor conditions
(day/night). As a base, many countries use CIE Report 88-1990 with or without small changes. Table 1 summarises the regulations in the interior zone of the tunnel in some Nordic countries and the UK.
Table 1 Requirement on road surface luminance [cd/m2] in the interior zone of the tunnel.
Country Low speed, low traffic High speed, high traffic
Sweden 3–6 5–10
Denmark 1 12
Norway 0.5 4
United Kingdom 1.5–3 4–10
Table 1 shows a large variation between the luminance level requirements in the four countries. A reasonable question is if the Swedish requirement is too high? Or maybe the Norwegian too low?
Common for all regulations is that there is a requirement on the luminance of the road surface, never on the walls or roof. Some regulations recommend the use of white walls up to a certain height, but without mentioning any figure. It may be that a light wall is more important than a bright road surface.
1.3 Safety
Norwegian data, which consider almost 800 tunnels adding up to a total distance of 779 km show that the crash risk in tunnels is comparable to the crash risk on normal roads (Amundsen, 1994; Amundsen & Engelbrektsen, 2009). More precisely, it can be said that there occur slightly fewer crashes in tunnels (0.11 crashes per 1 000 000 driven km) than on normal roads (0.13 crashes per 1 000 000 driven km), but they tend to have more severe consequences. While on normal Norwegian roads 0.03 fatalities occur per one million driven km, in tunnels the frequency more than doubles to 0.07. Generally the crash risk is higher in the entrance zone of the tunnel than further into the tunnel. This applies to both the first 50 m inside of the tunnel and the last 50 m before the tunnel. The fatality risk, however, increases dramatically from 0.02 just outside of the tunnel to 0.06 on the first 50 m inside of the tunnel. The risk increases further to 0.09 in the section of 50 m to 150 m into the tunnel, while it then sinks slightly to 0.07 in the middle section of the tunnel. There is an indication that the risk might increase with increasing tunnel length, but so far only tunnels up to a length of 3,000 m have been investigated. In comparison to normal roads, the risk to get involved in a crash with a vehicle travelling in the same direction is almost doubled, while the risk to crash in connection to a junction or with a pedestrian are much lower. This is easily explained by the general lack of junctions and pedestrians in tunnels. Crashes with vehicles driving in the same direction account for approximately 43% of all tunnel crashes in Norway. Next highest rank single vehicle crashes with 36% of all crashes, which roughly corresponds to the number for normal roads. The highest likelihood for crashes is during rush hours, even when taking the higher traffic volumes into account.
It was found, too, that tunnels with higher speed limits account for a relatively lower crash frequency, but the consequences when involved in a crash are far worse than at lower speeds.
Similar data were obtained from Austria (Nussbaumer, 2007). In tunnels the likelihood of crashes was lower, but the risk of fatalities given a crash was higher than on the open road network. Additionally it was found that the probability of being injured or killed is 19% higher in tunnels with bi-directional traffic than in tunnels with uni-directional traffic (Robatsch & Nussbaumer, 2004). Nussbaumer (2007) mentions that the main reasons named for tunnel crashes in Austrian police reports were lacking vigilance (fatigue, distraction, inattention) and wrong behaviour (issues with safety distance, lane keeping, overtaking).
To conclude, it can be stated that tunnels are not more dangerous in terms of accident frequency than normal roads, rather to the contrary, in fact, but once a crash has
happened the probability for severe injuries to occur is greater in tunnels than on normal roads. Single-tube tunnels are more dangerous than double tube tunnels, and boredom and related factors are a concern in tunnels, which is probably aggravated in long tunnels.
1.4 Comfort
However, driving is not only about objective facts. Tunnel anxiety is a phenomenon widespread enough to be of relevance, especially if it is so pronounced that the person in question avoids driving through tunnels altogether. It is related to claustrophobia and appears often in combination with other types of phobia.
A Norwegian survey (Flø & Jenssen, 2007) revealed that 2–3% of the population experience severe claustrophobia in tunnels, 20% feel anxious and another 15% experience unpleasant feelings and are afraid in tunnels. Thus, more than a third of the population experience anxiousness to some degree while in tunnels. The anxiousness levels are higher for subsea tunnels, with seven per cent of the Norwegians participating in the survey stating they would never drive through such a tunnel.
These facts make it very clear that objective safety is not the only parameter to consider when designing tunnels that are supposed to be and feel safe. There have been some initiatives to make tunnels less uniform and boring visually. In the design of the Laerdals Tunnel in Norway, which is more than 24 km long, both driver fatigue, anxiousness and boredom were taken into account. Three big caves are placed at intervals of 6 km. These caves are lit with blue light and some yellow light at the fringes, giving an impression of sunrise, while the remaining parts of the tunnel are lit with white light (Flø & Jenssen, 2007).
Preceding trials with Norwegian and Chinese drivers showed that a red colouring should be avoided, as it can give rise to the fear of fire in the tunnel. Similarly, for tunnels that have subsea sections it is not recommendable to remind the drivers of their being underneath a body of water by designing the tunnel accordingly (Flø & Jenssen, 2007).
1.5
Purpose of the study
Given the obvious demand for safe tunnels on the one side, and the very realistic costs for the environment as well as of monetary character, it is important to establish scientific support for the question whether it is possible to reduce the illumination in tunnels below the levels demanded today by Swedish regulations. As interactions both with the brightness of the tunnels walls and with the attentional state of the driver were considered to be possible, these factors were included in the study. Bright walls might increase visibility as compared to dark walls at equal levels of illumination. Attentional state can play a role when it comes to tunnel driving, as it is a comparatively
monotonous type of driving. Therefore, in the present study three levels of illumination were investigated in combination with light versus dark tunnel walls and attentive versus visually distracted drivers.
To ensure high levels of control over the situation and enable strict reproducibility it was decided to conduct a simulator study, which should deliver the first answers in what hopefully is going to be a series of connected experiments. The specific questions that were raised for the study at hand to answer were:
Does the illumination level in a tunnel influence traffic safety? If so, in which way? Does the brightness of the wall in a tunnel influence traffic safety? Is there an interaction with distraction, in the way that brightness might get crucial first when drivers are not fully attentive? Do the factors mentioned above influence experienced comfort and safety, and if so, in which way?
2 Background
Only very limited research effort has been devoted to the analysis of driver behaviour in tunnels. Manser and Hancock (2007) addressed the issue of how speed can be
influenced with the help of patterns and texture on the roadside. The possibility to use the tunnel walls to convey information to the drivers was already investigated earlier by Carmody (1997). In the Manser and Hancock study a tunnel scenario was used, as it allows the isolation of visual factors. The study was conducted in a driving simulator, with the tunnel wall design as a four-level within-subjects factor and texture as a two-level between subjects factor. The different tunnel wall designs were 1. wide stripes that gradually became thinner, 2. thin stripes that gradually became wider, 3. thin stripes throughout and 4. no stripes at all. For half of the participants the walls carried an additional texture, while it was smooth for the other half of the participants. The main findings were that was, in fact, possible to influence driving speed via tunnel wall design, with the participants slowing down when stripe width decreased and speeding up with increasing stripe width. The effect was attenuated by a texture in the wall, which can most likely be explained by the additional peripheral speed information provided by the texture. This indicates that structure or texture in the tunnel walls is beneficial if the aim is to help the driver keep his or her speed, while measures to influence speed with patterns work best without an underlying structure.
As mentioned, these studies were conducted in a simulator, and even though it can be expected that the results can be transferred to real-world settings, a systematic
validation would strengthen them.
Such an effort was made by Törnros (1998), who investigated driver speed and lateral position in a real tunnel and an equivalent simulated tunnel. In this study the wall pattern and structure were not modified. The study featured a within subjects design, where each participant drove through the tunnel twelve times in the simulator and twelve times in the real tunnel. Thus, each driver drove on each of three lanes in both directions through the tunnel, once with the speedometer available and once with the speedometer covered. The general finding was that for speed a relative validity could be observed, that is, the speed profile was similar in the simulator and in the real tunnel, except for an offset with consistently higher speeds in the simulator. The same effect had also been observed for validation studies of open road driving (Alm, 1995; Harms, 1994). Additionally, Törnros observed that drivers tended to position the car in the lane such that they kept some distance to the nearest wall. This effect was greater when the wall was located to the left of the driver, that is, closer to the driver, as left-hand steering was used. The effect could be observed both in the simulator and in the real tunnel, with a slightly greater effect in the latter.
These results are promising, as a confirmed relative validity allows conclusions about which design is likely to be more effective with respect to speed choice or lane
positioning in a direct comparison in the simulator. Even though the absolute values can be about 3–7 km/h higher in the simulator than in the field, it can be assumed that the internal order should remain unaffected in real traffic, which is a valuable input to the study at hand.
2.1
Traffic events and situations
Driving alone on a road without junctions is a simple task, which is mainly made up of keeping an appropriate speed and not leaving the own lane, or at least the road. In normal driving, however, it is often necessary to interact with other road users that either cross one’s path or block one’s way. Many of these manoeuvres are well learned, and rules exist that tell road users who has the right to go first, and who has to yield. In many of those manoeuvres, however, judgement is required on the road users’ side. When turning left in right hand traffic, crossing the oncoming traffic lane can be necessary. The driver has to judge whether the gap between vehicles is large enough to allow a safe turn. When overtaking on a motorway, the rear view mirror has to be checked first, and then a judgement has to be made whether a lane change is safe, or whether another vehicle approaches too fast from behind.
In tunnels the number of interactions are rather limited, compared to the open road network, and especially in comparison to inner-city traffic, but nevertheless, interactions are possible. As it is possible that the factors investigated in the present study may influence the drivers’ judgements how to handle an event more complex than pure lane tracking, it was decided to include a common overtaking event into the study. It should represent a relatively simple situation, which is frequently encountered on the motorway during regular driving, but which still requires a decision on the part of the driver. The overtaking event that was selected for the present study required the driver to make a judgement whether he could change lanes to overtake two slower vehicles ahead without getting in conflict with a car approaching from behind. If the driver changed lanes to overtake a slower vehicle ahead he gained a bit of time and reduced his travel time. If the driver did not overtake, he did not risk getting into a conflict with the car approaching from behind, but he had to brake slightly and wait for the car to pass before he could overtake the slower vehicle and proceed at the desired speed.
This situation was selected, as it was not critical, but still required judgement from the driver. As mentioned, it is a very common situation in motorway driving, which is of advantage, as it should be repeated twelve times throughout the test situation, once in every tunnel. Repetition in every tunnel was necessary to allow comparisons of the drivers’ behaviour in all tested situations. It was assumed that the participants would learn quickly that the situation was recurring in each tunnel, but this was deemed not to be of major concern, as the behaviour still could vary, depending on other
circumstances like lighting, the tunnel wall colour or other activities executed by the driver. It was assumed that a situation that demanded a tactical decision could possibly yield results that allowed conclusions about the driver’s ability to judge the situation and his own role in guaranteeing smoothly flowing traffic.
2.2 Level
of
activation
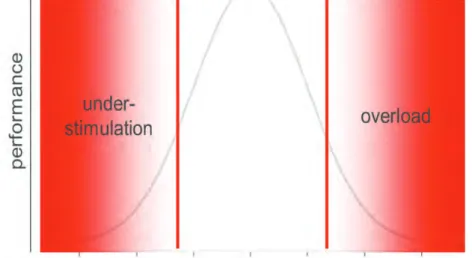
Both constant high levels and constant low levels of activation can be detrimental for driving. Humans perform best under medium activation levels (cf. Figure 1), as was shown as early as 1908 (Yerkes & Dodson). Much research has been done on driving performance while conducting secondary tasks (see McCartt, Hellinga, & Bratiman, 2006; Young, Regan, & Hammer, 2003 for reviews), and also on complex driving situations (Horberry, Anderson, Regan, Triggs, & Brown, 2006). When the mental workload becomes too high, performance breaks down, and the risk for an incident and a crash increases.
Maybe not as obvious, but nonetheless important, also longer periods of very little activation are dangerous, as they can lead to boredom and fatigue. Driving becomes more a vigilance task than a continuous activity. The driver can get into a state of
stupor, not really realising any more when he or she has to get back into the loop and act (Thiffault & Bergeron, 2003; Ting, Hwang, Doong, & Jeng, 2008). Alternatively, the driver might look for other activation, starting to make phone calls, surf on the net, watch movies, eat or even read a book. These non-driving related activities might usurp the driver enough that he or she misses information essential for driving.
Therefore, a medium level of activation, possibly with some variation, should be the goal for road design, and obviously also tunnel design.
Figure 1 Illustration of a distribution of workload and the risks of overload and under-stimulation.
2.2.1 Quantifying complexity in traffic
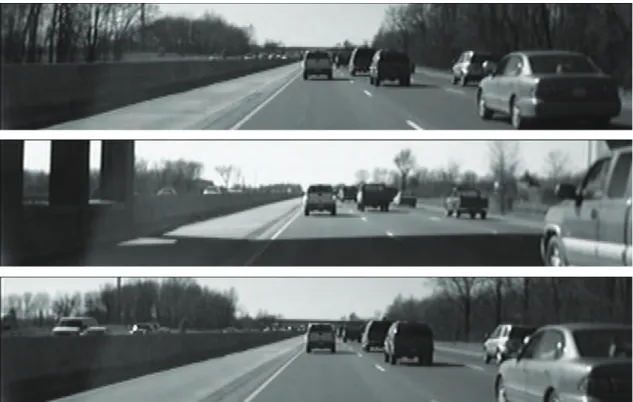
Both for research purposes and for real world applications it would be very useful if an objective scaling of traffic situations existed with respect to the demand they place on road users. Although there have been several attempts at categorising traffic situations (e.g. Fastenmeier, 1995), there is not really a good standard yet. Recently a new approach was developed at UMTRI (Schweitzer & Green, 2007). With this method short film clips of traffic scenes are compared to two “anchor scenes”, which were given the demand values “2” and “6” on an open scale. The clips stem from the ACAS-FOT study conducted in the USA at UMTRI (Ervin et al., 2005a, 2005b; Green et al., 2007). On each film a motorway with three lanes was visible. In the case of demand “2” the traffic volume was low, corresponding to “Level of Service A” according to US standards (TRB, 2000), which means that traffic flows at or above the posted speed limit, and all road users have complete mobility between the lanes (Figure 2). The driver occupied the right lane. In the case of demand “6” the traffic density was higher (Level of Service E, meaning that the traffic flow is irregular and ususally below the posted speed limit with rapidly varying speed changes), and the driver occupied the left lane (Figure 3). “Demand” is used instead of “workload”, due to the fact that a certain level of objectivity should be achieved. The same demand level can still lead to different workload levels in different drivers.
Figure 2 Three still pictures from the anchor film clip corresponding to demand rating “2”, with kind permission of Paul Green at UMTRI.
Figure 3 Three still pictures from the anchor film clip corresponding to demand rating “6”, with kind permission of Paul Green at UMTRI.
The participants were free to study and watch the anchor films as they felt necessary. They were then presented with other traffic scenes, three at a time, which they had to rank in comparison to the anchor clips.
The purpose of the anchor clips was to introduce a level of objectivity, but still have the judgements made by humans out of an overall impression, instead of exclusively counting lanes and objects and inferring a complexity level from that. Rather, with access to both the ratings and the physical features in the scene, a matching can be made between the judgements given by the participants and features that might possibly influence their judgements.
The results obtained by UMTRI showed that a regression of a number of situational and event related features observed and measured in the traffic scenario on average demand ratings predicted 87% of the variance in the ratings. Generally it was found that maxima and minima of different values were better predictors of demand than the mean of the same values. For example, the acceleration of the lead vehicle influenced the demand ratings, especially when the minimum acceleration of the lead vehicle in a certain scene was considered. Lower values in minimum lead vehicle acceleration led to lower demand ratings. For braking, higher demand ratings were found for stronger lead vehicle braking.
Lower gaps led to higher demand ratings, especially when looking at the minimum and mean gaps within a scene. Similarly, lower time headways were strongly correlated to higher demand ratings (r < -0.70). For a full list of all variables influencing the ratings the reader is referred to the original literature (Schweitzer & Green, 2007).
A conclusion is that the road geometry and the behaviour of the surrounding road users both influence demand ratings, and that it is important not to look solely at mean values when calculating performance indicators, but to consider minima, maxima and
distribution values, too.
It was decided to choose the method for the current study to evaluate the impact of the factors under investigation on the demand ratings made by the participants. In order to get a better picture, and to put the judgements made by the participants in the present study in relation to both the UMTRI rankings and to real Swedish scenes, the partici-pants in the current study not only judged the tunnels while driving in the simulator. Additionally they rated video scenes in almost the same setting as was presented by Schweitzer and Green (2007) before driving the simulator.
Five of the presented scenes stem from the UMTRI study for a direct comparison between Swedish and American ratings. They do not contain any tunnels. Seven scenes stem from recordings on a Swedish motorway with two lanes in each direction. No tunnels were present here either, but different weather conditions occurred. Six scenes stem from the driving simulator. They were recorded in the six different tunnel types which were investigated in the study (see below). This way, the following comparisons should be possible:
Ratings of Swedish and American participants on the same scenes filmed in the USA.
Ratings of Swedish participants of American and Swedish motorways. Ratings of Swedish drivers obtained while watching video in comparison to
ratings obtained while driving the simulator.
Even though the former two are of interest for validation purposes, only the last comparison will be analysed in the present study.
2.2.2 Secondary task
Drivers often engage in secondary tasks, some studies show that this is the case at least once in up to 70% of a randomised sample of 5- or 6-second-clips (Ervin, et al., 2005a; Green, et al., 2007; Klauer, Dingus, Neale, Sudweeks, & Ramsey, 2006). Modern tunnels often offer telephone and internet connection, and radio broadcasting is possible, too. Often, modern tunnels are designed in a way to promote safety and comfort, as they are brighter and can have wider lanes and/or an emergency lane. Therefore, driving in those tunnels is not as demanding and scary as in a number of older and badly lit tunnels. Therefore it is not unlikely that drivers will become bored and counteract this by engaging in secondary tasks. In those situations the risk that important developments in the traffic scenario are missed increases. It is possible that lighting levels play a role for the conspicuity of risky events when the driver is distracted. Therefore, in the present study the drivers encounter each tunnel design twice, once while they drive normally, and once while they perform a secondary task. Instead of having the drivers perform a natural secondary task like talking on the telephone or changing a radio station, a standardised secondary task was chosen. The advantage of that is that performance on different aspects of the task can be measured easily, and that all drivers are equally unfamiliar with this task. Also, the extent of the demand on visual attention can be estimated beforehand due to results presented in the literature (Östlund et al., 2004). The disadvantage is, of course, that the ecological validity is low, but to counteract this the participant is informed in the situation description what the task is meant to represent in real life.
The artificial secondary task that was chosen is a modification of the S-IVIS task developed in the EU project HASTE. The participant is presented with a 4 x 4 square of arrows, which point either downward, sideways or upward. The participant is required to respond as fast as possible whether an arrow pointing upward exists in the current square or not. The response is given by pressing either “yes” or “no” on the touchscreen on which the task is presented. In the original HASTE task the squares could be of different sizes (from 4 x 4 to 6 x 6), and the arrows could either point in only one direction, plus possibly upwards, or in several directions. For the current study only 4 x 4 squares with arrows in all directions were used. The reason for this is that the response times found in previous studies corresponded to values which are considered as critical for glancing away from the road in one go, while still being of a realistic duration for a single glance. When no target arrow was present the mean response time for correct answers was almost 2.5 s, while it was almost 1.5 s when a target arrow was present.
It was important for reasons of comparison that the participants dealt with the secondary task in the same location. Therefore, it was an advantage that the HASTE S-IVIS task is system paced, meaning that it starts on its own and the driver has to react, which can include ignoring the task. In this sense it corresponds to an incoming phone call. The task is both visual and cognitive, like many of the secondary tasks executed in vehicles. Its difficulty level can be adjusted to suit the research question at hand, which was done here by only selecting two types of the many possible square pattern types.
2.2.3 The driver
How easy or difficult it is to manage certain traffic situations does not only depend on the infrastructure, the surrounding traffic and the vehicle, but also on the driver and his or her capabilities and characteristics. This includes the driver’s willingness and
capability in performing secondary tasks while driving, as described above, but also the driver’s experience with driving in general and with certain situations.
In the current study novice drivers and drivers with a very small annual mileage were excluded, but otherwise the drivers were meant to vary in experience levels. There was no a priori control of the driven mileage or for how long the drivers have held their licence, but this information was considered in the analysis.
2.3 Performance
indicators
In order to be able to make a differentiated judgement of the drivers’ performance in the different tunnels, a host of performance indicators (PI) was computed from the logged data. Data were logged from different sensors, namely from the driving simulator itself, from the secondary task described above, and from an eye tracker, which was installed in the simulator. Additionally, the participants’ demand ratings of the traffic scene and his or her answers to the questionnaires were logged. Therefore, both the so-called driving behaviour, that is, how the vehicle moves in relation to the road, the driver behaviour, that is, what the drivers do inside of the car, and the drivers’ attitudes and opinions could be assessed.
2.3.1 Driving behaviour
Driving behaviour is often classified into different levels, for example by Rasmussen (1983) into skill-based, rule-based and knowledge based behaviour. To summarise briefly, skill-based behaviour is often automatized and highly integrated behaviour. In driving, lane tracking and distance keeping can usually be subsumed under skill-based behaviour. Rule-based behaviour is goal-oriented, and it is performed according to stored rules, which are retrieved from memory, or which “pop up” from memory quite efforlessly in the respective situation. In driving, overtaking manoeuvres or the naviga-tion of crossroads can be classified as rule-based behaviour. Finally, knowledge-based behaviour is relied upon in unfamiliar situations, where active problem solving is needed.
In the current study skill-based and rule-based behaviour were required of the partici-pants, where the rule-based skills were demanded during the overtaking event, in which the driver had to judge whether to overtake or not. When it comes to PI, there is a difference between those PI that are based on skill-based behaviour and those that are derived from rule-based behaviour. The former can normally be acquired in most driving situations, as they have to do with how the vehicle moves laterally and longi-tudinally, both in relation to the road and in relation to other road users. The latter are often bound to a certain event. Gap acceptance behaviour can only be measured in situations, in which the driver actually has to make judgements related to gaps, either while overtaking or while crossing traffic in other directions. It has to be kept in mind that some skill-based PI can be influenced markedly by the behaviour of other road users, which is why it is necessary to be aware of others’ presence and behaviour. For the present study, the skill-level based PI were collected both during the event and in a situation in which the own vehicle was driving freely (Table 2). The PI assessing rule-based behaviour were only collected during the overtaking event, as they were directly related to this event.
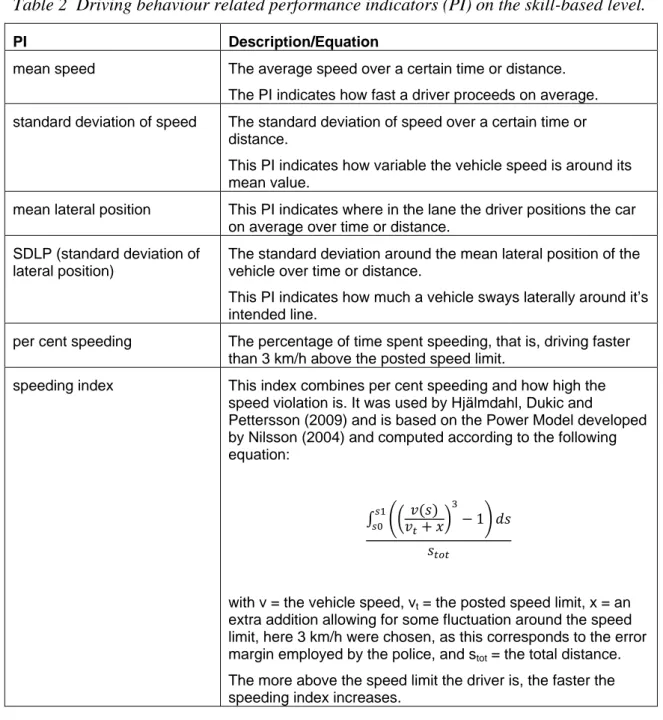
Table 2 Driving behaviour related performance indicators (PI) on the skill-based level.
PI Description/Equation
mean speed The average speed over a certain time or distance.
The PI indicates how fast a driver proceeds on average. standard deviation of speed The standard deviation of speed over a certain time or
distance.
This PI indicates how variable the vehicle speed is around its mean value.
mean lateral position This PI indicates where in the lane the driver positions the car on average over time or distance.
SDLP (standard deviation of lateral position)
The standard deviation around the mean lateral position of the vehicle over time or distance.
This PI indicates how much a vehicle sways laterally around it’s intended line.
per cent speeding The percentage of time spent speeding, that is, driving faster than 3 km/h above the posted speed limit.
speeding index This index combines per cent speeding and how high the
speed violation is. It was used by Hjälmdahl, Dukic and
Pettersson (2009) and is based on the Power Model developed by Nilsson (2004) and computed according to the following equation:
1
with v = the vehicle speed, vt = the posted speed limit, x = an
extra addition allowing for some fluctuation around the speed limit, here 3 km/h were chosen, as this corresponds to the error margin employed by the police, and stot = the total distance.
The more above the speed limit the driver is, the faster the speeding index increases.
For the rule-based level different possible scenarios were identified in relation to the overtaking manoeuvre present in the study. They pertain to the driver’s ability to judge the situation and to act in accordance with both traffic safety and efficiency. The scenarios can be identified by the usage of the turn indicators, the execution of a completed or aborted lane change manoeuvre, including not changing lanes at all, and the usage of the brakes. For each of these possible outcomes a number of PI can be computed. They include the distance of the own vehicle (X) to the lead and following vehicle while switching on the turn indicators, while changing lanes, etc., the brake reaction time, the TTC for the vehicle pairs X-B and X-C, and so on.
2.3.2 Driver behaviour
The analyses of driver behaviour were focused on gaze direction related performance indicators. Amongst other variables gaze direction and eyelid closure were logged with 60 Hz. The attention monitoring algorithm AttenD was run in real time and was used as a base for gaze direction related PI. The AttenD value indicates how visually attentive a driver currently is. It delivers a value between 0 (inattentive) and 2 (fully attentive). The value is computed based on actual gaze direction in combination with the recent glance history. For a full description of the algorithm see Kircher and Ahlstrom (2009).
From these variables the driver behaviour related PI were computed. A summary can be found in Table 3, together with short comments and the equation used, where
applicable.
Table 3 Driver behaviour related performance indicators (PI).
PI Description/Equation
Number of off-road glances > 2 s
The number of single glances away from the field relevant for driving of a duration of more than 2 s is established. Off-road glances of this duration have been shown to be linked to increased crash risk (Klauer, et al., 2006), therefore an increase of such glances indicates a risk. The glances were computed by using the output of the AttenD algorithm. percentage of glances away
from the field relevant for driving (FRD)
The percentage of glances away from the FRD is based on the AttenD algorithm. The algorithm works such that it either increases its buffer value or remains stable at the maximum value 2 when the driver looks into the FRD, whose definition depends on whether eye tracking or only head tracking is available. Roughly speaking it corresponds to the intersection of a circle of 90 degrees forward with the windscreen of the vehicle. Values above 1.8 indicate a fully attentive driver, while a buffer at zero indicates a distracted driver who has depleted his or her attention account.
per cent AttenD empty The percentage of time during which the AttenD buffer equals zero. This indicates for how long the driver was distracted during the measurement period.
per cent AttenD full The percentage of time during which the AttenD buffer was full, that is, above 1.8. This indicates for how long during the measurement period the driver was fully attentive.
Another performance indicator, which can be classified as belonging to driver
behaviour, was the time need to complete the whole trip. This variable was only used for a performance comparison between drivers.
2.3.3 Secondary task performance
For the secondary task three PI were computed (Table 4). They together are able to indicate a larger picture of the strategy chosen. Even though there obviously are
interindividual differences, it should be possible to see whether a driver rather sacrifices accuracy for being fast or the other way round.
Table 4 Secondary task performance related PI.
PI Description/Equation
reaction time The reaction time is the time from when the stimulus was first
shown on the screen until the driver released the touch screen after indicating an answer.
per cent correct of all answered
The percentage of correct answers of all answers given. per cent answered of all
stimuli
The percentage of how many stimuli were answered, of all stimuli given, regardless of whether the answer was right or wrong.
2.3.4 Subjective impressions
The UMTRI demand scale as described above was used to rate the experienced demand of a traffic situation. Additionally, the participants answered a questionnaire. Amongst other things they ranked the different tunnels according to safety and according to comfort.
2.4 Preparations
The illumination range in reality differs in several orders of magnitude from what can be rendered in a simulator. Also, in reality an external light source, like the sun or artificial light in tunnels illuminates objects in the real world, while in the simulator the scene is projected on a white screen. In order to obtain scenario that at least yields relative validity, the procedure described below was followed. The goal was to produce luminance levels on the simulator screen which are comparable to luminance levels measured in reality. The focus was on the luminance of the road surface.
The luminance level of the road surface in the simulator should correspond to high, medium and low levels as measured in real tunnels. For real tunnels the luminance of the road surface can be computed by multiplying the illuminance on the road surface with the luminance coefficient (Qd) of the road surface. In the simulator those values do not exist in a comparable manner. Here the luminance of the road surface has to be modelled by using a corresponding level on the grey scale. The following procedure was employed in order to arrive at values in the simulator setting that should be as close to reality as possible:
On the 13th of October 2010 the illuminance was measured in eight different tunnels in Stockholm. At the same occasion pictures were taken in the tunnels, and for some of the tunnels the luminance of the road surface was measured directly. The measurements were made while driving in normal traffic. The measurement vehicle was placed in the right most lane in case of multiple lanes, and speed was reduced in order to obtain a headway of at least 50 m to the vehicle ahead. This was done to minimise a possible interference of vehicle lights with the measurements. Where traffic volumes were high yellow flashlights were switched on to warn traffic approaching from behind of the reduced speed. It was ascertained that the flashlights did not disturb the measurements. The passenger in the measurement vehicle held a luxmeter (Konica Minolta T-10) out of the side window, reaching down in order to get as close to the road surface as
possible. The estimated distance of the lux meter to the road surface was 60–80 cm. The luxmeter was held at a distance of approximately 20 cm from the door of the
measure-ment vehicle, which was white. Due to the position in which the lamps were mounted under the tunnel roof it is unlikely that the car obstructed the angle of measurement. On a distance of several hundred metres the illuminance levels were read continuously, and a mean value was estimated.
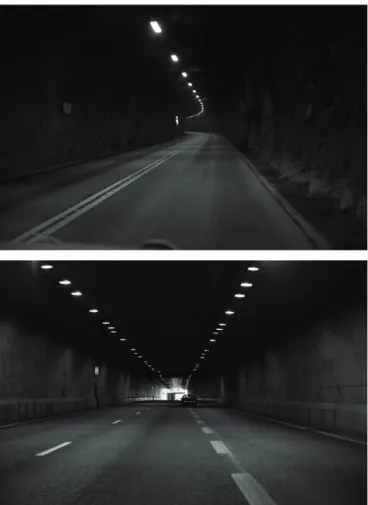
Depending on the length of the tunnel photographs of the interior of the tunnel were taken either on the same passage or on a following passage, some of which were made in the opposite direction (see Figure 4). Photographs were taken using two different procedures. At first a standard exposure was chosen, which was kept constant across all tunnels. The aperture was at f/2.8, the shutter speed was 1/100 s, and the ISO setting was at 400. Then an exposure was made where ISO and aperture remained as before, but the shutter speed was varied according to the camera’s integrated exposure meter. The metering was made with the matrix measurement setting, which considers the complete sensor surface and compares the measurement to a standard library. The camera equipment used consists of a Canon 5D Mark II body with a Canon 50 mm f/1.4 lens attached. A monopod was used for stabilisation. The photographs were taken in RAW format with the highest available resolution. Where traffic allowed the pictures were taken with the vehicle standing, otherwise they were taken in moving traffic.
Tunnel name Picture
Eugeniatunnel
Fredhällstunnel
Löttingetunnel
Törnskogstunnel
Söderleden
Clearly visible ”striping” produced by the lighting armatures.
Muskötunneln
Häggvikstunneln
Very short and straight tunnel where the exit is already visible at the entrance.
Figure 4 Photographs of eight tunnels in Stockholm, converted to black and white.
In some of the tunnels the luminance of the road surface was measured using a Minolta LS-110 luminance meter. The angle of measurement was 0.33 degrees. A comparative measurement through the windshield and with the meter held outside of the side window showed that there were no distinguishable differences between the measure-ments. Therefore, measurements were made through the windshield only. The luminance meter was directed at the road surface approximately 10 m ahead of the measurement vehicle. The registered values were read continuously over a distance of 100–200 m, and an average value was estimated.
All measured values for the eight tunnels are reported in Table 5. It is also reported in which driving direction the pictures were taken. As the measurements were made while driving, and because some of the tunnels were rather short, not all measurements could be made for all tunnels. However, for each tunnel at least one measurement of
illuminance was made in at least one direction, and pictures was taken in at least one direction for each tunnel.
Table 5 Presentation of measurement values for measurements made in tunnels in Stockholm. Illuminance was measured with a hand-held luxmeter, which was held outside the side window of the measurement vehicle approximately 60–80 cm above the road surface. The values in the table are not corrected for this.
Tunnel direction average lx value (tunnel location) road surface cd/m2 photo-graphed Fredhällstunnel N 270 S 300 x Eugeniatunnel N 1,700 (beginning) 500 (later) S 8–10 x N 1,500 (beginning) 300 (later) Häggvikstunnel E 1,000 (beginning) 500 (middle) 100 (end) 290 m (580 m single tunnel) 100 W HPS Armature Schreder 2 lanes W x E 1,000 (beginning) 300 (middle) 100 (end) W 10 Törnskogtunnel E 50–70 2.1 km (4.2 km single tunnel) 70 + 100 W HPS Armature Schreder 2 lane W x E 50–70 W 4 Löttingetunnel E 70 1.1 km 70 W HPS Armature Industria 1 lane W 50–60 x
Söderleden S 30–40 (darkest parts) 150 (middle, exit ramp)
x
Södra Länken W 50 x
4.8 km (16 km single tunnel) 2 x 2 x 36 W fluorescent lamp (ultimate longlife) Armature Industria 3 lanes
E x
Muskötunnel E 50 3 x
one lane W x
For luminance comparisons of the photographs taken in real tunnels and the tunnels that were simulated for use in the study the pictures with situation adapted exposure were used, however, they were manipulated somewhat. In order to remove colour differences
of the light, which could possibly confound the experienced brightness values the pictures were converted to black and white by transforming the colour scales to a grey scale. Certain adjustments in exposure and contrast were made in order to adapt the visual impression of the pictures to what was experienced in reality. The pictures were post-processed in Adobe Lightroom 3.2.
The pictures were then exported to jpg-format (colour space sRGB) and projected on the middle channel of the driving simulator, that is, onto the middle part of the driving scene as viewed by the driver. Here the luminance value of the road surface was measured with the help of a luminance meter.
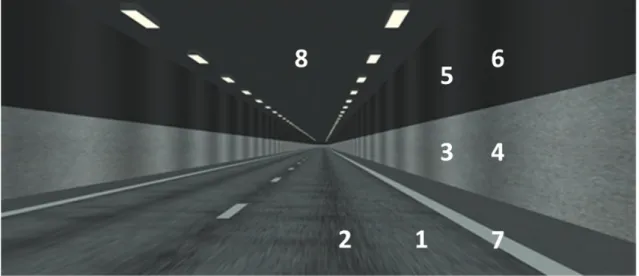
Finally, the simulated tunnels were measured in the simulator with the help of the same luminance meter, and the contrasts between different surfaces could be compared (Table 6 and Figure 6). In order to get an idea of the range in luminance that can be achieved in the simulator, the tunnels were measured at ambient light levels from 0.2 to 1.0 (step size 0.1) as adjusted via the graphics system of the simulator. For each ambient light level measurements were made in eight different spots (Figure 5).
Figure 5 A simulator tunnel with light walls. The numbers indicate where the luminance measurements were taken (cf. Table 6).
Systematic luminance measurements of different ambient light levels show that the percentage of ambient light varies in an approximately linear fashion with the measured luminance level. Only for the highest ambient light levels the measured luminance increases slightly less. The ambition was to find ambient light levels that varied markedly while still providing realistic luminance levels and an acceptable graphical rendering.
Based on the values presented in Table 6 and Figure 6 three ambient light levels were selected for the study. An ambient light level of 0.3 provided just enough contrast to enable drivers to see the environment in the tunnel. An ambient light level of 1.0 was the highest possible, and was therefore used as the brightest condition. Visual inspection in combination with the measurements led to the selection of the ambient light level of 0.6 for the middle condition.
Table 6 Luminance measurements for different features of the simulated tunnel (see Figure 5). The levels marked with green were chosen for the study.
1 2 3 4 5 6 7 8 percent ambient light road surface, light section road surface, dark section lower part of the wall, light section lower part of the wall, dark section upper part of the wall, light section upper part of the wall, dark section road marking roof 0.2 0.98 0.77 1.03 0.91 0.68 0.63 1.06 0.76 0.3 1.1 0.94 1.27 1.06 0.8 0.75 1.4 0.83 0.4 1.27 1.12 1.5 1.29 0.84 0.79 1.8 0.95 0.5 1.44 1.26 1.94 1.55 0.94 0.85 2.21 1.07 0.6 1.69 1.35 2.23 1.79 0.98 1.04 2.69 1.16 0.7 1.95 1.61 2.65 2.11 1.19 1.06 3.25 1.3 0.8 2.19 1.79 3.01 2.34 1.29 1.12 3.77 1.42 0.9 2.32 1.9 3.15 2.41 1.33 1.13 4.21 1.43 1 2.52 1.97 3.37 2.52 1.37 1.17 4.44 1.46
Figure 6 shows the measurements obtained for the simulated tunnels in a graphical fashion, the values stem from Table 6.
Figure 6 The luminance of different ambient light levels as measured on the projection screen of the simulator (see also Table 6).
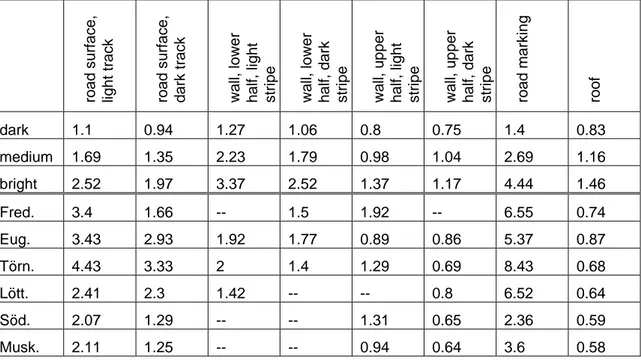
The highest value obtained for the light section of the road surface of the brightest simulated tunnel was 2.52 cd/m2. This can be contrasted with the values measured in reality. For the bright tunnels Häggvikstunnel and Eugeniatunnel values up to 10 cd/m2 were obtained. The darkest tunnel, Muskötunnel, exhibited a road surface brightness of 3 cd/m2. This implies that an absolute comparison between the real and the simulated conditions is impossible. Therefore comparisons were made between luminance levels of the simulated tunnels and the photographs of the real tunnels, which were projected on the simulator screen with the same projectors that are used for the simulated tunnels. In Table 7 the three selected ambient light conditions are compared to the luminance values measured for photographs of the real tunnels on the simulator screen. The values for the darkest condition, which lies at an ambient light level of 0.3, are comparable to what was measured for the Muskötunnel, except for the light track on the road surface and the road markings. The luminance levels for the brightest condition lie in the same order of magnitude as for the brightest tunnels as rendered on the simulator screen. A comparison to the luminance levels measured on location for the road surface in some tunnels shows, however, that it is not possible to achieve completely realistic levels with the projectors used in the simulator (compare Table 7).
Table 7 Luminance measurements made in the simulator with projections of both simulated (upper three rows) and photographed real tunnels on the middle screen. The values for the simulated tunnels with dark walls are the same as for the light walls, except that no light section exists on the lower part of the wall.
road su
rface,
light track road su
rface,
dark tra
c
k
wall, lower half, light stripe wall, lower half, dark stripe wall, upp
er
half, light stripe wall, upp
er
half, dark stripe road m
arking roof dark 1.1 0.94 1.27 1.06 0.8 0.75 1.4 0.83 medium 1.69 1.35 2.23 1.79 0.98 1.04 2.69 1.16 bright 2.52 1.97 3.37 2.52 1.37 1.17 4.44 1.46 Fred. 3.4 1.66 -- 1.5 1.92 -- 6.55 0.74 Eug. 3.43 2.93 1.92 1.77 0.89 0.86 5.37 0.87 Törn. 4.43 3.33 2 1.4 1.29 0.69 8.43 0.68 Lött. 2.41 2.3 1.42 -- -- 0.8 6.52 0.64 Söd. 2.07 1.29 -- -- 1.31 0.65 2.36 0.59 Musk. 2.11 1.25 -- -- 0.94 0.64 3.6 0.58
3 Method
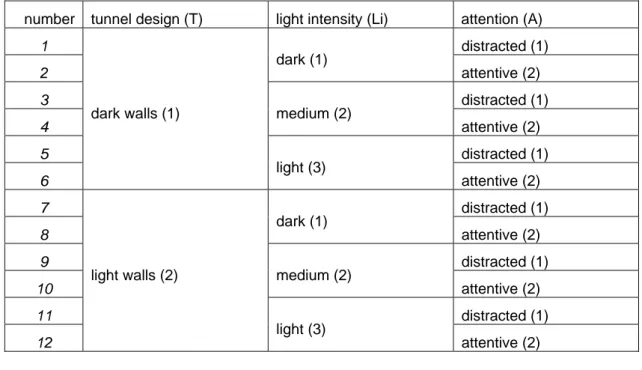
A full factorial 2x2x3 within subject design was used for the present study. Each participant drove through twelve tunnels. Each tunnel had either dark or light walls, each tunnel had one of three different levels of illumination. Each of these six tunnels was driven twice, once with a secondary task present, and once without. The tunnel numbers and the corresponding levels of the different factors can be found in Table 8.
Table 8 Tunnel numbers and corresponding factor levels.
number tunnel design (T) light intensity (Li) attention (A)
1 dark walls (1) dark (1) distracted (1) 2 attentive (2) 3 medium (2) distracted (1) 4 attentive (2) 5 light (3) distracted (1) 6 attentive (2) 7 light walls (2) dark (1) distracted (1) 8 attentive (2) 9 medium (2) distracted (1) 10 attentive (2) 11 light (3) distracted (1) 12 attentive (2)
3.1 Apparatus
In this section the apparatus including the experimental factors are described in detail.
3.1.1 Driving simulator
The experiment was conducted in the VTI Driving Simulator III, an advanced moving base simulator. A Saab 9-3 cabin was mounted on the motion platform. The moving base is used to generate forces felt by the driver while driving. It can be divided into 3 separate parts: a large linear motion, tilt motion and a vibration table. The linear drive has world leading performance, it can achieve the highest acceleration of all simulators in the world. Linear motion was used in the lateral direction in the present study. The tilt motion is used in the roll and pitch direction to simulate long term accelerations such as driving in a curve or longitudinal acceleration and deceleration. The vibration table provides additional capabilities to generate road roughness for higher frequencies. While the tilt motion tilts both the cabin and the graphics projection screen, the vibration table moves the cabin relative to the projection screen.
The visual system consists of 3 DLP projectors providing a 120 degrees forward field of view and 3 LCD displays for the rear view mirrors. The projectors have a resolution of 1280x1024 pixels.
The sound system consists of five speakers, two speakers close to the windshield in the dashboard, one speaker in each of the front doors, and one rear speaker. These speakers
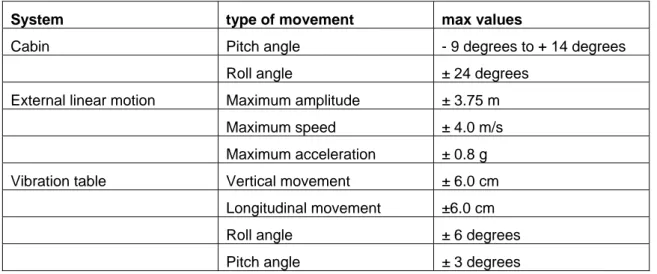
are controlled by a separate computer which can play sound in any of the five speakers. This computer dedicated to the control of the sound interacts with its environment through the network. Detailed performance specifications are provided in Table 9.
Table 9 Performance specifications of the VTI Simulator III.
System type of movement max values
Cabin Pitch angle - 9 degrees to + 14 degrees
Roll angle ± 24 degrees
External linear motion Maximum amplitude ± 3.75 m
Maximum speed ± 4.0 m/s
Maximum acceleration ± 0.8 g
Vibration table Vertical movement ± 6.0 cm
Longitudinal movement ±6.0 cm
Roll angle ± 6 degrees
Pitch angle ± 3 degrees
3.1.2 Road
The trial started with a training section, which consisted of a six kilometer long segment of open motorway without tunnel. After the training section the experimental run began. Here the road was made up of 2 km long sections of motorway without tunnel and 4 km long sections of motorway in a tunnel. These two sections alternated, starting and ending with an open motorway section. During the course of the experiment each subject drove along 13 open motorway sections and 12 tunnel sections as indicated in Table 10. The order of the tunnel sections was randomised with certain restrictions. The same lighting levels were only allowed to occur twice in consecutive order, the same wall colour was not allowed to occur more than three times in consecutive order, and the same secondary task condition was not allowed to occur more than three times in consecutive order.
Table 10 Route design. The order in which the tunnel segments appear was randomised considering certain preconditions. MW = motorway; Tx = tunnel design (x {1; 2});
Liy = light (intensity of illumination; y {1; 2; 3}); Az = induced attention level (z
{1; 2}). training MW 13 TxLiyAz {1-12} MV 14 TxLiyAz {1-12} MW 15 TxLiyAz {1-12} MW 16 TxLiyAz {1-12} 6 km 2 km 4 km 2 km 4 km 2 km 4 km 2 km 4 km
The road had two lanes in each direction, and a shoulder on the outer side. Outside of the tunnels there was a narrow green median between the two directions, but no physical barrier. Each driving direction had its own tunnel. The road was 10 m wide altogether, the lane width was 3.5 m, and the shoulders were 1.5 m wide each.
The open motorway was completely straight, while the first 400 m of the tunnel section consisted of a left curve with radius 2000 m, and the last 400 m of the tunnel section consisted of a right curve with the same radius (Figure 7).
Figure 7 The end of one open motorway segment, with a tunnel coming up.
3.1.3 Tunnel design
Tunnel design was varied on two levels. The walls of a tunnel could either be dark or light. In case of light walls, the light part went from road surface level up to 2 meters above road surface level. In all cases the walls were rendered with a slight pattern, simulating the reflections of the lamps mounted under the tunnel roof (Figure 8).
3.1.4 Light intensity
The factor “light intensity” was varied on three levels. They corresponded to the full ambient light level, the ambient light level x 0.6 and the ambient light level x 0.3 (Figure 8). The procedure for how these lighting levels were decided upon is described in more detail in Section 2.4 on page 22.
dark walls (T1) light walls (T2)
bright illumination (Li
3 ) medium illumination (Li 2 )
dark illumination (Li
1
)
Figure 8 The factor ”tunnel design” was varied on two levels (columns), the factor “light intensity” was varied on three levels (rows). Each of the tunnels was driven twice, once under secondary task load and once without secondary task.
In the simulated tunnels the manipulation of the ambient light level entailed that everything visible in the image turned correspondingly darker. This includes simulated light sources, like the head and rear lights of other vehicles and the lamps mounted under the tunnel roof. In reality it is likely that the light walls would reflect some light onto the road surface, making it brighter than in the same light intensity condition, but with dark walls. These interactions were not entered into the simulation in order to keep the retroreflection of the road surface constant within each light intensity factor level. In order to simulate the transitional phase in the tunnel entry and exit where natural light and tunnel illumination mix, the ambient light level was reduced in a linear fashion starting at the tunnel entrance and reaching its final level 180 m into the tunnel. The light was increased again in a similar fashion, starting 180 m before the tunnel ended and ending with the tunnel exit.
![Table 1 Requirement on road surface luminance [cd/m2] in the interior zone of the tunnel](https://thumb-eu.123doks.com/thumbv2/5dokorg/4840704.130943/14.892.120.772.254.393/table-requirement-road-surface-luminance-interior-zone-tunnel.webp)