https://doi.org/10.7874/jao.2017.00318
Introduction
Hearing aids are the most frequently used option for ad-dressing hearing loss. For many people with hearing loss, the use of hearing aids has resulted in a noticeable improvement of communication and quality of life [1]. However, despite the potential benefits of the use of hearing aids regarding
hearing loss, it is estimated that only 20-25% of adults who could benefit from an appropriate version of a hearing aid use one [2]. This low uptake has been attributed to a number of reasons, including low perceived hearing disability, limited perceived benefit, and cost [3]. Pioneering research on tech-nology from the perspective of the humanities and the social sciences carried out through the interdisciplinary field of study known as science and technology studies (or science, technol-ogy, society) has further shown that hearing loss, just like every other disability, may be better addressed by adjusting technology to the needs and preferences of their users. The
Examination of Previously Published Data to Identify Patterns
in the Social Representation of ‘Hearing Aids’ Across Countries
Vinaya Manchaiah
1,2,3, Pierre Ratinaud
4, Aristotle Tympas
5, Berth Danermark
6, and Per Germundsson
7 1Department of Speech and Hearing Sciences, Lamar University, Beaumont, TX, USA2Audiology India, Mysore, India
3Department of Speech and Hearing, School of Allied Health Sciences, Manipal University, Manipal, India 4LERASS Laboratory, University of Toulouse, Toulouse, France
5Department of Philosophy and History of Science, National and Kapodistrian University of Athens, Athens, Greece 6The Swedish Institute for Disability Research, Örebro University, Örebro, Sweden
7The Department of Health and Welfare Studies, Malmö University, Malmö, Sweden
Received November 25, 2017 Revised January 4, 2018 Accepted January 10, 2018
Address for correspondence
Vinaya Manchaiah, AuD, MBA, PhD Department of Speech and Hearing Sciences, Lamar University, Beaumont, TX 77710, USA
Tel +1-409-880-8927 Fax +1-409-880-2265
E-mail vinaya.manchaiah@lamar.
edu
Background and Objectives: Societal factors seem to exercise a strong influence on
hear-ing aid uptake, use, and satisfaction. In particular, knowledge, perception, and attitude of people will have bearing towards their and others health behavior and decisions. The current study aimed at understanding the perception of hearing aids by adults belonging to the gen-eral population in different countries. Subjects and Methods: The study employed a cross-sectional design. A sample of 404 adults from India, Iran, Portugal, and the United Kingdom were recruited by relying on a convenience sampling. Previously published data was re-ana-lyzed but it was applied for different approach. Free association task was used to collect the data. They were asked to provide up to five words or phrases that come to mind when think-ing about “hearthink-ing aids.” The data was initially analyzed based on qualitative content analysis. This was followed by quantitative cluster analysis and chi square analysis. Results: The con-tent analysis suggested 39 main categories of responses related to hearing aids. The cluster analysis resulted in five main clusters, namely: 1) positive attitude, 2) external factors, 3) hear-ing aid use and satisfaction, 4) etiology, and 5) benefits and limitations of technology. A few demographic factors (i.e., education, occupation type, country) showed association with dif-ferent clusters, although country of origin seemed to be associated with most clusters.
Con-clusions: The study provides us with unique insights into the perception of hearing aids by
the general public, and additionally, the way demographic variables may influence these
per-ceptions. J Audiol Otol 2018;22(2):96-104
KEY WORDS:0 Hearing aids · Hearing loss · Attitudes · Social representation · Social context · Societal factors.
This is an Open Access article distributed under the terms of the Cre-ative Commons Attribution Non-Commercial License (http://creCre-ative- (http://creative-commons.org/licenses/by-nc/4.0/) which permits unrestricted non-com-mercial use, distribution, and reproduction in any medium, provided the original work is properly cited.
realization of the potential of hearing aids and all kinds of technologies that are described as “assistive” should not be sought in some inherently superior technical design, but in embedding the design of technologies tailored to the perspec-tives of their users [4]. Taking users into account while pursu-ing the wider use of hearpursu-ing aids points to a presspursu-ing need for research on the perception of hearing aids by users. The study presented here was undertaken as a response to this pressing research need in understanding the interaction between “soci-ety (i.e., perception of general public)” and “technology (i.e., hearing aid).”
Social context and hearing aids
Investigations on hearing aid adoption, use, and satisfac-tion have so far focused on individual factors associated with hearing aid use [3]. As a result, there is not enough knowl-edge on the influence of societal factors (e.g., perceptions and attitudes of general public about hearing loss or hearing aids) associated with hearing rehabilitation, particularly hear-ing aids. However, a few recent studies have suggested links among social context and hearing aid adoption and satisfac-tion from hearing aid use [5,6]. A recent study by Hickson, et al. [7] identified factors that differentiate successful from un-successful users of hearing aids. Its authors found that avail-ability of social support was the factor that played the biggest role in differentiating between successful and unsuccessful use of hearing aids. In the study by Singh, et al. [5], availabil-ity of social support best predicted hearing aid satisfaction when compared to other factors such as hearing aid style, re-ported benefit from hearing aid use, and personality. A num-ber of studies have looked into the effect of significant others’ support and understanding towards hearing aid rehabilitation outcome [8,9]. The literature generally supports the idea that significant others significantly contribute to help seeking, hearing aid uptake, hearing aid use and its satisfaction [10,11]. While social support is reported to be the most important pre-dictor of psychological adjustment in people with hearing loss [12], it is surprising that the literature in this area is lim-ited. Considering the importance of social support in realiz-ing the potential of hearrealiz-ing aids, it would be very useful to know if people actually perceive it as important.
Social representation of hearing loss and hearing aids The focus on perceptions is an integral part of the social representation theory (SRT), which refers to the stock of val-ues, ideas, metaphors, beliefs, and practices that are shared among members of groups and communities [13]. The theory finds its place in social psychology and deals with our beliefs about the world, or our everyday knowledge, which involves
built-in social interaction with others. Social representations can be perceived as a set of “cognitive elements” relative to a social object. This set is collectively produced through com-munication, and is socially useful in allowing individuals to understand and interpret their social environment [14]. Ac-cording to SRT, a social group develops a comprehensible understanding of different aspects of reality, which leads to individuals perceiving the surrounding world in a group-char-acteristic way. Representations make the unfamiliar familiar by placing objects and events in a familiar context and guide meaningful interaction [15].
Studies have shown that there is a weak association be-tween attitudes and actual behavior, and an individual’s atti-tude alone cannot explain his or her behavior [16]. Within SRT, the attitudes are understood as part of a representation, focusing on individual cognition rather than social knowledge [17]. Hence, the proponents of this theory believe that social representations are more fundamental, which influences atti-tude. A focus on common knowledge and its role as a guide for our behavior makes SRT well suited to study how the public in different countries perceives hearing aids and the implications of these representations.
In a recent interdisciplinary and international multi-center research project, we explored the social representations about ‘hearing loss’ and ‘hearing aids’ in different countries [18,19]. Experts from audiology and social science worked together. Data was gathered from adults from four countries (India Iran, Portugal, and the United Kingdom). The result shows that for hearing loss, the most important aspects reported by persons with no hearing loss were: assessment and manage-ment; causes of hearing loss; communication difficulties; dis-ability; hearing ability or disdis-ability; hearing instruments; nega-tive mental state; the attitudes of others; and sound and acoustics of the environment. For hearing aids, the significant aspects were: disability and aging; appearance and design; cost; hearing instruments; and improved hearing and com-munication. Preliminary examination of the data across countries suggested some cross-cultural differences in the re-spondents’ social representations of hearing loss and hearing aids. Furthermore, it was expected that this knowledge could lead to more effective strategies and solutions that would further develop public health strategies that would lead to improving help-seeking, use of technical aids, being satisfied with the rehabilitation, and ultimately improving the quality of life of people with hearing disabilities.
In our previous publications we have presented detailed analysis of each country's results regarding social representa-tion of ‘hearing loss’ and ‘hearing aids’ [18,19]. While the previously published reports give insights about what were
the common perceptions in general public about ‘hearing loss’ and ‘hearing aids’ across different countries, they failed to address if the perceptions of participants would vary based on their demographic characteristics. In other words, there is a lack of understanding about any variation in perceptions among participants and also if there are any groups of partic-ipants with common types of perceptions about ‘hearing loss’ and ‘hearing aids.’ Hence, using the same data set of the so-cial representation of hearing aids study [18], we wanted to explore: 1) patterns in the perception of hearing aids reported by adults in the general population in different countries; and 2) demographic variables that may be related to the patterns involved in the perception of hearing aids.
Subjects and Methods
Study design and participants
The study involved a cross-sectional survey design. Ethi-cal approval was obtained for each country from loEthi-cal Insti-tutional Ethical Boards prior to data collection (the ethical committee approval included: India 24.07.2013; Iran 14/60; Portugal 4433/2013; and the United Kingdom FST/FREP/ 12/325). The four countries were selected to represent the East-ern (i.e., India and Iran) and WestEast-ern (i.e., Portugal and United Kingdom) cultures. The selection of countries was based on ease of data collection as the primary researcher (V.M) had collaborators in those countries. Participants were given de-tailed study information prior to data collection. Completing and returning the questionnaire was considered as providing consent.
The study sample included 404 adults (18 years or older) from the general population of four countries. Table 1 pro-vides the demographic characteristics of participants.
Data collection
The data were collected using a questionnaire using a free association task. This method has been used access the se-mantic content of social representation [20-22]. In this task the participants are required to report up to five words or phrases that immediately come to mind while thinking about hearing aids. In the next step, they were then asked to indicate whether each word or phrase they had reported had positive, neutral, or negative connotations. In addition, some demo-graphic information (i.e., age, gender, education, profession, and family history of hearing loss) was also recorded.
The original version of the questionnaire was in English and used in the United Kingdom. The questionnaires were translated into Kannada, Farsi, and Portuguese languages, to be used in India, Iran, and Portugal respectively using a well-accepted method of forward and back-translation [23]. How-ever, after the data collection the responses from participants were translated back into English, shared with the primary researcher (V.M) who were conducting the analysis. The pri-mary researcher consulted the researcher in each country with specific knowledge about the local language when needed clarification about specific responses.
Data analysis
The data were analyzed using various qualitative and quantitative analyses. For the purpose of this manuscript, data from all the four countries were analyzed together treat-ing it as one data set. However, analysis of individual coun-try data, which presents some similarities and differences in responses across countries, has been presented in our recent publication [18].
In the first instance, the responses from the free associa-tion task were analyzed using the qualitative content analysis [24]. This was followed by cluster analysis made with the Reinert’s method used for textual data analysis [25-27]. This
Table 1. Demographic details of participants
All countries (n=404) India (n=101) Iran (n=100) Portugal (n=103) United Kingdom (n=100) Age in years (Mean±SD) 41.14±16.8 42.82±14.6 41.47±14.8 38.70±19.6 41.62±17.5
Gender (% male) 50.2 46.6 51 49.5 54 Education (%) Compulsory Secondary Tertiary 17.4 24.4 58.2 24.8 7.9 67.3 7 11 82 29.1 44.7 26.2 8 33 59 Profession (%) Non-manual Manual No occupation 46.3 16.6 37.1 49.5 16.8 33.7 53 27 20 19.4 13.6 67.0 64 9 27 Family history of hearing loss (% yes) 40.1 29.7 31 49.5 50 SD: standard deviation
method is a hierarchical divisive clustering based on a series of bi-partition. Each partition is made with a correspondent analysis. This cluster analysis groups the respondents based on similarities in their responses. Each of the built clusters aim to be homogeneous (regrouping individuals with a com-mon pattern of answers). Also clusters have to be as hetero-geneous as possible between them (i.e., the pattern of answers between groups should be as different as possible). Finally,
chi square analysis is done to look at which of the primary (i.e., main categories identified from content analysis) and secondary (i.e., demographic details) variables had signifi-cant association with each of the clusters. The computation of the chi square analysis follows the same logic as in the lexical analysis: one evaluates the over- or under-representa-tion of categories in the clusters versus the rest of the sample. The presence of a category in the profile of a cluster thus
in-Table 2. Percentage of categories reported in different countries [18] and the percentage of respondents mentioning each category
Categories % of responses % of respondents mentioning this category
Acceptance of hearing loss 0.3 1.5
Activity limitations 0.76 3.7
Ageing 4.74 22.5
Alternative modes of communication 0.25 1.3
Appearance and design 9.73 39.6
Assessment and management 7.11 27.5
Assistive listening device 1 4.95
Attitude of the individual 1.7 8.4
Beneficial 3.23 14.4
Body structure 2.07 9.2
Causes of hearing loss 1 4.2
Communication difficulties 0.71 3.2
Coping strategies 0.15 0.8
Cost 6.51 30.9
Dependency 0.71 3.0
Disability 6.2 26
Disturbance and dissatisfaction 2.57 11.6
Ease or difficulty in using 5.7 23.5
Education, employment, and career issues 0.2 1.0
Empowerment and compensation 2.57 11.9
Enhancing sound 1.21 6.0
Friends and family members 0.81 3.7
Hearing instruments 11.45 39.6
Improved hearing and communication 8.22 32.9
Improved life condition 4.44 16.4
Isolation 0.15 0.8
Need for support 1.41 6.7
Negative mental state 2 9.4
Not well understood 1.82 7.7
Other listening devices 0.66 3.0
Attitudes of others 2.57 12.4
Positive mental state 1.21 5.0
Prosthesis 0.5 2.3
Satisfaction 0.61 2.7
Sound and acoustics of the environment 1.92 8.9
Stress and exhaustion 0.15 0.8
Symptoms of hearing loss 0.30 1.0
Technology 2.12 10.2
Voice and speech functions 1.06 5.2
dicates a proportion of individuals carrying this category in the cluster significantly higher than the proportion found in the rest of the sample. Iramuteq software (http://www.ira-muteq.org/) was used to perform both cluster analysis and chi square analysis [28, 29]. Iramuteq is an open-source text pat-tern analysis software that is based on R. It is important to note that the clusters were created using the cluster analysis, whereas the chi square analysis was performed to understand what categories were most common in each cluster and also participants with what demographic factors were likely to be in each cluster.
Results
The content analysis resulted in 39 categories, which has been reported in detail elsewhere [18]. Table 2 presents the main categories of responses. Table 2 also includes details about the percentage of responses for each category and the percentage of respondents mentioning each category at least one time.
The cluster analysis was performed using the Iramuteq software, which included all the 404 respondents (i.e., 100% -no outliers were found), and resulted in five clusters (Fig. 1).
A total of 67 of the 404 respondents (i.e., 16.6%) belonged to cluster 1, which was characterized by a central social di-mension of the outcome of using hearing aids, hence the cluster is labeled as social aspects (Table 3). The cluster in-cludes both positive and negative aspects of the hearing aids.
The categories more likely to be responded to by respon-dents from this cluster include: improved life condition, em-powerment and compensation, improved hearing and com-munication, positive mental state, isolation, benefits, and reduced ability. Chi-square analysis suggested that partici-pants from Portugal (χ2=27.18; p=0.0008) are significantly more likely to be in this cluster.
Cluster 2 had a total of 62 of 404 respondents (i.e., 15.3%), which was characterized mainly by more factors that may influence hearing aid uptake and use; hence, it was termed as external factors (Table 4). The categories more likely to be responded to by respondents from this cluster include: atti-tude of the individual, not well understood, benefits, appear-ance and design, cost, communication difficulties, and need for support. The participants from India (χ2=4.28; p=0.03826),
Table 3. Social aspects (cluster 1)
No Variables Frequency
in the cluster Total frequency
% of variable
within this cluster chi-square p-value 1 Improved life condition 47 66 71.21 170.18 ≤0.0001 2 Empowerment and compensation 28 48 58.33 68.63 ≤0.0001 3 Improved hearing and communication 41 133 30.83 29.07 ≤0.0001
4 Positive mental state 12 30 40.00 12.84 0.00033
5 Isolation 22 73 30.14 11.83 0.00058
6 Benefits 17 58 29.31 7.93 0.00486
7 Reduced ability 9 30 30.00 4.22 0.04003
Table 4. External factors (cluster 2)
No Variables Frequency
in the cluster Total frequency
% of variable
within this cluster chi-square p-value 1 Attitude of the individual 29 49 58.18 82.49 ≤0.0001
2 Not well understood 22 49 44.90 37.48 ≤0.0001
3 Benefits 22 58 37.93 26.59 ≤0.0001
4 Appearance and design 40 160 25.00 19.00 ≤0.0001
5 Cost 31 125 24.80 12.45 0.00041
6 Communication difficulties 34 143 23.78 12.11 0.00050
7 Need for support 16 55 29.09 9.26 0.00234
Benifits and limitations of technology (14.8%)
Etiology (22.5%)
Hearing aid use and satisfaction (30.7%) External factors (15.3%) Cluster 5 Cluster 4 Cluster 3 Cluster 2
Cluster 1 Social aspects (16.6%)
and also those with compulsory education (χ2=13.99; p= 0.00018), are significantly more likely to be in this cluster.
Cluster 3 is the biggest of all, and included 124 of the 404 of the respondents (i.e., 30.69%). This cluster was character-ized mainly by factors related to hearing aid use and satisfac-tion and hence was termed as hearing aid use and satisfacsatisfac-tion (Table 5). The categories more likely to be responded to by respondents from this cluster include: ease or difficulty in using, appearance and design, assessment and management, disturbance and dissatisfaction, cost, hearing ability or dis-ability, hearing instruments, and improved hearing and com-munication. The participants from India (χ2=48.65; p≤0.0001),
and also from United Kingdom (χ2=4.31; p=0.03786) are significantly more likely to be in this cluster.
A total of 91 of the 404 respondents (i.e., 22.52%) be-longed to cluster 4, which was characterized mainly by more causes of hearing loss and hence termed as etiology (Table 6). The categories more likely to be responded to by respon-dents from this cluster include: ageing, disability, body struc-ture, voice and speech functions, other listening devices, sound and acoustics of the environment, and causes of hear-ing loss. The participants from Iran (χ2=49.42; p≤0.0001), those with secondary education (χ2=4.85; p=0.02765), and those with manual profession (χ2=4.89; p=0.02695) are
sig-Table 5. Hearing aid use and satisfaction (cluster 3)
No Variables Frequency
in the cluster Total frequency
% of variable
within this cluster chi-square p-value 1 Ease or difficulty in using 64 95 67.37 78.54 ≤0.0001
2 Appearance and design 75 160 46.88 32.61 ≤0.0001
3 Assessment and management 70 159 44.03 21.91 ≤0.0001 4 Disturbance and dissatisfaction 26 47 55.32 15.16 ≤0.0001
5 Cost 53 125 42.40 11.66 0.00063
6 Hearing ability or disability 35 81 43.21 7.46 0.00630
7 Hearing instruments 84 234 35.90 7.08 0.00779
8 Improved hearing and communication 51 133 38.35 5.46 0.01947
Table 6. Etiology (cluster 4)
No Variables Frequency
in the cluster Total frequency
% of variable
within this cluster chi-square p-value
1 Ageing 70 124 56.45 118.01 ≤0.0001
2 Disability 77 208 37.02 51.61 ≤0.0001
3 Body structure 32 74 43.24 22.28 ≤0.0001
4 Voice and speech functions 27 62 43.55 18.55 ≤0.0001 5 Other listening devices 8 12 66.67 13.81 0.00020 6 Sound and acoustics of the environment 27 78 34.62 8.10 0.00443 7 Causes of hearing loss 35 121 28.93 4.06 0.04402
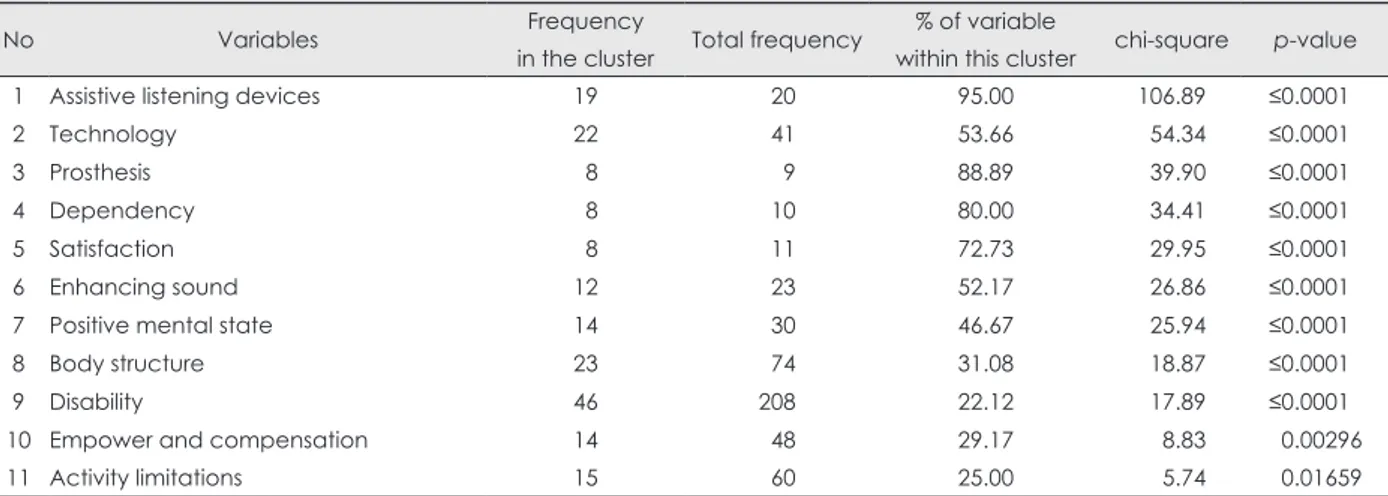
Table 7. Benefits and limitations of technology (cluster 5)
No Variables Frequency
in the cluster Total frequency
% of variable
within this cluster chi-square p-value 1 Assistive listening devices 19 20 95.00 106.89 ≤0.0001
2 Technology 22 41 53.66 54.34 ≤0.0001
3 Prosthesis 8 9 88.89 39.90 ≤0.0001
4 Dependency 8 10 80.00 34.41 ≤0.0001
5 Satisfaction 8 11 72.73 29.95 ≤0.0001
6 Enhancing sound 12 23 52.17 26.86 ≤0.0001
7 Positive mental state 14 30 46.67 25.94 ≤0.0001
8 Body structure 23 74 31.08 18.87 ≤0.0001
9 Disability 46 208 22.12 17.89 ≤0.0001
10 Empower and compensation 14 48 29.17 8.83 0.00296
nificantly more likely to be in this cluster.
Cluster 5 is the smallest of all and included 60 of the 404 of the respondents (i.e., 14.85%). This cluster was character-ized by discussing the advantages and limitations of hearing aids and is hence termed as benefits and limitations of tech-nology (Table 7). The categories more likely to be responded to by respondents from this cluster include: assistive listen-ing devices, technology, prosthesis, dependency, satisfaction, enhancing sound, positive mental state, body structure, dis-ability, empower and compensation, and activity limitations. The participants from Iran (χ2=83.27; p≤0.0001), and those with secondary education (χ2=5.75; p=0.01651), are signifi-cantly more likely to be in this cluster.
Discussion
The current interdisciplinary and international study ex-plored patterns in the social representation of hearing aids reported by adults in the general population. The qualitative content analysis of responses to free association task resulted in 39 categories (Table 2). These results were further anal-ysed using the cluster analysis, which resulted in five clusters (Fig. 1). However, the five clusters fell into two cluster groups. The first cluster group included three clusters: positive atti-tude, external factors, and hearing aid use and satisfaction. The second cluster group included the remaining two clus-ters: etiology and benefits and limitations of technology.
The first cluster group of people describe themselves as using these devices, what they do, and the consequences of these uses. In this cluster group, there is over representation of people from India (clusters 2 and 3), Portugal (cluster 1) and the United Kingdom (cluster 3). The cluster indicates that it is mainly positive aspects of using hearing aids that came into the respondents’ minds. This indicates that there is a universal understanding of hearing aids as an important beneficial technological device for persons with hearing loss. We do not know from our study if this involves mainly a pos-itive view of hearing aids as an outcome of respondents’ ex-periences from persons with hearing loss, or as an outcome of e.g., advertisements from hearing aid companies. In such ad-vertisements, the benefits of using hearing aids are highlight-ed, and this might result in an expectation that hearing aids are the solution for persons with hearing loss. However, re-search shows that hearing aids are one part of hearing loss rehabilitation [30]. Another aspect of the mainly positive character of the cluster is that to some extent it contradicts the outcome of many studies that report how people using hearing aids are stigmatized due to the use of these devices [31,32].
The content in the second cluster group focuses on the
rea-son to use such devices and what they are (i.e., definition). In this cluster group there is over representation of people from Iran (clusters 4 and 5). From these observations, we can hy-pothesize that there is less “proximity” to the object in Iran than in the three other samples. When thinking of “hearing aids,” respondents relate to hearing loss (and “causes of hear-ing loss”) as shown in this cluster. Here we also find the cate-gory “Disability”-probably often caused by “Ageing.” This is especially prominent in Iran. These observations suggest that people from cluster four do not have representation regard-ing the object of study (i.e., hearregard-ing aids), and they would rather focus on other aspects, suggesting that this group may be distinct when compared to other groups of people. In clus-ter 5, although some positive aspects occur here, the main fo-cus is on disability, limitations, and also on dependency.
The demographic factors seem to have some influence on patterns of responses. Education is related to clusters 2, 4 and 5, whereas the factor occupation type is related to cluster 4. However, it is interesting to note that country of origin is sig-nificantly related to all the five clusters with people from a particular country, which is likely to be over represented in each cluster. These findings suggest cross-cultural differences in the perception of people towards hearing aids. These find-ings also strengthen the need for cross-cultural research in hearing healthcare [33].
Implications of the study
Several societal factors (e.g., societal attitudes, social norms, practices, and ideologies) are reported to influence the help-seeking and rehabilitation uptake (e.g., hearing aids) in people with hearing loss [34,35]. However, in the current century globalization has resulted in a multi-cultural society. Hence, understanding how the societal factors influence the attitudes and behaviors of people with disabilities is crucial in providing more directed and tailored rehabilitation for in-dividuals. The study may shed some light on the perception of people from different socio-cultural backgrounds regard-ing hearregard-ing aids, which may possibly influence the behavior of people with hearing loss towards rehabilitation uptake and use. Therefore, clinicians must be aware of such cultural fac-tors while counseling and developing rehabilitation plans for individuals with hearing loss. Moreover, it is important to choose the culturally and linguistically appropriate messages and materials while developing health promotion materials [36]. We believe that the current study results may be useful while developing public health campaigns about hearing aids, and also in the promotion of hearing instruments within retail settings, particularly in prioritizing what messages may be appropriate for different groups of individuals in terms of
hearing aids.
Strengths and limitations of the study
The main strength of the current study is the interdisciplin-ary approach and the cross-cultural data collection. However, the study has some limitations. First, the study used conve-nience-sampling method, which may have resulted in a sam-pling bias. Second, the data were gathered in local languages and translation was previously done. This may have intro-duced some bias due to various translation elements. Third, the responses in the free association task were words and/or phrases, some of which on their own may have provided a limited context for researchers while conducting a qualitative content analysis. However, this was addressed to some de-gree as the main researcher communicated with researchers from each country in order to check and ensure that the con-tent analysis remained appropriate.
Acknowledgments
The current manuscript presents re-examination of the data that was originally published (references 18 and 19 in this manuscript) in the Clinical Interventions in Aging journal in 2015.
Conflicts of interest
The authors have no financial conflicts of interest.
REFERENCES
1) Niemensivu R, Manchaiah V, Roine RP, Kentala E, Sintonen H. Health-related quality of life in adults with hearing impairment be-fore and after hearing-aid rehabilitation in Finland. Int J Audiol 2015;54:967-75.
2) Meister H, Walger M, Brehmer D, von Wedel UC, von Wedel H. The relationship between pre-fitting expectations and willingness to use hearing aids. Int J Audiol 2008;47:153-9.
3) Knudsen LV, Oberg M, Nielsen C, Naylor G, Kramer SE. Factors in-fluencing help seeking, hearing aid uptake, hearing aid use and satis-faction with hearing aids: a review of the literature. Trends Amplif 2010;14:127-54.
4) Blume S. What can the study of science and technology tell us about disability? In: Watson N, Roulstone A, Thomas C, ediors. Routledge handbook of disability studies. London: Routledge;2012. p.348-59. 5) Singh G, Lau ST, Pichora-Fuller MK. Social support predicts
hear-ing aid satisfaction. Ear Hear 2015;36:664-76.
6) Singh G, Launer S. Social context and hearing aid adoption. Trends Hear 2016;20:2331216516673833.
7) Hickson L, Meyer C, Lovelock K, Lampert M, Khan A. Factors as-sociated with success with hearing aids in older adults. Int J Audiol 2014;53 Suppl 1:S18-27.
8) Duijvestijn JA, Anteunis LJ, Hoek CJ, Van Den Brink RH, Chenault MN, Manni JJ. Help-seeking behaviour of hearing-impaired per-sons aged > or = 55 years; effect of complaints, significant others and hearing aid image. Acta Otolaryngol 2003;123:846-50. 9) Lockey K, Jennings MB, Shaw L. Exploring hearing aid use in
old-er women through narratives. Int J Audiol 2010;49:542-9. 10) Manchaiah VKC, Stephens D, Zhao F, Kramer SE. The role of
com-munication partners in the audiological enablement/rehabilitation of a person with hearing impairment: an overview. J Audiol Med 2012; 10:21-30.
11) Kamil RJ, Lin FR. The effects of hearing impairment in older adults on communication partners: a systematic review. J Am Acad Audiol 2015;26:155-82.
12) Frankel BG, Turner RJ. Psychological adjustment in chronic dis-ability: the role of social support in the case of the hearing impaired. Can J Sociol 1983;8:273-91.
13) Moscovici S. La psychanalyse, son image et son public. Paris: PUF; 1961.
14) Rateau P, Moliner P, Guimelli C, Abric JC. Social representation theory. In: Van Lange PAM, Kruglanski AW, Tory E, editors. Hand-book of theories of social psychology. Thousand Oaks, CA: SAGE Publications;2012. p.477-97.
15) Sammut G, Andreouli E, Gaskell G, Valsiner J. Social representa-tions: a revolutionary paradigm? In: Sammut G, Andreouli E, Gas-kell G, Valsiner J, Editors. The Cambridge handbook of social rep-resentations. Cambridge: Cambridge University Press;2015. p.3-11. 16) Kollmuss A, Agyeman J. Mind the gap: why do people act
environ-mentally and what are the barriers to pro-environmental behavior? Environ Educ Res 2002;8:239-60.
17) Gaskell G. Attitudes, social representations, and beyond. In: Deaux K, Philogène G, editors. Representations of the social: bridging the-oretical tradition. Oxford: Blackwell Publishers Ltd;2001. 18) Manchaiah V, Danermark B, Vinay, Ahmadi T, Tomé D, Krishna R,
et al. Social representation of hearing aids: cross-cultural study in In-dia, Iran, Portugal, and the United Kingdom. Clin Interv Aging 2015; 10:1601-15.
19) Manchaiah V, Danermark B, Ahmadi T, Tomé D, Zhao F, Li Q, et al. Social representation of “hearing loss”: cross-cultural exploratory study in India, Iran, Portugal, and the UK. Clin Interv Aging 2015; 10:1857-72.
20) Danermark B, Englund U, Germundsson P, Ratinaud P. French and Swedish teachers’ social representations of social workers. Eur J Soc Work 2014;17:491-507.
21) Linton AC, Germundsson P, Heimann M, Danermark B. Teachers’ social represenattion of students with Aspergers diagnosis. Eur J Spec Needs Edu 2013;28:392-412.
22) Abric JC. Méthodologie de recueil des representations sociales. In: Abric JC, editor. Pratiques sociales et représentations. Paris: PUF; 1994.
23) Beaton DE, Bombardier C, Guillemin F, Ferraz MB. Guidelines for the process of cross-cultural adaptation of self-report measures. Spine (Phila Pa 1976) 2000;25:3186-91.
24) Graneheim UH, Lundman B. Qualitative content analysis in nurs-ing research: concepts, procedures and measures to achieve trust-worthiness. Nurse Educ Today 2004;24:105-12.
25) Ratinaud P, Marchand P. Improbable search of a homogenous diver-sity: the debate on national identity. Lang 2012;3:93-107.
26) Reinert A. Une méthode de classification descendante hiérarchique: application à l’analyse lexicale par contexte. Les Cahiers De L’analyse Des Données. 1983;VIII:187-98.
27) Reinert M. Alceste une méthodologie d’analyse des données textu-elles et une application: Aurelia De Gerard De Nerval. Bull Sociol Methodol 1990;26:24-54.
28) R Development Core Team. The R project for statistical computing [cited 2014 July 1]. Available from: http://www.R-project.org. 29) Ratinaud P. IRaMuTeQ : Interface de R pour les Analyses
Multidi-mensionnelles de Texteset de Questionnaires (version 0.7 alpha 2) [Windows, GNU/Linux, Mac OS X], 2014. Consulté à l’adresse [cited 2018 Jan 3]. Available from: http://www.iramuteq.org/.
30) Manchaiah V, Danermark B. The experience of hearing loss: jour-ney through aural rehabilitation. Abingdon: Routledge;2017. 31) Solheim J, Kværner KJ, Sandvik L, Falkenberg ES. Factors
affect-ing older adults’ hearaffect-ing-aid use. Scand J Dis Res 2012;14:300-12. 32) Laplante-Lévesque A, Hickson L, Worrall L. What makes adults
with hearing impairment take up hearing AIDS or communication programs and achieve successful outcomes? Ear Hear 2012;33:79-93.
33) Zhao F, Manchaiah V, St Claire L, Danermark B, Jones L, Brandreth M, et al. Exploring the influence of culture on hearing help-seeking and hearing-aid uptake. Int J Audiol 2015;54:435-43.
34) Granberg S, Möller K, Skagerstrand A, Möller C, Danermark B. The ICF Core Sets for hearing loss: researcher perspective, part II: link-ing outcome measures to the International Classification of Func-tioning, Disability and Health (ICF). Int J Audiol 2014;53:77-87. 35) Granberg S, Swanepoel de W, Englund U, Möller C, Danermark B.
The ICF core sets for hearing loss project: International expert
sur-vey on functioning and disability of adults with hearing loss using the international classification of functioning, disability, and health (ICF). Int J Audiol 2014;53:497-506.
36) Bronheim S. Sockalingam S. A guide to... choosing and adapting culturally and linguistically competent health promotion materials. National Center for Cultural Competence 2003 [cited 2017 Mar 30]. Available from: https://nccc.georgetown.edu/documents/Materials_ Guide.pdf.