Biomarker Insights 2011:6 119–125
doi: 10.4137/BMI.S8326
This article is available from http://www.la-press.com.
© the author(s), publisher and licensee Libertas Academica Ltd.
This is an open access article. Unrestricted non-commercial use is permitted provided the original work is properly cited.
Open Access
Full open access to this and thousands of other papers at
http://www.la-press.com. O r I g I n A L r e S e A r c h
Detection of supAR in the saliva of Healthy Young Adults:
comparison with plasma Levels
Anna gustafsson, Vjosa Ajeti and Lennart Ljunggren
Department of Biomedical Laboratory Science, Malmö University, Malmö, Sweden. corresponding author email: anna.gustafsson@mah.se
Abstract: The soluble urokinase plasminogen activator receptor (suPAR) has been detected in blood, plasma, serum, urine, ovarian
cystic fluid, and cerebrospinal fluid. Elevated suPAR levels in plasma have been associated with negative outcomes in various diseases, such as bacteremia, sepsis, SIRS, cardiovascular disease, cancer, and tuberculosis. The primary aim of this study was to investigate whether suPAR can be detected in saliva from healthy individuals and thus, if saliva suPAR can be related to plasma suPAR, CRP, BMI, or gender. Blood and unstimulated whole saliva was collected from 20 healthy individuals (10 female and 10 male, median age of 28 years; range 21–41). CRP and suPAR were measured with ELISA in saliva and serum/plasma. suPAR was detected in all saliva samples in the 5.2–28.1 ng/mL range, with a median value of 17.1 ng/mL. Saliva suPAR was significantly higher (P , 0.001) but not correlated to plasma suPAR in healthy young adults with normal plasma suPAR levels. suPAR and CRP levels were correlated in blood but not in saliva. No correlation was found between BMI, age, or gender and suPAR in saliva.
Introduction
The urokinase-type plasminogen activator receptor (uPAR) is present on various immunologically active cells including monocytes, neutrophils, activated T lymphocytes, and macrophages, and also on endothe-lial cells, keratinocytes, fibroblasts, smooth muscle cells, megakaryocytes, and certain tumor cells.1 uPAR
consists of three homologous domains (DI, DII and DIII) and is linked to the cell surface by a glycosylphosphati-dylinositol (GPI) anchor. Domain DI carries the main binding site for the urokinase-type plasminogen acti-vator (uPA).2 The binding of uPA to its receptor uPAR
mediates a variety of cellular activities like migration, adhesion, differentiation, and proliferation.1 A soluble
bioactive form of uPAR (suPAR) is shredded or cleaved from the cell surface.1 Full-length suPAR (suPAR
I–III)
consists of all three domains but lacks the GPI anchor and can be cleaved into two soluble forms, suPARII–III and suPARI.1 The soluble receptor has similar
extra-cellular functions as uPAR3 and has been detected in
various body fluids, including blood, plasma, serum, urine, ovarian cystic fluid, and cerebrospinal fluid.1,4–6
In healthy individuals, suPAR levels are quite stable in both blood and urine, however, suPAR levels increase with age and are slightly higher in plasma from females when compared to males.7 Several studies indicate
that an elevated suPAR level in plasma is associated with a negative outcome in various diseases, including
Staphylococcus aureus bacteremia,8 systemic
inflam-matory response syndrome,9 cardiovascular disease,10
cancer,11 and tuberculosis.12 Although suPAR is a
sig-nificant marker in plasma, there is at present no study on suPAR in saliva. There is a great interest in explor-ing the utility of inflammatory biomarkers in saliva, since compared to blood drawing, saliva collection is simple and non-invasive and does not carry any of the inconveniences or risks of drawing blood. The primary aim of this study was to investigate whether suPAR can be detected in saliva from healthy individuals. Fur-thermore, if that were the case, a possible correlation to plasma suPAR, saliva C-reactive protein (CRP), gen-der, or BMI should be investigated.
Material and Methods
Sample collection
This study included a total of 20 healthy volunteers (10 female and 10 male) with a median age of
written consent and the study was conducted in accordance with the sixth revision of the Declaration of Helsinki. Participants were students recruited at Malmö University; all were nonsmokers and asked to refrain from eating 12 h prior to the sample collection. Weight and height were measured. Saliva and blood samples were collected in the morning (8–10 a.m.). After centrifugation, serum and plasma aliquots were immediately frozen at −20 °C. Unstimulated whole saliva was collected from the individuals using an oral swab (5001.02, Salimetrics, PA, USA). Participants rinsed their mouth with water and then the swab was placed under the tongue on the floor of the mouth for 1–2 minutes. After collection, the swab was centri-fuged at 1500× g for 15 minutes. Saliva aliquots were immediately frozen at −20 °C.
suPAr in plasma and saliva
Plasma (EDTA) and saliva suPAR concentrations were analyzed using a commercially available enzyme immunoassay (suPARnostic™, Virogates, Copenhagen, Denmark) according to the manufactur-er’s instructions. The assay is a double monoclonal antibody sandwich assay that measures all circulat-ing suPAR, includcirculat-ing intact and cleaved forms of the receptor. The suPARnostic™ ELISA is recommended for EDTA plasma samples and hence spike, recovery, and linearity of dilution experiments were performed with saliva samples to validate the assay. Briefly, six saliva samples (with low, medium and high suPAR levels) were diluted 1:2 and 1:4 with the manufac-turer’s dilution buffer (PBS pH 7.4 with proprietary additives) and assayed after dilution. Linearity was defined relative to the calculated amount of suPAR based on the standard curve and was assessed by comparing observed vs. expected values based on undiluted samples. Spiked samples were prepared by adding three different concentrations of a spike stock solution to six saliva samples. Recoveries for spiked saliva samples were calculated by compar-ing observed vs. expected values based on the spiked controls. The diluent for the spike stock solution was the same as the standard diluent.
crP in serum and saliva
A highly sensitive ELISA for determination of the CRP concentration in human serum was used
the manufacturer’s instructions. CRP in saliva was determined with a sandwich ELISA designed for measurement of saliva CRP (Salimetrics, PA, USA) according to the manufacturer’s instructions.
Statistical methods
All statistical analyses were performed with SPSS version 18. The linear association of variables was evaluated by using Pearson´s correlation coefficient (r). The significance was tested using the paired t-test; statistical significance was considered at P , 0.05.
Results
The results of CRP and suPAR measurements in blood and saliva are presented in Table 1.
suPAr in plasma
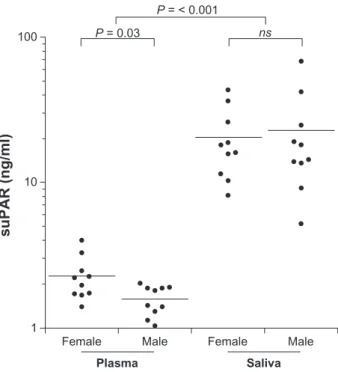
suPAR in plasma was in the 1.04–4.01 ng/mL range. As depicted in Figure 1 the results indicate signifi-cantly different suPAR levels in plasma between male and female subjects, P = 0.03. However, no correla-tion between BMI or age and suPAR in plasma was found.
suPAr in saliva
suPAR was detected in all saliva samples (Fig. 1) and was in the 5.21–18.1 ng/mL range; median value = 17.1 ng/mL. Saliva suPAR was significantly higher (P , 0.001) but not correlated to plasma suPAR in this subject group (Fig. 2). No correlation was found between BMI, age, or gender and suPAR in saliva. One of the participants had a saliva suPAR level higher than 2 SD from the mean. Excluding this value affected the relationship between the gen-ders, and then the saliva suPAR mean became higher in female (20.5 ng/mL) than male (17.8 ng/mL) subjects.
Spike, recovery, and linearity of dilution experiments were conducted with saliva samples in order to vali-date and assess the accuracy of the suPARnostic™ ELISA. Values obtained for spiked samples are pre-sented in Table 2; the recovery of added suPAR was in the 90%–93% range. Linearity of dilution experi-ments resulted in 104% ± 6% recovery at 1:2 dilu-tions and 102% ± 11% recovery at 1:4 diludilu-tions. The results indicated that the suPARnostic™ ELISA accu-rately measures suPAR in saliva. Additionally, suPAR in saliva collected with an oral swab was compared to saliva collected by passive drooling; both sampling methods yielded similar levels of suPAR.
suPAr and crP
Saliva CRP was significantly lower (P , 0.001) than plasma CRP; saliva CRP was in the range 0.09– 90.9 µg/L, with a median value of 1.31 µg/L, while plasma CRP was in the range 0.03–3.71 mg/L, with a median value of 0.59 mg/L. No correlation between CRP in plasma and saliva was found. An interesting finding was that plasma CRP was strongly correlated to BMI; r = 0.70, P , 0.001 for the entire subject group and r = 0.95, P , 0.001 for the female group only. A moderate positive correlation was found between plasma suPAR and CRP (r = 0.67, P = 0.03) in the female group. suPAR and CRP in saliva were not correlated in these subjects.
Discussion
To our knowledge, this study is the first to show that suPAR can be detected in saliva. The results show that saliva suPAR levels are significantly higher but not correlated to plasma suPAR levels. This is surprising considering that the level of most biomarkers is often significantly lower in saliva, compared to plasma/ serum. Although some molecules diffuse or are
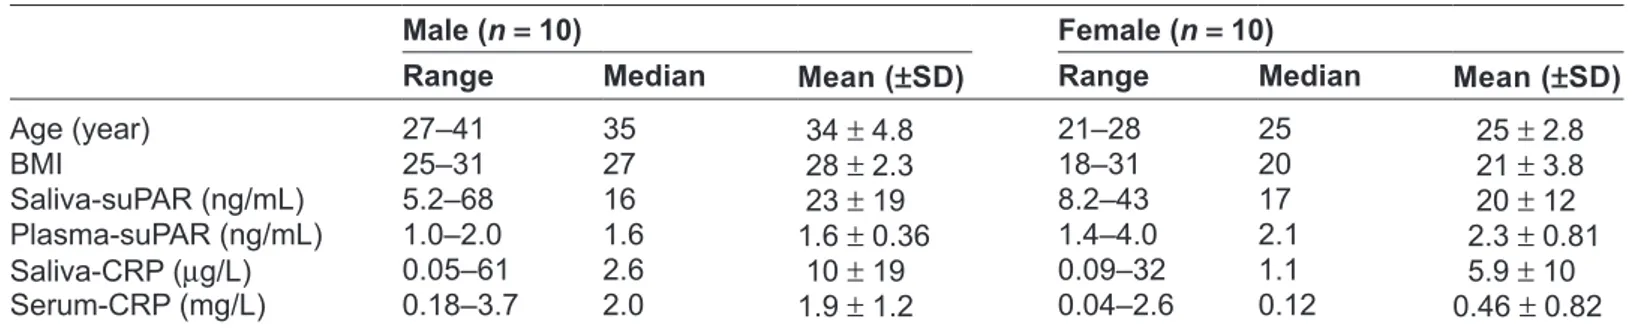
Table 1. suPAr and crP in human saliva and blood.
Male (n = 10) Female (n = 10)
Range Median Mean (±sD) Range Median Mean (±sD)
Age (year) 27–41 35 34 ± 4.8 21–28 25 25 ± 2.8 BMI 25–31 27 28 ± 2.3 18–31 20 21 ± 3.8 Saliva-suPAr (ng/mL) 5.2–68 16 23 ± 19 8.2–43 17 20 ± 12 Plasma-suPAr (ng/mL) 1.0–2.0 1.6 1.6 ± 0.36 1.4–4.0 2.1 2.3 ± 0.81 Saliva-crP (µg/L) 0.05–61 2.6 10 ± 19 0.09–32 1.1 5.9 ± 10 Serum-crP (mg/L) 0.18–3.7 2.0 1.9 ± 1.2 0.04–2.6 0.12 0.46 ± 0.82
actively transported into saliva from blood, others are synthesized by the salivary glands. The mode of entry of suPAR into saliva is not yet investigated, however, if saliva suPAR is locally synthesized, a correlation with plasma levels would not necessarily be expected. In the present study the participants had saliva suPAR concentrations that were about 12-fold higher than the corresponding plasma concentrations (Fig. 1). Such high concentrations of suPAR are not likely obtained without a high expression of uPAR in the oral cavity. Information about uPAR expression in the gingival tissue or salivary glands is limited, but its ligand, uPA, is expressed in gingival tissues.13,14 Furthermore,
Virtanen el al15 showed that uPA is expressed in the
secretory cells of the salivary glands and secreted at low levels in saliva. Considering the high levels of saliva suPAR found in the present study and the fact that full-length suPAR is able to bind uPA,16 an
expla-nation for the low saliva uPA levels might be that the suPAR-uPA complex cannot be detected by the assay used. The role of suPAR in saliva is still unknown and further investigations are needed to establish the rea-sons for the high levels of saliva suPAR. It is worth stressing that an elevated suPAR concentration in saliva may be a consequence of periodontal
inflam-study; it would be of substantial value to examine if periodontal conditions affect the saliva suPAR level.
Saliva collection is non-invasive and easy to perform compared to blood drawing, but little is known about the biomarker expression levels in saliva. Saliva volume, viscosity, content of mucins,
1 5 10 15 20 25 r = 0.41 P = 0.24 suPAR in saliva Female A suPAR in plasma 30 35 40 45 1.5 2 2.5 3 3.5 4 4.5 1 0 10 20 40 r = 0.34 P = 0.33 suPAR in saliva Male B suPAR in plasma 30 50 60 70 1.2 1.4 1.6 1.8 2 2.2
Figure 2. correlation between saliva and plasma suPAr for female (A) and male (B).
Table 2. Spike and recovery results for saliva samples
analysed with suPArnostic™ eLISA. suPAr levels are presented as mean ± SD of six different saliva samples.
spike level
ng/mL expected ng/mL Observed ng/mL Mean recovery %
1.3 13.4 ± 5.9 12.5 ± 5.5 93
4.1 15.8 ± 5.6 14.1 ± 4.9 90
7.2 18.4 ± 5.7 16.9 ± 4.9 93
1
Female Male Female Male
Plasma suPAR (ng/ml) Saliva 10 100 P = 0.03 P = < 0.001 ns
Figure 1. suPAr levels in plasma and saliva between female and male. Solid bars indicate mean values. suPAr was determined by suPArnostic™ eLISA.
abundance of particulate matter, and bacterial load vary considerably between individuals. These factors have the potential to influence the reliability and validity of the measurements of saliva biomarkers. Saliva sample collection in this study was done with an oral swab; filtering saliva through an oral swab and centrifuging prior to the assay tend to minimize some of these sources of variation. Nevertheless, the swab collection yielded results similar to the ones from passive drooling collection (result not shown). Saliva suPAR was measured with the commercially available suPARnostic™ ELISA, developed and recommended for EDTA-plasma. However, recovery studies show that saliva is a suitable medium for this assay. In addition, the same ELISA has been used to measure suPAR in urine4 and cerebrospinal fluid6
with reproducible results.
According to Eugen-Olsen et al,7 a normal plasma
suPAR range for healthy individuals 20–30 years of age, is 2.5–2.9 ng/mL for females and 1.5–2.5 ng/mL for males. Similar results have been found in this study with the exception of one female subject (age 24, BMI 31) who had a slightly high plasma suPAR value at 4.0 ng/mL, she also had a saliva suPAR level above mean (26 ng/mL). Likewise, the man (age 31, BMI 28) with the highest plasma suPAR (2.0 ng/mL) also had the highest saliva suPAR among the male sub-jects. Hence, it would be of considerable value to measure saliva suPAR in different populations, with expected high or low plasma suPAR.
CRP is an acute phase marker and currently the best quantitative measure of an ongoing inflamma-tion and hence, associainflamma-tions between suPAR and CRP were investigated. CRP and suPAR levels were cor-related in blood but not in saliva, among the females in this study. A number of studies focused on correla-tions between CRP and suPAR in blood show con-flicting results,11,17,18 for example, early studies done
by Slot et al19 demonstrated that suPAR and CRP
cor-related in patients with rheumatoid arthritis but not in patients with reactive arthritis. A prospective cohort study by Eugen-Olsen et al7 including 2602
individu-als (ages 41–71) established a moderate positive cor-relation between CRP and suPAR in serum/plasma. Also, a lack of association between BMI and plasma suPAR but a correlation between BMI and CRP was demonstrated, in agreement with this study. Their theory was that CRP and suPAR may reflect different
inflammatory aspects, and thus suPAR appears less related to dysmetabolic conditions.
In the present study there was no saliva-serum CRP correlation; the results are consistent with a previously published study20 which also measured
saliva and plasma levels of CRP in a young healthy subject group. On the other hand, a study by Quellet-Morin et al21 observed a moderate to strong
association between CPR in saliva and serum. A lower correlation was found at serum CRP levels below 2.0 mg/L in comparison to high CRP levels ($2.0 mg/L), suggesting that the prediction of serum CRP levels from saliva CRP levels is more accurate at higher serum concentrations. In addition, Punyadeera et al22 demonstrated a correlation between saliva and
serum CRP at serum concentrations above 5 mg/mL. In the present study none of the subjects had serum CRP concentrations higher than 3.7 mg/L. In healthy individuals, normal CRP levels are generally considered to be ,3 mg/L. Low-grade inflammation can produce minor elevations of CRP in the 3–10 mg/L range while CRP levels higher than about 10 mg/L are typically associated with infection.23 Salivary
CRP levels in the present study are in agreement with previously published data by Dillon et al and Ouellet-Morin et al.20,21 Five of the participants had
saliva CRP levels higher than 2 SD from the mean, ie, 6.2 µg/mL in healthy adults, according to the kit manufacturer. Correspondingly high values were not observed from serum CRP. The high CRP saliva samples were serially diluted and re-analyzed; the dilutions followed a linear scale. Nevertheless, there was still no saliva-serum CRP correlation when excluding those five extreme values from the analysis. Quellet-Morin et al21 also reported 10 (of totally 61
participants) extreme saliva CRP values that could not be explained by biological or clinical variables (poor precision of the assay, blood contamination, saliva pH, or the participants health conditions).
In conclusion, our results indicate that suPAR lev-els are higher in saliva than plasma but saliva and plasma suPAR are not correlated in healthy young adults with normal plasma suPAR levels. It is obvi-ous that correlations established in the present study are of limited value due to the small cohort. However, the results obtained point to some interesting issues to be explored in future studies. The mechanism by which suPAR is carried from blood to saliva needs to
be further investigated, taking into consideration that elevated saliva suPAR levels may be a product of local synthesis in the gingival tissue or the saliva glands.
It has been suggested that plasma suPAR may be a general marker of low grade inflammatory processes and that elevated suPAR levels correlate with risks of developing cancer, diabetes, and cardiovascular dis-ease in the general population.7,10,11 Hence, it would
be of considerable value to explore if saliva suPAR also could be a marker similar to plasma suPAR; measuring saliva suPAR is straightforward and non-invasive, facilitating screening in large populations.
Disclosures
Author(s) have provided signed confirmations to the publisher of their compliance with all applicable legal and ethical obligations in respect to declaration of conflicts of interest, funding, authorship and contrib-utorship, and compliance with ethical requirements in respect to treatment of human and animal test subjects. If this article contains identifiable human subject(s) author(s) were required to supply signed patient consent prior to publication. Author(s) have confirmed that the published article is unique and not under consideration nor published by any other pub-lication and that they have consent to reproduce any copyrighted material. The peer reviewers declared no conflicts of interest.
References
1. Thuno M, Macho B, Eugen-Olsen J. suPAR: the molecular crystal ball. Dis
Markers. 2009;27:157–72.
2. Blasi F, Carmeliet P. uPAR: a versatile signalling orchestrator. Nat Rev Mol
Cell Biol. 2002;3:932–43.
3. Chavakis T, Kanse SM, Yutzy B, Lijnen HR, Preissner KT. Vitronec-tin concentrates proteolytic activity on the cell surface and extracellular matrix by trapping soluble urokinase receptor-urokinase complexes. Blood. 1998;91:2305–12.
4. Rabna P, Andersen A, Wejse C, Oliveira I, Francisco Gomes V, Bonde Haaland M, et al. Urine suPAR levels compared with plasma suPAR levels as predictors of post-consultation mortality risk among individuals assumed to be TB-negative: a prospective cohort study. Inflammation. 2010;33: 374–80.
5. Wahlberg K, Hoyer-Hansen G, Casslen B. Soluble receptor for urokinase plasminogen activator in both full-length and a cleaved form is present in high concentration in cystic fluid from ovarian cancer. Cancer Res. 1998;58:3294–8.
6. Ostergaard C, Benfield T, Lundgren JD, Eugen-Olsen J. Soluble urokinase receptor is elevated in cerebrospinal fluid from patients with purulent meningitis and is associated with fatal outcome. Scand J Infect Dis. 2004;36:14–9.
7. Eugen-Olsen J, Andersen O, Linneberg A, Ladelund S, Hansen TW, Langkilde A, et al. Circulating soluble urokinase plasminogen activator receptor predicts cancer, cardiovascular disease, diabetes and mortality in the general population. J Intern Med. 2010;268:296–308.
8. Molkanen T, Ruotsalainen E, Thorball CW, Jarvinen A. Elevated soluble urokinase plasminogen activator receptor (suPAR) predicts mortality in Staphylococcus aureus bacteremia. Eur J Clin Microbiol Infect Dis. 2011.
9. Kofoed K, Eugen-Olsen J, Petersen J, Larsen K, Andersen O. Predict-ing mortality in patients with systemic inflammatory response syndrome: an evaluation of two prognostic models, two soluble receptors, and a macrophage migration inhibitory factor. Eur J Clin Microbiol Infect Dis. 2008;27:375–83.
10. Sehestedt T, Lyngbaek S, Eugen-Olsen J, Jeppesen J, Andersen O, Hansen TW, et al. Soluble urokinase plasminogen activator receptor is associated with subclinical organ damage and cardiovascular events. Atherosclerosis. 2011;216:237–43.
11. Langkilde A, Hansen TW, Ladelund S, Linneberg A, Andersen O, Haugaard SB, et al. Increased plasma soluble uPAR level is a risk marker of respiratory cancer in initially cancer-free individuals. Cancer Epidemiol
Biomarkers Prev. 2011;20:609–18.
12. Eugen-Olsen J, Gustafson P, Sidenius N, Fischer TK, Parner J, Aaby P, et al. The serum level of soluble urokinase receptor is elevated in tuberculosis patients and predicts mortality during treatment: a community study from Guinea-Bissau. Int J Tuberc Lung Dis. 2002;6:686–92.
13. Kinnby B, Lindberg P, Lecander I, Matsson L. Localization of plasminogen activators and plasminogen-activator inhibitors in human gingival tissues demonstrated by immunohistochemistry and in situ hybridization. Arch
Oral Biol. 1999;44:1027–34.
14. Yin X, Bunn CL, Bartold PM. Detection of tissue plasminogen activator (t-PA) and plasminogen activator inhibitor 2(PAI-2) in gingival crevicular fluid from healthy, gingivitis and periodontitis patients. J Clin Periodontol. 2000;27:149–56.
15. Virtanen OJ, Siren V, Multanen J, Farkkila M, Leivo I, Vaheri A, et al. Plasminogen activators and their inhibitors in human saliva and salivary gland tissue. Eur J Oral Sci. 2006;114:22–6.
16. Masucci MT, Pedersen N, Blasi F. A soluble, ligand binding mutant of the human urokinase plasminogen activator receptor. J Biol Chem. 1991;266:8655–8.
17. Koch A, Voigt S, Kruschinski C, Sanson E, Duckers H, Horn A, et al. Circulating soluble urokinase plasminogen activator receptor is stably ele-vated during the first week of treatment in the intensive care unit and pre-dicts mortality in critically ill patients. Crit Care. 2011;15:R63.
18. Yilmaz G, Koksal I, Karahan SC, Mentese A. The diagnostic and prognostic significance of soluble urokinase plasminogen activator receptor in systemic inflammatory response syndrome. Clin Biochem. 2011.
19. Slot O, Brunner N, Locht H, Oxholm P, Stephens RW. Soluble urokinase plasminogen activator receptor in plasma of patients with inflammatory rheumatic disorders: increased concentrations in rheumatoid arthritis. Ann
Rheum Dis. 1999;58:488–92.
20. Dillon MC, Opris DC, Kopanczyk R, Lickliter J, Cornwell HN, Bridges EG, et al. Detection of homocysteine and C-reactive protein in the saliva of healthy adults: comparison with blood levels. Biomark Insights. 2010;5:57–61. 21. Ouellet-Morin I, Danese A, Williams B, Arseneault L. Validation of a
high-sensitivity assay for C-reactive protein in human saliva. Brain Behav
Immun. 2011;25:640–6.
22. Punyadeera C, Dimeski G, Kostner K, Beyerlein P, Cooper-White J. One-step homogeneous C-reactive protein assay for saliva. J Immunol Methods. 2011.
23. Windgassen EB, Funtowicz L, Lunsford TN, Harris LA, Mulvagh SL. C-reactive protein and high-sensitivity C-reactive protein: an update for clinicians. Postgrad Med. 2011;123:114–9.
publish with Libertas Academica and every scientist working in your field can
read your article
“I would like to say that this is the most author-friendly editing process I have experienced in over 150
publications. Thank you most sincerely.” “The communication between your staff and me has
been terrific. Whenever progress is made with the manuscript, I receive notice. Quite honestly, I’ve
never had such complete communication with a journal.”
“LA is different, and hopefully represents a kind of scientific publication machinery that removes the
hurdles from free flow of scientific thought.”
Your paper will be:
• Available to your entire community
free of charge
• Fairly and quickly peer reviewed
• Yours! You retain copyright