Volume 2012, Article ID 579274,9pages doi:10.1155/2012/579274
Research Article
Novel Implant Coating Agent Promotes Gene Expression of
Osteogenic Markers in Rats during Early Osseointegration
Kostas Bougas,
1Ryo Jimbo,
1Ying Xue,
2Kamal Mustafa,
2and Ann Wennerberg
1 1Department of Prosthodontics, Faculty of Odontology, Malm¨o University, 205 06 Malm¨o, Sweden2Department of Clinical Dentistry, Center for Clinical Research, Faculty of Medicine and Dentistry, University of Bergen,
˚
Arstadveien 17, 5009 Bergen, Norway
Correspondence should be addressed to Kostas Bougas,kostas.bougas@mah.se
Received 9 September 2012; Accepted 6 October 2012 Academic Editor: Carlos Nelson Elias
Copyright © 2012 Kostas Bougas et al. This is an open access article distributed under the Creative Commons Attribution License, which permits unrestricted use, distribution, and reproduction in any medium, provided the original work is properly cited. The aim of this study was to evaluate the early bone response around laminin-1-coated titanium implants. Forty-five rats distributed in three equally sized groups were provided with one control (turned) and one test (laminin-1-coated) implant and were sacrificed after 3, 7, and 21 days. Real-time reverse-transcriptase polymerase chain reaction was performed for osteoblast markers (alkaline phosphatase, runt-related transcription factor 2, osteocalcin, type I collagen, and bone morphogenic protein 2), osteoclast markers (cathepsin K and tartrate-resistant acid phosphatase), inflammation markers (tumor necrosis factor α, interleukin 1β and interleukin 10), and integrin β1. Bone implant contact (BIC) and bone area (BA) were assessed and compared to the gene expression. After 3 days, the expression of bone markers was higher for the control group. After 7 days, the expression of integrinβ1 and osteogenic markers was enhanced for the test group, while cathepsin K and inflammation markers were down-regulated. No significant differences in BIC or BA were detected between test and control at any time point. As a conclusion, implant coating with laminin-1 altered gene expression in the bone-implant interface. However, traditional evaluation methods, as histomorphometry, were not adequately sensitive to detect such changes due to the short follow-up time.
1. Introduction
Dental implants have been proven to be a reliable long-term therapy against edentulism [1–3]. However, the reported high success figures of implant therapy have been based on implants inserted using two-stage surgical protocol and conventional loading. The increased demand on implant performance and the broadened treatment indications have led to the development of new moderately rough surfaces. Alterations in both the surface chemistry and topography may contribute to chemical influence on bone tissue, a phenomenon defined as bioactivity [4]. Furthermore, other factors such as surface energy, surface wettability, cellular maturation state, nutrition status, and microstresses alter the degree of bioactivity too. Compared to the previously used turned implants, the bioactively modified implants have demonstrated higher success rate in demanding cases, for
example, early functional loading [5], one-stage surgery [6], and reconstructive jaw surgery [7].
When moderately rough surfaces remain within bone tissue no differences on microbial colonization are observed as compared to minimally rough surfaces [8]. However, there has been increasing evidence pointing out that as soon mod-erately rough implants are exposed to the oral milieu the case changes. A series of studies examining clinical, histological, and radiological aspects of experimental peri-implantitis in a dog model has reported that exposure of the implant surfaces to the oral environment leads to spontaneous progression of experimental peri-implantis [9–11]. The same research group has reported that implant surface characteristics affect the possibility to treat experimental peri-implantitis without antimicrobial therapy, thereby influencing the treatment outcome [12]. Additionally, a recent in vitro study has pro-posed that increased implant roughness promotes bacterial
colonization most likely depending on protection of bacteria from shear forces [13]. Even if the referred studies are experimental in nature, the idea of developing an implant that combines the osseoconductive properties of a moder-ately rough surface with the accessibility for debridement of turned surfaces is intriguing.
In order to enhance bone formation, implants have been coated with bone specific biomolecules [14–17]. Interest-ingly, even non-bone-specific molecules have reported to induce osteogenicity [18]. One potential non-bone-specific osteogenic molecule is laminin-1. Laminins are heterotri-meric glycoproteins that bind to integrins, especiallyβ1 and
β2 isomers [19]. The N-terminal of laminin-1 has been reported to selectively recruit osteoprogenitors through inte-grinβ1-mediated cell attachment [20,21] and to stimulate production of alkaline phosphatase by osteoblasts [22]. Additionally, recent in vitro studies [23,24] have elucidated the role of laminin as nucleation center and its potential to enhance osteoid formation in a simulated body fluid. Nevertheless, since the in vivo environment is more complex in terms of protein interactions [25] and desorption of the coating agent [26], in vivo validation has been imperative. In theory, any effects of a protein coating are more pronounced during the early stages of osseointegration.
The purpose of this in vivo study is to investigate the detailed molecular mechanisms underlying the possible effects of the coating agent laminin-1 on osseointegration and to compare them to histological evaluation methods.
2. Materials and Methods
2.1. Implants and Laminin-1 Coating. In total, 90 threaded
titanium (grade 4) implants with turned surface were used (diameter: 1.5 mm, length: 2.5 mm, internal hexagonal connection, batch 800101579, Neodent, Brazil). Half of the implants (N = 45) were coated with laminin-1 in accordance with previous in vitro study [24] and served as the test group. In brief, laminin-1 (L2020, Sigma-Aldrich, Stockholm, Sweden) was diluted to a concentration of 100μg/mL in Dulbecco’s phosphate-buffered saline (DPBS) without CaCl2 or MgCl2 (14190-094; GIBCO, Invitrogen
Corporation, Grand Island, NY, USA). The implants were subsequently incubated in 48-well plates (Nunclon Surface, Nunc, Roskilde, Denmark) containing 250μL of the laminin-1 solution per well, for laminin-1 h at room temperature. The protein thickness after incubation was estimated by ellipsometry. Since the implant surface did not reflect the light beam in a measurable manner, the amount of adsorbed laminin was calculated on optically smooth titanium surfaces produced at the laboratory as described by Linderb¨ack et al. [27]. As previously described by Bougas et al. [24], the optically smooth titanium surfaces were fixed in the ellipsometric quvette filled with PBS at room temperature. The ellipso-metric anglesΔ0 andΨ0 were measured at three locations
with a Rudolph Research AutoEL III ellipsometer operating in a wavelength of 632.8 nm at a 70◦ angle of incidence. Subsequently, the quvette was emptied and filled with laminin solution and new anglesΔ and Ψ calculated. The
protein layer thickness was calculated from the ellipsometric angle changes for a protein refractive index ofn=1.465. By using the McCrackin algorithm for the calculations [28], it was concluded that the incubation resulted in protein thick-ness corresponding to 2.6 nm. The remaining 45 uncoated implants served as controls.
2.2. Surface Characterization. The surface topography of the
implants was characterized with an optical interferometer (MicroXam, ADE Phase Shift, Tucson, AZ, USA) operating in wavelength of λ = 550 nm. According to the proposed guidelines for implant surface characterization [29], three implants from each group were randomly selected and each measured in 9 regions (3 thread tops, 3 thread valleys, and 3 flank regions). A B-spline filter was applied to separate roughness from form and waviness. The following three topographical parameters were evaluated: an amplitude parameter, Sa (μm) = the arithmetic average height deviation from the mean plane; a spatial parameter, Sds (μm−2)= the
density of summits; and a hybrid parameter, Sdr (%)= the developed surface ratio.
2.3. Animals and Surgical Procedure. The study was approved
by the Malm¨o/Lund, Sweden, Regional Animal Ethical Com-mittee (approval number: M253-10) and included 45 male Wistar Hannover Galas rats with an average weight of 350 g.
Prior to surgery, the animals were sedated by intra-peritoneal administration of a mixture of Dormicum 5 mg/mL (Midazolam, Roche), Hypnorm (fentanylcitrate 0.315 mg/mL and fluanisone 10 mg/mL, Janssen Pharma-ceutical) and sterile saline 0.9 mg/mL (Braun) in a dose of 1.5–2 mL/kg body weight. The hind legs were disinfected with 70% ethanol and 70% chlorhexidine, and Lidocaine hydrochloride (Xylocaine; AstraZeneca AB) was adminis-trated as the local anaesthetic at each insertion site at a dose of 0.5 mL. One control implant was operated into the right tibia and one test implant into the left of each animal. One animal died after the sedation procedure. After the operation, buprenorphine hydrochloride (0.5 mL Temgesic; Reckitt Benckiser, Slough, UK) was administered as an anal-gesic for 3 days.
2.4. RNA Extraction and Real-Time Reverse-Transcription Polymerase Chain Reaction
2.4.1. Sample Retrieval. The animals were divided into three
groups and were sacrificed after 3 days (N = 14), 1 week (N=15) and 3 weeks (N=15) with an overdose of carbon monoxide in a gas chamber. The skin above the implants was incised, and 20 implants (10 pairs control/test) for each of the two first groups (3 days and 1 week) were turned out manually. Since one implant in the 3-week group did not osseointegrate, 18 implants (9 pairs control/test) were turned out manually. The removed implants, along with the interface bone tissue, were placed in RNAlater solution (QIAGEN GmbH, Hilden, Germany), and frozen at−80◦C until analysis.
2.4.2. RNA Extraction from Implant Screws. The samples
were processed in the TissueLyser instrument (Qiagen GmbH) together with β-mercaptoethanol RNeasy Lysis-buffer to remove and disrupt the cells attached to the surface of the implant screw. RNA was extracted from the sample mixtures with RNeasy Micro Kit number 74004 (Qiagen GmbH) according to manufacturer’s instructions, including carrier to minimize decrease in yield due to small sample quantity. During extraction, all samples were DNase-treated according to manufacturer’s instructions with RNase free DNase Set #1023460 (Qiagen GmbH) to reduce gDNA contamination.
2.4.3. Reverse Transcription (RT). All RNA samples were
reverse transcribed in single 10μL reactions according to manufacturer’s instructions using TATAA RT Kit number A103b (TATAA Biocenter AB) to generate cDNA. RT-controls were included to monitor the presence of gDNA. The controls were analyzed in pools of five, containing 1.5μL of each sample (total volume 7.5 μL). Control of RNA concentration was not possible due to the presence of carrier in extraction procedure.
2.4.4. Real Time Reverse-Transcription Polymerase Chain Reaction (Real Time RT-PCR). For each Real Time RT-PCR,
10μL mixtures were prepared with 1 μL cDNA, according to the manufacturer’s recommendations (Applied Biosystem, CA, USA). Amplification was carried out in 96-well thermal cycle plates on a StepOne detection system (Applied Biosys-tems, USA) according to the manufacturer’s recommen-dations with custom-designed real-time assays and SYBR green detection (PrimerDesign Ltd, Southampton, UK)
(Table 1). Normalization and fold-changes were calculated
with StepOneTM software with theΔΔCt method [30].
2.5. Histomorphometry. The remaining implants from each
group were retrieved en bloc and were immersed in 4% neutral buffered formaldehyde. Since one implant from the 3 week group did not osseointegrate possibly due to an incorrect insertion angle, the final numbers of implants processed for histology were; n = 8 for 3 days, n = 10 for 1 week, and n = 8 for 3 weeks. All the samples were processed for undecalcified ground sectioning [31]. Briefly, after a series of dehydrations and infiltrations in resin, the samples were embedded in light-curing resin (Technovit 7200 VLC; Heraeus Kulzer Wehrheim, Germany). One cen-tral ground section was prepared from each implant by using Exakt sawing and grinding equipment (Exakt Apparatebau, Hamburg, Germany). The sections were ground to a final thickness of approximately 10μm and histologically stained with Toluidine blue mixed with pyronin G.
Histological evaluations were performed using a light microscope (Eclipse ME600; Nikon, Japan), and the his-tomorphometrical data were analyzed by image analysis software (Image J v. 1.43u; National Institutes of Health, Bethesda, Maryland). The bone-implant contact (BIC) and the bone area (BA) percentage along the whole implant were calculated at×10 objective magnification as described previously [32,33].
Table 1: Oligonucleotides used for real time RT-PCR.
Gene Cat no. Amplicon Length (bp)
Runx-2 Rn01512298 m1 86 ALP Rn01516028 m1 68 Osteocalcin Rn00566386 g1 104 BMP-2 Rn00567818 m1 126 Collagen 1 Rn01463848 m1 115 Integrinβ1 Rn01753534 m1 82 IL-10 Rn00563409 m1 70 TNF-α Rn99999017 m1 108 IL-1β Rn00580432 m1 74 TRAP Rn00569608 m1 95 CTSK Rn00580723 m1 67 β-actin 4352931E 91
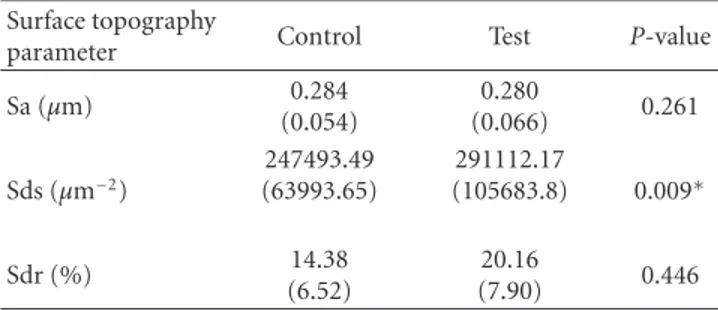
Table 2: Mean values (SD) for surface topography parameters for control and test implant, and P-values for pair-wise comparisons. Asterisk denotes statistically significant difference (P < 0.05).
Surface topography
parameter Control Test P-value
Sa (μm) 0.284 (0.054) 0.280 (0.066) 0.261 Sds (μm−2) 247493.49 (63993.65) 291112.17 (105683.8) 0.009∗ Sdr (%) 14.38 (6.52) 20.16 (7.90) 0.446
3. Statistics
The statistical calculations were performed with SPSS (ver-sion 18 Chicago, Illinois, USA). The statistical comparison for the mean values of the topographic parameters Sa, Sds, and Sdr was assessed by Studentst-test. For BIC and BA the nonparametric Wilcoxon signed ranks test was used while for relative gene expression, the Student’s pairedt-test was employed. The level of statistical significance was set atP ≤
0.05.
4. Results
4.1. Surface Characterization. The lamin1 coating
in-creased the density of summits (Sds) significantly (P =
0.009). On the contrary, the protein coating did neither affect the average height deviation from the mean plane (Sa) (P =
0.261) nor the developed surface ratio (Sdr) (P =0.446) of the implants significantly (Table 2).
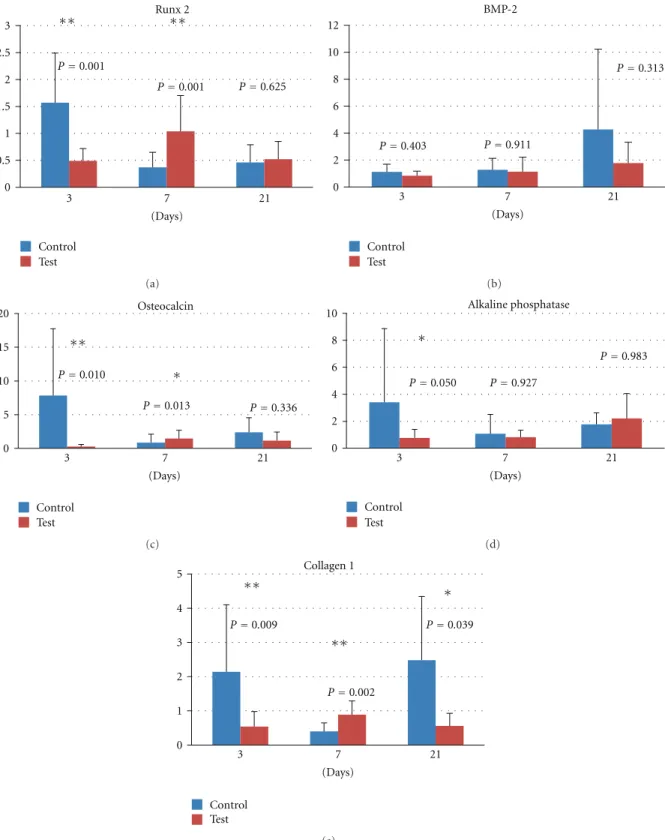
4.2. Real Time RT-PCR. Although the gene expression for
the osteoprogenitor marker runt-related transcription factor 2 (Runx2) was lower for the test than for the control after 3 days, it was doubled at 7 days resulting in statistically significantly higher levels as compared to the control. After 21 days, the difference in the expression of the gene for Runx2 between test and control was evened out (Figure 1(a)). The second osteoprogenitor differentiation, marker bone
morphogenic protein-2 (BMP-2), did not differ between test and control at any time point (Figure 1(b)).
The initial gene expression (3 days) of the osteblas-tic markers osteocalcin (Figure 1(c)), alkaline phosphatase (ALP) (Figure 1(d)) and type I collagen (Figure 1(e)) was higher for the control group. Nevertheless, after 7 days the expression of the osteoblastic markers increased for the test group and declined for the control. This alteration resulted in statistically significantly higher mRNA levels of osteocalcin and type I collagen in favour of the test group. After 21 days no statistically significant differences were detected between test and control in the expression of osteoclacin and ALP. On the contrary, the expression of type I collagen for the control group was enhanced to statistically significantly higher levels as compared to the test group.
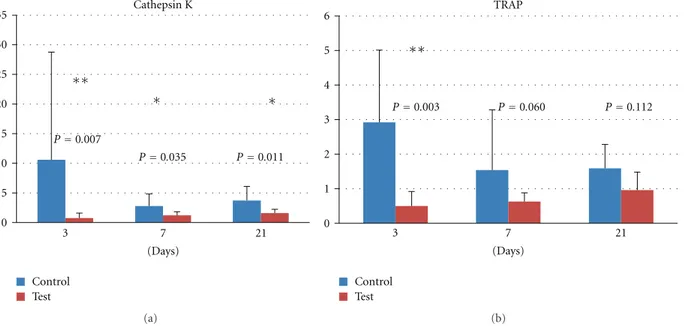
The expression of the osteoclastic marker Cathepsin
K (Figure 2(a)) demonstrated a descending trend for the
control group during the observation time. In contrast to the control group, the expression of Cathepsin K remained stable for the test group throughout the observation period. The expressed levels of Cathepsin K were statistically significantly lower for the test group at all times (3 days, 7 days, and 21 days). The mRNA levels of the osteoclastic marker tartrate-resistant acid phosphatase (TRAP) (Figure 2(b)) declined with time. After 3 days, the levels of TRAP were statistically significantly higher for the control group, whilst no statistically significant differences were detected between test and control at 7 or 21 days.
The gene expression of integrinβ1 (Figure 3(a)) for the test group peaked at 7 days. At this time point, the mRNA levels for integrin β1 were statistically significantly higher for the test group (4.90-fold). Despite the enhanced levels of integrinβ1 mRNA expression in the control group after 21 days, no statistically significant differences were detected.
The proinflammatory cytokines tumor necrosis fac-tor α (TNF-α) (Figure 3(b)) and interleukin 1β (IL-1β)
(Figure 3(c)) peaked at 7 days. The fold of relative mRNA
expression was 6.65 for TNF-α and 51.88 for IL-1β in favour of the control group. However, no statistically significant differences were detected at 3 and 21 days. The expression of TNF-α and IL-1β remained stable for the test group at 3, 7, and 21 days. No statistically significant differences were detected between test and control in the expression of the anti-inflammatory cytokine IL-10 (Figure 3(d)).
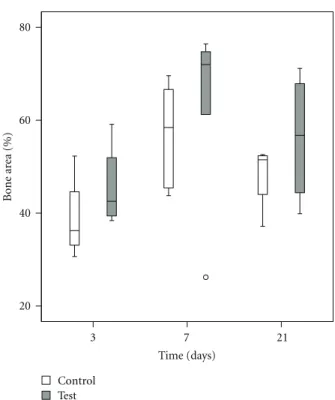
4.3. Histomorphometry. The values of BIC and BA were
enhanced after 7 and 21 days as compared to 3 days. The test group demonstrated higher median BIC and BA at all the evaluated time points (Figures4and5). The differences between the test and control were though not statistically significant (P > 0.05) (Table 2).
5. Discussion
In the current study, we have investigated the effects of laminin-1 coating on the early stages of osseointegration. The implants chosen for this purpose are turned with a smooth surface (Sa= 0.28μm). Implants with turned surface have a long history of clinical documentation [1–3] and
hence may be regarded as the “gold standard.” The rational for rather using a smooth implant than a moderately rough, is based upon the theorem that moderately rough implants enhance osseointegration [34], thereby possibly concealing any effects of the biochemical coating. Additionally, a turned implant surface was chosen in order to investigate whether a biochemical coating can induce cell responses equivalent to the ones promoted by surface topography modifications [35, 36]. According to the surface analysis, the coating process has significantly increased the density of peaks (Sds). Since the implant surface has a minimally rough profile, the protein coating may be detected by the interferometer as prominences on the implant surface, hence resulting in elevated peak density of the test implant.
Depending on protein-desorption kinetics [26], the bio-chemical coating is theoretically most active during the first days after the implant installation. For this reason, we have chosen to investigate the early effects of the laminin-1 coating after 3, 7, and 21 days. The early time-points investigated in this study have been previously used in the literature in order to screen the expression of bone-related genes and inflammatory markers in a rat model [35, 37]. Since the degree of diffusion of the coating into the surrounding bone is unknown, we have chosen to collect the interface bone tissue from the removed implant instead of retrieving the implant along with the surrounding bone en bloc. The analysis of the interface bone tissue is further justified by a histological study concluding that implant coating material released by the shear forces during implant insertion residues within the peri-implant space [38].
The gene analyses from the interface bone tissue reveal after 7 days significantly higher levels of the transcription factor Runx-2, which is the master gene for osteoblast dif-ferentiation and is expressed by the committed osteoprogen-itors [39]. At the same time point, integrinβ1 is significantly upregulated for the test implant. It has been suggested that laminin stimulates osteoprogenitors by attachment to integrinβ1 in vitro [20,21]. It has also been demonstrated that activation of Runx2 by MAPK is possible by binding of type I collagen to α2 β1 integrins [40]. Since collagen type I is also elevated after 7 days, a possible mechanism of action for laminin-1 could be indirect activation of Runx2 by elevating the expression of type I collagen which attaches to integrin β1. After 7 days, no significant difference in BMP-2 levels was detected between test and control. This may imply that laminin-1 has an indirect effect on the existing osteoprogenitors in the peri-implant space, without promoting commitment of the surrounding mesenchymal stem cells to osteoprogenitors via BMP-2 [41].
Apart from the molecular mechanisms involved in the effect of laminin-1 on osteoprogenitors, our results suggest an additional effect on differentiated osteoblasts. The gene expression of collagen type I and the marker for mature post-proliferative osteoblasts, osteocalcin [42], are up-regulated after 7 days. Hence, laminin-1 may contribute to the enrich-ment of the extracellular matrix in the direct proximity of the implant. If we additionally take into account the significantly decreased expression of the osteoclastic proteolytic enzyme cathepsin K [43], the bone remodeling [44] may be further
Runx 2 ∗∗ ∗∗ 3 2.5 2 1.5 1 0.5 0 P=0.001 P=0.001 P=0.625 3 (Days) 7 21 Control Test (a) BMP-2 12 10 8 6 4 2 0 P=0.403 P=0.911 P=0.313 3 (Days) 7 21 Control Test (b) Osteocalcin ∗ ∗∗ 20 15 10 5 0 P=0.010 P=0.013 P=0.336 Control Test 3 (Days) 7 21 (c) Alkaline phosphatase ∗ 10 8 6 4 2 0 P=0.050 P=0.927 P=0.983 Control Test 3 (Days) 7 21 (d) Collagen 1 ∗ ∗∗ ∗∗ 5 4 3 2 1 0 P=0.009 P=0.002 P=0.039 Control Test 3 (Days) 7 21 (e)
Figure 1: Relative gene expression for osteoblast markers at 3, 7, and 21 days: (a) runt-related transcription factor 2, (b) bone morphogenic protein 2, (c) osteocalcin, (d) alkaline phosphatase, and (e) type I collagen.
displaced in favor of osteogenesis. As reported in the literature, low expression of cathepsin K can be correlated to low levels of the proinflammatory cytokines IL-1β and TNF-α, both considered to be expressed on bone sites with
pronounced osteoclastic resorption [43]. As it concerns the 3-day time point, the expression of both osteogenic and osteoclastic markers is higher for the control group. Keeping into consideration that the outcome of the bone
Cathepsin K 35 30 25 20 15 10 5 0 ∗ ∗ ∗∗ P=0.007 P=0.035 P=0.011 3 7 21 (Days) Control Test (a) ∗∗ Control Test TRAP 6 5 4 3 2 1 0 P=0.003 P=0.060 P=0.112 3 7 21 (Days) (b)
Figure 2: Relative gene expression for osteoclast markers at 3, 7, and 21 days: (a) cathepsin K and (b) tartrate-resistant acid phosphatase.
∗∗ 8 6 4 2 0 3 (Days) 7 21 Control Test Integrinβ1 P=0.139 P=0.005 P=0.585 (a) 8 6 4 2 0 3 7 (Days) 21 Control Test TNF-α P=0.942 P=0.013 P=0.172 ∗ (b) 50 40 30 20 10 0 Control Test IL-1β P=0.611 P=0.006 P=0.628 ∗∗ 3 (Days) 7 21 (c) 14 12 10 8 6 4 2 0 Control Test IL-10 P=0.698 P=0.172 P=0.541 3 (Days) 7 21 (d)
Figure 3: Relative gene expression at 3, 7, and 21 days: (a) integrinβ1, (b) tumor necrosis factor α, (c) interleukin 1β, and (d) interleukin 10.
80 60 40 20 Bone implant c o ntact (%) Time (days) 3 7 21 Control Test
Figure 4: Box plot describing bone implant contact (%) at 3, 7, and 21 days.
metabolism is decided by a coupled mechanism between bone deposition and bone resorption [44], it is uncertain whether this increased activity will result to more or less new bone.
A comparison of the findings from the gene analyses to the findings from the histomorphometry reveals some discrepancies. Although there are important differences in gene expression, no differences are detected on BIC or BA after 3 and 7 days. This finding is considered reasonable keeping in mind that bone remodeling is a time-demanding process. Discrepancies between the results from traditional evaluation methods and genetic analysis have been reported previously [45]. The fact that no differences were detected on BIC or BA after 21 days is in agreement with the results from the gene expression. This result may be explained by the fact that the coating is expected to be more active during the early stages of osseointegration, since it may be gradually desorbed from the interface as demonstrated in vitro [26].
Conclusively, within the limitations of our study, we suggest that it is possible to alter the cell behavior on the implant-bone interface towards the osteogenic direction by coating the implant surface with laminin-1. However, the reported changes are not detected by histomorphometry, most likely depending on the fact that this method is not adequately sensitive at the short times of follow-up applied on the present study.
Acknowledgments
This study was funded by the Swedish National Graduate School in Odontological Science, the Swedish Research
80 60 40 20 Time (days) 3 7 21 Control Test Bone ar ea (%)
Figure 5: Box-plot describing bone area (%) at 3, 7 and 21 days.
Council (K2009-52X-06533-27-3), the Swedish Knowl-edge Foundation (KK-stiftelsen), Hjalmar Svenson Research Foundation, Wilhelm and Martina Lundgren Science Foun-dation, Sylvan Foundation and the Council for Research and Development in S¨odra ¨Alvsborg, Sweden. The implants used in this study were kindly provided by Neodent. The company has no financial interests in this study.
References
[1] T. Jemt and J. Johansson, “Implant treatment in the edentu-lous maxillae: a 15-year follow-up study on 76 consecutive patients provided with fixed prostheses,” Clinical Implant
Dentistry and Related Research, vol. 8, no. 2, pp. 61–69, 2006.
[2] T. Jemt, “Single implants in the anterior maxilla after 15 years of follow-up: comparison with central implants in the edentulous maxilla,” International Journal of Prosthodontics, vol. 21, no. 5, pp. 400–408, 2008.
[3] P. ˚Astrand, J. Ahlqvist, J. Gunne, and H. Nilson, “Implant treatment of patients with edentulous jaws: a 20-year follow-up,” Clinical Implant Dentistry and Related Research, vol. 10, no. 4, pp. 207–217, 2008.
[4] D. F. Williams, The Williams Dictionary of Biomaterials, Liver-pool University Press, LiverLiver-pool, UK, 1st edition, 1999. [5] M. Jungner, P. Lundqvist, and S. Lundgren, “Oxidized
tita-nium implants (Nobel Biocare TiUnite) compared with turn-ed titanium implants (Nobel Biocare mark III) with respect to implant failure in a group of consecutive patients treated with early functional loading and two-stage protocol,” Clinical Oral
Implants Research, vol. 16, no. 3, pp. 308–312, 2005.
[6] B. Friberg and T. Jemt, “Rehabilitation of edentulous mandi-bles by means of five TiUnite implants after one-stage surgery:
a 1-year retrospective study of 90 patients,” Clinical Implant
Dentistry and Related Research, vol. 10, no. 1, pp. 47–54, 2008.
[7] M. Brechter, H. Nilson, and S. Lundgren, “Oxidized titanium implants in reconstructive jaw surgery,” Clinical Implant
Dentistry and Related Research, vol. 7, no. 1, supplement, pp.
S83–S87, 2005.
[8] M. Quirynen and N. Van Assche, “RCT comparing minimally with moderately rough implants—part 2: microbial observa-tions,” Clinical Oral Implants Research, vol. 23, pp. 625–634, 2012.
[9] J. P. Albouy, I. Abrahamsson, L. G. Persson, and T. Berglundh, “Spontaneous progression of peri-implantitis at different types of implants. An experimental study in dogs—I: clin-ical and radiographic observations,” Clinclin-ical Oral Implants
Research, vol. 19, no. 10, pp. 997–1002, 2008.
[10] J. P. Albouy, I. Abrahamsson, L. G. Persson, and T. Berglundh, “Spontaneous progression of ligatured induced peri-implantitis at implants with different surface characteristics. An experimental study in dogs II: histological observations,”
Clinical Oral Implants Research, vol. 20, no. 4, pp. 366–371,
2009.
[11] J. P. Albouy, I. Abrahamsson, and T. Berglundh, “Spontaneous progression of experimental peri-implantitis at implants with different surface characteristics: an experimental study in dogs,” Journal of Clinical Periodontology, vol. 39, pp. 182–187, 2012.
[12] J. P. Albouy, I. Abrahamsson, L. G. Persson, and T. Berglundh, “Implant surface characteristics influence the outcome of treatment of peri-implantitis: an experimental study in dogs,”
Journal of Clinical Periodontology, vol. 38, no. 1, pp. 58–64,
2011.
[13] V. Fr¨ojd, L. Ch´avez de Paz, M. Andersson, A. Wennerberg, J. R. Davies, and G. Svens¨ater, “In situ analysis of multispecies biofilm formation on customized titanium surfaces,”
Molecu-lar Oral Microbiology, vol. 26, no. 4, pp. 241–252, 2011.
[14] U. M. E. Wikesj¨o, Y. H. Huang, A. V. Xiropaidis et al., “Bone formation at recombinant human bone morphogenetic protein-2-coated titanium implants in the posterior maxilla (Type IV bone) in non-human primates,” Journal of Clinical
Periodontology, vol. 35, no. 11, pp. 992–1000, 2008.
[15] F. Thorey, H. Menzel, C. Lorenz, G. Gross, A. Hoffmann, and H. Windhagen, “Osseointegration by bone morphogenetic protein-2 and transforming growth factor beta2 coated tita-nium implants in femora of New Zealand white rabbits,”
Indian Journal of Orthopaedics, vol. 45, no. 1, pp. 57–62, 2011.
[16] J. Abtahi, P. Tengvall, and P. Aspenberg, “A bisphosphonate-coating improves the fixation of metal implants in human bone. A randomized trial of dental implants,” Bone, vol. 50, pp. 1148–1151, 2012.
[17] R. Jimbo, T. Sawase, Y. Shibata et al., “Enhanced osseointe-gration by the chemotactic activity of plasma fibronectin for cellular fibronectin positive cells,” Biomaterials, vol. 28, no. 24, pp. 3469–3477, 2007.
[18] M. Nyan, D. Sato, H. Kihara, T. MacHida, K. Ohya, and S. Kasugai, “Effects of the combination with α-tricalcium phos-phate and simvastatin on bone regeneration,” Clinical Oral
Implants Research, vol. 20, no. 3, pp. 280–287, 2009.
[19] H. Colognato and P. D. Yurchenco, “Form and function: the laminin family of heterotrimers,” Developmental Dynamics, vol. 218, pp. 213–234, 2000.
[20] P. Roche, H. A. Goldberg, P. D. Delmas, and L. Malaval, “Selective attachment of osteoprogenitors to laminin,” Bone, vol. 24, no. 4, pp. 329–336, 1999.
[21] P. Roche, P. Rousselle, J. C. Lissitzky, P. D. Delmas, and L. Malaval, “Isoform-specific attachment of osteoprogenitors to laminins: mapping to the short arms of laminin-1,”
Experi-mental Cell Research, vol. 250, no. 2, pp. 465–474, 1999.
[22] S. Vukicevic, F. P. Luyten, H. K. Kleinman, and A. H. Reddi, “Differentiation of canalicular cell processes in bone cells by basement membrane matrix components: regulation by discrete domains of laminin,” Cell, vol. 63, no. 2, pp. 437–445, 1990.
[23] K. Bougas, V. Franke Stenport, F. Currie, and A. Wenner-berg, “In vitro evaluation of calcium phosphate precipitation on possibly bioactive titanium surfaces in the presence of laminin,” Journal of Oral and Maxillofacial Research, vol. 2, no. 3, article e3, 2011.
[24] K. Bougas, V. Franke Stenport, P. Tengvall, F. Currie, and A. Wennerberg, “Laminin coating promotes calcium phosphate precipitation on titanium discs in vitro,” Journal of Oral and
Maxillofacial Research, vol. 2, no. 4, e5, 2011.
[25] D. M. Brunette, P. Tengvall, M. Textor, and P. Thomsen, “Pro-teins at titanium interfaces,” in Titanium in Medicine: Material
Science, Surface Science, Engineering, Biological Responses and Medical Applications, pp. 457–483, Sringer, Berlin, Germany,
2001.
[26] F. Fang, J. Satulovsky, and I. Szleifer, “Kinetics of protein adsorption and desorption on surfaces with grafted polymers,”
Biophysical Journal, vol. 89, no. 3, pp. 1516–1533, 2005.
[27] P. Linderb¨ack, N. Harmankaya, A. Askendal, S. Areva, J. Lausmaa, and P. Tengvall, “The effect of heat- or ultra violet ozone-treatment of titanium on complement deposition from human blood plasma,” Biomaterials, vol. 31, no. 18, pp. 4795– 4801, 2010.
[28] F. L. McCrackin, “A FORTRAN program for the analysis of ellipsometer measurements,” NBS technical note 479, Wash-ington, DC, USA, 1969.
[29] A. Wennerberg and T. Albrektsson, “Suggested guidelines for the topographic evaluation of implant surfaces,” International
Journal of Oral and Maxillofacial Implants, vol. 15, no. 3, pp.
331–344, 2000.
[30] T. D. Schmittgen and K. J. Livak, “Analyzing real-time PCR data by the comparative CT method,” Nature Protocols, vol. 3, no. 6, pp. 1101–1108, 2008.
[31] K. Donath and G. Breuner, “A method for the study of undecalcified bones and teeth with attached soft tissues. The Sage-Schliff (sawing and grinding) technique,” Journal of Oral
Pathology, vol. 11, no. 4, pp. 318–326, 1982.
[32] C. B. Johansson and T. Albrektsson, “A removal torque and histomorphometric study of commercially pure niobium and titanium implants in rabbit bone,” Clinical Oral Implants
Research, vol. 2, no. 1, pp. 24–29, 1991.
[33] C. B. Johansson, L. Sennerby, and T. Albrektsson, “A removal torque and histomorphometric study of bone tissue reactions to commercially pure titanium and Vitallium implants,” The
International Journal of Oral and Maxillofacial Implants, vol. 6,
no. 4, pp. 437–441, 1991.
[34] A. Wennerberg, On surface roughness and implant
incorpora-tion [Doctoral thesis], M.S. thesis, , G¨oteborg, Sweden, 1996.
[35] O. Omar, S. Svensson, N. Zoric et al., “In vivo gene expression in response to anodically oxidized versus machined titanium implants,” Journal of Biomedical Materials Research Part A, vol. 92, no. 4, pp. 1552–1566, 2010.
[36] O. M. Omar, M. E. Lenner˚as, F. Suska et al., “The correla-tion between gene expression of proinflammatory markers and bone formation during osseointegration with titanium implants,” Biomaterials, vol. 32, no. 2, pp. 374–386, 2011.
[37] O. Omar, F. Suska, M. Lenner˚as et al., “The influence of bone type on the gene expression in normal bone and at the bone-implant interface: experiments in animal model,”
Clinical Implant Dentistry and Related Research, vol. 13, no. 2,
pp. 146–156, 2011.
[38] T. T. H¨agi, L. Enggist, D. Michel, S. J. Ferguson, Y. Liu, and E. B. Hunziker, “Mechanical insertion properties of calcium-phosphate implant coatings,” Clinical Oral Implants Research, vol. 21, no. 11, pp. 1214–1222, 2010.
[39] G. S. Stein, J. B. Lian, A. J. Van Wijnen et al., “Runx2 control of organization, assembly and activity of the regulatory machinery for skeletal gene expression,” Oncogene, vol. 23, no. 24, pp. 4315–4329, 2004.
[40] R. T. Franceschi, G. Xiao, D. Jiang, R. Gopalakrishnan, S. Yang, and E. Reith, “Multiple signaling pathways converge on the Cbfa1/Runx2 transcription factor to regulate osteoblast differentiation,” Connective Tissue Research, vol. 44, no. 1, supplement, pp. 109–116, 2003.
[41] M. H. Lee, Y. J. Kim, H. J. Kim et al., “BMP-2-induced Runx2 expression is mediated by Dlx5, and TGF-beta 1 opposes the BMP-2-induced osteoblast differentiation by suppression of Dlx5 expression,” Journal of Biological Chemistry, vol. 278, no. 36, pp. 34387–34394, 2003.
[42] S. Kuroda, A. S. Virdi, Y. Dai, S. Shott, and D. R. Sumner, “Pat-terns and localization of gene expression during intramembra-nous bone regeneration in the rat femoral marrow ablation model,” Calcified Tissue International, vol. 77, no. 4, pp. 212– 225, 2005.
[43] D. Br¨omme and F. Lecaille, “Cathepsin K inhibitors for osteoporosis and potential off-target effects,” Expert Opinion
on Investigational Drugs, vol. 18, no. 5, pp. 585–600, 2009.
[44] K. I. Nakahama, “Cellular communications in bone home-ostasis and repair,” Cellular and Molecular Life Sciences, vol. 67, no. 23, pp. 4001–4009, 2010.
[45] R. Jimbo, Y. Xue, M. Hayashi et al., “Genetic responses to nanostructured calcium-phosphate-coated implants,” Journal