1
Transferrin receptor in children and its correlation with iron status
and types of milk consumption
A-C Bramhagen, M Virtanen, MA Siimesand I Axelsson
Aim: This study compared transferrin receptor (TfR) concentrations with iron parameters relative to a
child's intake of cow's milk and follow-on formula.
Methods: TfR, β-haemoglobin, serum ferritin and mean corpuscular volume (MCV) of red blood cells
were analysed in a study population of 263 children aged 2.5 y. The amounts of cow's milk and follow-on formula consumed were recorded.
Results: There was a significant difference in concentrations of TfR/log ferritin between children
whose milk intake was <500 ml and those with a milk intake ≥500 ml (p= 0.003). There were significantly higher values of TfR/log ferritin in children whose MCV of red blood cells was ≤75 fl than in those with >75 fl (p < 0.0001). The TfR concentrations were significantly lower after iron therapy than before treatment.
Conclusion: Higher concentrations of TfR were correlated with lower concentrations of haemoglobin
and MCV of red blood cells. Milk consumption increases the risk of a higher ratio of TfR/log ferritin. TfR concentrations were significantly lower after iron therapy.
There is evidence that the number of transferrin receptors (TfR) on the surface of a cell reflects the iron requirements of the cell and controls its rate of iron uptake from circulating diferric transferrin (1– 2). Higher concentrations of circulating TfR have been reported to provide a reliable indicator of iron-deficiency anaemia (IDA) (3), as well as tissue iron iron-deficiency in adolescents (4) and adults (5). The high sensitivity of TfR to iron deficiency, combined with the need for taking only a small blood sample, makes it a valuable parameter for the assessment of tissue iron needs in children (6). In addition, the identification of iron deficiency in anaemic patients suffering from chronic inflammatory disease is a common and difficult problem. In contrast to serum ferritin (S-ferritin), TfR
concentrations are not influenced by an infection (7).
The use of this measurement in the evaluation of iron status in children is limited by an inadequate knowledge of the physiological concentration of serum TfR in childhood. Some studies have described iron status and the mean concentrations of TfR at various ages (4, 7–10). Unfortunately, the methods used differ widely and yield different concentrations. Yeung and Zlotkin found the mean concentration of TfR to be 4.4 mg l-1 in healthy infants ages 9–15 mo (10). However, there was no statistical
relationship found between TfR concentration and either haemoglobin (Hb) or S-ferritin. A study by Persson et al. analysed iron status in 76 healthy 1-y-old full-term Swedish infants (8) and determined the mean value of TfR to be 3.8 mg l-1. They, too, found no correlation between TfR and Hb or S-ferritin.
Virtanen et al. calculated the mean concentration of TfR among children of the same age to be 7.8 mg l-1 (9). They concluded that the best predictors of serum TfR concentration were log serum ferritin (p < 0.0001) and serum iron (p = 0.004), with both factors showing inverse correlations.
Recently, two of the present authors have shown that iron deficiency has a prevalence of 10% among young children (n = 367) in southern Sweden today (11). In this group the intake of cow’s milk was significantly higher among children with iron deficiency than among iron-sufficient children. Blood was also obtained for later analysis of TfR. The aims of the current study were (i) to compare serum
2 TfR with other iron status parameters, (ii) to measure TfR before and after iron therapy, and (iii) to determine whether these results can be correlated with a child’s daily intake of cow’s milk or follow-on formula.
Patients and methods
Study population
Malmö is a city on the south-western coast of Sweden with a population of about 250000. It has 19 Child Welfare Centres which provide universal healthcare for families. In 1995, the nurses at each of the centres were asked to assist in recruiting 2.5-y-old children (those born between 1 July 1992 and 30 June 1993) for the present study. Although Sweden’s basic healthcare programme recommends routine check-ups for children of this age (2.5 y ± 1 mo), not all (n = 3004 live births recorded during that period) were actually brought in for such an examination. Of those who were, 1287 children ultimately received an invitation to participate in the TfR study, which also included screening for coeliac disease. Both oral and written information about the nature and purpose of the investigation was given to parents, along with the assurance that all results would be kept confidential. A total of 690 families agreed that their child could participate. Blood for coeliac disease screening was given priority, leaving only enough blood for the analysis of TfR in 263 children. Nurses at each Child Welfare Centre took a 3 d dietary inventory, by asking the parent to estimate the mean intake of the amount of cow’s milk and follow-on formula consumed by each child. An invitation for a blood test at the hospital was then posted to each child.
The study population was recruited from 17 Child Welfare Centres. This resulted in some
overrepresentation from centres in more affluent socioeconomic areas. The gender distribution was about equal (M 51%, F 49%).
Inclusion criteria were: 2.5 y (±1 mo), absence of infection at the time of blood sampling, C-reactive protein (CRP) < 9 mg l-1, no clinical signs of infection 1 wk before testing, and no chronic diseases that may affect iron status.
Blood sampling and laboratory analyses
Capillary blood samples were obtained for analysis of Hb, S-ferritin, CRP and serum TfR as a primary screening. CRP was analysed to exclude children with infections who may have yielded false high S-ferritin values. If Hb was <110 g l-1 or if S-ferritin was <20 µg l-1, the child received a new invitation for further blood samples for a second screening. These blood samples were taken before 10.00 h. Blood was analysed for serum iron (S-Fe), total iron binding capacity (TIBC), mean corpuscular volume (MCV) and mean cell haemoglobin concentration (MCHC). Iron deficiency was defined as either an S-ferritin concentration <12 µg l-1 in combination with one abnormal test of either MCV (≤75 fl), S-Fe (<10 µmol l-1) or transferrin saturation (<10%); or an S-ferritin concentration in the range of 12–19 µg l-1 after combining two abnormal tests from among MCV, S-Fe or transferrin saturation. IDA was defined as Hb concentrations <110 g l-1 together with iron deficiency (12–14). If low Hb was found in cases where MCV alone was depressed, thalassaemia was excluded. One child diagnosed as having thalassaemia was subsequently excluded from the study. Where iron deficiency was diagnosed, iron therapy with ferrous succinate was given twice daily for 3 mo in 5 ml doses, each containing 3.7 mg of Fe2+ ml-1. The outcome was monitored by a blood sample taken at the end of the therapeutic course. Haematological parameters were measured on a Coulter STKS cell counter (Coulter Instruments, Fullerton, CA, USA). S-Fe and TIBC were analysed on a Technicon DAX 48 autoanalyser (Technicon Instruments, Tarrytown, NY, USA). S-ferritin was analysed using a Technicon Immuno I instrument, calibrated with Technicon SET point calibrators. Serum was separated immediately and frozen at -20 C until analysed. Serum TfR was measured with an enzyme-linked immunosorbent assay (Ramco Laboratories, Houston, TX, USA)(9). The intra-assay
3 concentrations; the interassay CVs were 6–9% at normal or high concentrations and 13–16% at low concentrations.
Statistical analysis
The statistical package used was Statview. Results are expressed as means, standard deviation (SD) and confidence interval (CI). Groups were compared by paired t-test, unpaired t-test, correlation test, Mann–Whitney test and analysis of variance (ANOVA). The figures for cow’s milk intake and S-ferritin were skewed and therefore subjected to logarithmic transformation.
Ethics
This study was approved by the ethics committee of the University of Lund. As noted earlier, informed consent on the basis of oral and written information about the project was secured from the parents of all participants.
Results
A total of 263 children participated in the study. No differences in TfR concentrations were found between boys and girls.
Transferrin receptors related to iron status
The mean concentration of TfR (n = 263) was 6.9 ± 1.6 mg l-1 (mean ± SD; 95% CI 6.7–7.1). There was a negative correlation between TfR and MCV (correlation coefficient r = -0.35, p = 0.0007). The group with MCV ≤75 fl had significantly higher concentrations of TfR than children with MCV >75 fl (p = 0.01). There were significantly higher values of TfR/log ferritin in children with MCV ≤75 fl than in those with MCV >75 fl (p = < 0.0001)
A cutoff value of ≥8.5 mg l-1 was chosen, in accordance with World Health Organization (WHO) recommendations for adults (15). TfR levels ≥8.5 mg l-1 were obtained in 38/263 children (14%); 16/263 (6%) had Hb <110 g l-1. There were significantly higher values for Hb (p = 0.01) and MCV (p = 0.005) in the group whose TfR concentrations were >8.5 mg l-1 than in those with TfR ≥8.5 mg l-1 (Table 1). In all, 10% of the children had iron deficiency and received iron therapy. Blood samples for TfR before and after therapy were obtained from eight children (Fig. 2). The mean concentration of TfR before iron therapy was 8.2 ± 1.3 mg l-1 (95% CI 7.3–9.2), compared with 6.9 ± 1.0 mg l-1 (95% CI 6.4–7.6) after therapy (p = 0.001). Significant differences in TfR/log ferritin were also found before and after therapy (p = 0.003). The ratios were 7.7 ± 2.6 and 4.8 ± 1.2, respectively.
Intake of cow’s milk and follow-on formula in relation to concentration of transferrin receptors
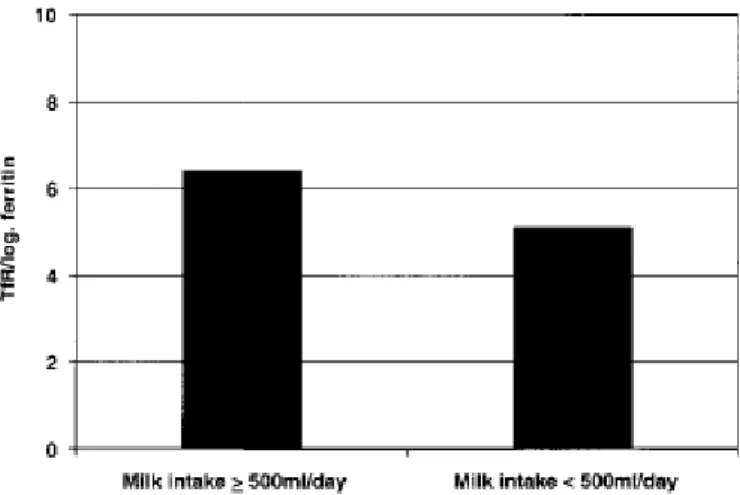
Information about the intake of cow’s milk and followon formula was obtained for 209/263 children (79%). As the distribution of milk intake was skewed, it was subjected to logarithmic transformation. There were no significant differences in milk intake when 8.5 mg l-1 was chosen as a cut-off value. There was a significant difference in concentrations of TfR/log ferritin between children whose milk intake was <500 ml and those with an intake ≥500 ml (p = 0.003) (Fig. 3). The ratios were 5.1 ± 1.4 and 6.4 ± 3.8, respectively. There were no significant differences with regard to the intake of follow-on formula between children with TfR <8.5 mg l-1 and those with TfR ≥8.5 mg l-1.
Discussion
This study described TfR concentrations among 263 healthy 2.5-y-old children in Malmö, Sweden, and compared the findings with other iron status parameters and types of milk consumption. Concentrations of TfR were also measured before and after iron therapy in eight children. Reliable laboratory measurements of iron status are important for detecting iron deficiency and assessing its magnitude. TfR has a high sensitivity to iron deficiency. This, combined with the need for only a small blood sample, makes it a useful parameter for assessing tissue iron requirements in infants (6).
4 Unfortunately, the methods used in different laboratories vary considerably, hence their reports
disagree, making it difficult to compare results. In a study by Virtanen et al. (9), which used the same method for TfR as the present study, 1-y-old children had a mean value of 7.8 mg l-1 (9). These children were given breast milk or follow-on formula until they were 12 mo old. The difference between the present study, which showed a mean value of 6.9 mg l-1, and the study by Virtanen et al. may be due to differences in age groups. To the authors’ knowledge, no other study has investigated TfR before and after iron therapy, or examined the question of a possible correlation between high values of TfR and a high intake of cow’s milk in this age group. The WHO has chosen 8.5 mg l-1 as a cut-off value for adults. TfR concentrations ≥8.5 mg l-1 were found in 14% of the children examined in this study, which in adults would have indicated iron need. According to the study criteria, only 10% were iron deficient, a figure that would have been higher if a value of TfR ≥8.5 mg l-1 alone had been used as an indicator of iron deficiency. The 2.5-y-old children in this study who received iron therapy exhibited significantly lower TfR values after therapy. This indicates that these children had a tissue need for iron. Both in this study and in the study by Virtanen et al. (9), a negative correlation appeared between TfR and MCV. Neither the present authors, Persson et al. (8) nor Yeung and Zlotkin (10) found any
correlation between TfR and S-ferritin. However, using multiple linear regression analysis, Virtanen et al. (9) found that the best predictors of serum TfR concentrations were log serum ferritin and S-Fe, with inverse correlations in both cases. A possible reason why Sferritin was not negatively correlated to TfR in the present study could be that S-ferritin increases in children with an infection, and even if the CRP level were normal and there were no clinical sign of an infection 1 wk before blood sampling, this could contribute to the result.
Domellöf et al. (16) studied TfR concentrations among iron-supplemented children from 4 to 9 mo of age, both in Honduras and in Sweden. They concluded that iron supplementation given from 6 to 9 mo of age significantly reduced the risk of IDA in a population with a high prevalence of IDA, but not in Sweden where the prevalence of IDA is lower. Their study also shown that TfR concentrations had decreased significantly in the iron-supplemented group compared with the placebo group, but only among the Honduras children. The effect on TfR was similar whether the children were iron supplemented from 4 mo or from 6 mo.
The children consuming fortified formula in the current study did not have significantly lower concentrations of TfR. However, since the content of their complementary food was unknown it is difficult to know the possible importance of fortified formula in the study group. Morley et al. (17) presented a randomized intervention study among 9–18-mo-old children concerning cow’s milk and different kinds of formula. They did not describe any results from blood analyses before the
intervention. The study did not find any significant differences in TfR concentrations among children fed unfortified formula or cow’s milk at 18 mo. This contrasts with results from the present group (11), which showed the frequency of iron deficiency to be lower among those consuming follow-on formula (11). There was a significant difference in concentrations of TfR/log ferritin between children whose milk intake was <500 ml and those whose intake was ≥500 ml. Upon randomization to one of three different feeding groups in the study by Morley, data were collected concerning feeding history and the parents were asked to complete a 2 d food diary. These data are presented by Singhal et al. (18). They describe the energy intake from the assigned milk but do not present the intake of meat, for example. Singhal et al. analysed blood obtained at the end of the study, when the children were 18 mo old. Therefore, a comparison before and after intervention is not possible. TfR concentrations did not differ in the three different feeding groups but it would have been interesting to know whether there had been a difference in TfR concentration, due to the intervention, from 9 to 18 mo.
The present study group consisted of 2.5-y-old children, who are assumed to eat a diet more similar to that of adults, but unfortunately only the amounts of cow’s milk and follow-on formula were known.
5 Therefore, a prospective study will be performed including children from 1 to 2.5 y, to describe what they really eat at 1, 1.5 and 2.5 y and how intake changes over time. There are some studies describing food intake in children up to 18 mo but after that age knowledge is lacking. As the third largest city in Sweden, Malmö has a great disparity between socioeconomic standards in different parts of the city. This study included children from a diversity of urban areas in Malmö. About 40% of the children in Malmö are classified as immigrants according to the Swedish National Registry, which defines an immigrant as having at least one parent born in another country. The proportion of immigrant children participating in the two studies was 32%, somewhat lower than in the whole of Malmö. The earlier study found 6% of Swedish children of native born parents to be iron deficient (they were
subsequently given iron therapy), compared with 18% of immigrant children (11). Immigrant children drank significantly more cow’s milk than did Swedish children. No difference in TfR concentrations was found between native and immigrant children. The results may have been different if the percentage of immigrants had been higher.
In conclusion, this study found significant differences in concentrations of TfR/log ferritin when comparing cow’s milk intake <500 ml with an intake of >500 ml (p = 0.003). There were significantly lower levels of TfR after iron therapy. In addition, the presence of higher concentrations of TfR was related to lower concentrations of Hb and MCV.
Fig. 1. Transferrin receptor (TfR)/log ferritin ratio among children with mean corpuscular volume (MCV) ≤75 fl compared
with those with MCV >75 fl (p = < 0.0001).
Data are shown as mean ± SD. aUnpaired t-test was used for comparison of groups. Hb: haemoglobin; S: serum; MCV: mean corpuscular volume; MCHC: mean cell haemoglobin concentration; Fe: iron; TIBC: total iron binding capacity; ns: not significant.
6 Fig. 2. Transferrin receptor (TfR) concentrations in children with iron deficiency (n = 8) before and after iron treatment (p =
0.001).
Fig. 3. Transferrin receptor (TfR)/log ferritin ratio in children with milk intake ≥500 ml d-1 compared with those with milk intake <500 ml d-1 (p = 0.003).
Acknowledgements.—This study was initiated by the Albert Påhlssons Foundation and the University Hospital Malmö,
7
References
1. Flowers CH, Skikne BS, Covell AM, Cook JD. The clinical measurement of serum transferrin receptor. J Lab Clin Med 1989; 114: 368–77
2. Punnonen K, Irjala K, Rajama¨ki A. Serum transferrin receptor and its ratio to serum ferritin in the diagnosis of iron deficiency. Blood 1997; 89: 1052–7
3. Kohgo Y, Niitsu Y, Kondo H, Kato J, Tsushima N, Sasaki K, et al. Serum transferrin receptor as a new index of erythropoeisis. Blood 1987; 70: 1955–8
4. Anttila R, Cook JD, Siimes MA. Body iron stores decrease in boys during pubertal
development: the transferrin receptor–ferritin ratio as an indicator of iron status. Pediatr Res 1997; 41:1–5
5. Skikne BS, Flowers CH, Cook JD. Serum transferrin receptor: a quantitative measure of tissue iron deficiency. Blood 1990; 75:1870–6
6. Kuiper-Kramer EPA, Bearts W, Baker R, van Eyck J, van Raan J, van Eijk HG. Evaluation of the iron status of the new-born by soluble transferrin receptors in serum. Clin Chem Lab Med 1998; 36: 17–21
7. Ferguson BJ, Skikne BS, Simpson KM, Baynes RD, Cook JD. Serum transferrin receptor distinguishes the anemia of chronic disease from iron deficiency anemia. J Lab Clin Med 1992; 119:385–90
8. Persson LÅ, Lundström M, Lönnerdahl B, Hernell O. Are weaning foods causing impaired iron and zinc status in 1-yearold Swedish infants? A cohort study. Acta Paediatr 1998; 87:618–22
9. Virtanen MA, Viinikka LU, Virtanen MKG, Svahn JCE, Anttila RM, Krusius T, et al. Higher concentrations of serum transferrin receptor in children than in adults. Am J Clin Nutr 1999; 69: 256–60
10. Yeung GS, Zlotkin SH. Percentile estimates for transferrin receptor in normal infants 9–15 mo. of age. Am J Clin Nutr 1997; 66: 342–6
11. Bramhagen A-C, Axelsson I. Iron status of children in southern Sweden: effects of cow’s milk and follow-on formula. Acta Paediatr 1999; 88: 1333–7
12. Oski FA. Iron deficiency in infancy and childhood. N Engl J Med 1993; 329: 190–3 13. Fomon SJ, Iron. In: Fomon SJ, editor. Nutrition of normal infants. St Louis, MO: Mosby;
1993
14. World Health Organization. Nutritional Anemia. WHO Technical Report Series, No. 503. Geneva: WHO; 1972
15. WHO/UNICEF/UNU Expert Consultation. Draft report on prevention of iron deficiency and anemia program. Geneva:
1. WHO; 1994
16. Domellöf M, Cohen RJ, Dewey KG, Hernell O, Riviera LL, Lönnerdal B. Iron
supplementation of breast-fed Honduran and Swedish infants from 4 to 9 months of age. J Pediatr 2001; 138:679–87
17. Morley R, Abbott R, Fairweather-Tait S, MacFadyen U, Stephenson T, Lucas A. Iron fortified follow on formula from 9 to 18 months improves iron status but not development or growth: a randomised trial. Arch Dis Child 1999; 81: 247–52
18. Singhal A, Morley R, Abbott R, Fairweather-Tait S, Stephenson T, Lucas A. Clinical safety of iron-fortified formulas. Pediatrics 2000; 105(3)e38