CIVIL & ENVIRONMENTAL ENGINEERING | RESEARCH ARTICLE
Heat cost allocation in energy efficient
multi-apartment buildings
Simon Siggelsten1*
Abstract: The purpose of this study is to analyse the accuracy of allocating heat
cost by measuring the delivered amount of heat in an energy-efficient
multi-apart-ment building with underfloor heating. The main issue with heat cost allocation
is heat transfer between adjacent apartments, which means that purchased heat
might not be the same as the used heat in an apartment. This study analyses the
fluctuation of the energy consumption in 31 apartments during a time span of one
month over four years. The fluctuation is presented as the standard deviation of
the spreading. Most of the apartments show a large fluctuation, with the average
standard deviation measuring at 3.47 kWh/m
2. However, when examining the entire
building as a complete unit, the standard deviation only amounts to 0.13 kWh/m
2.
The result indicates significant heat transfer between adjacent apartments.
Subjects: Heat Transfer; Heating Ventilation & Air Conditioning; Environmental Politics Keywords: heat transfer; EU directive 2012/27/EU; energy efficiency guideline1. Introduction
With EU directive 2012/27/EU, the European commission is putting pressure on member countries to implement individual metering and charging (IMC) of energy consumption in multi-apartment build-ings. With IMC, each apartment is only required to pay for its own consumption, and this should lead to an awareness of costs and reduced consumption. However, thus far, only a few member countries have implemented IMC on a large scale (e.g. Germany and Denmark). Sweden has recently imple-mented a new law regarding energy measurement in buildings (SFS 2014:267, 2014), which was to take effect on 1 June 2016 for heat and hot water in newly constructed multi-apartment buildings. However, according to EU directive 2012/27/EU, there is an exception in the law which stipulates that IMC can only be installed if it has been assessed as technically feasible and cost-efficient. As a *Corresponding author: Simon
Siggelsten, Urban Studies, Malmö University, Malmö 20506, Sweden E-mail: simon.siggelsten@mah.se Reviewing editor:
Zafar Said, University of Sharjah, United Arab Emirates
Additional information is available at the end of the article
ABOUT THE AUTHOR
Simon Siggelsten has a PhD in Engineering and he is working as a senior lecture at Malmö University, Sweden. His main field of research is about individual metering and charging of heat and hot water in multi-apartment buildings. Other research questions of interest are about energy efficiency of the housing stock. He teaches in subjects such as heating, ventilation and indoor environment.
PUBLIC INTEREST STATEMENT
The main issue with heat cost allocation is heat transfer between adjacent apartments, which means that purchased heat might not be the same as the used heat in an apartment. The purpose of this study is to analyse the accuracy of one kind of heat cost allocation in an existing energy-efficient multi-apartment building with underfloor heating. The methodology is to analyse the fluctuation of the purchased amount of energy to heat each apartment, over a time span of four years. The results show a relatively high amount of fluctuation in the apartments, in comparison to the whole building. The conclusion is that the fluctuations are due to heat transfer between adjacent apartments.
Received: 24 October 2017 Accepted: 06 February 2018 First Published: 10 February 2018
result, the Swedish government assigned Boverket (The National Board of Housing, Building and Planning) to investigate whether it is or not.
In October 2014, Boverket delivered the verdict for IMC in newly constructed and renovated build-ings in Sweden. Based on a comprehensive investigation, Boverket (2014) suggests that IMC is not required for heat nor hot water. In September 2015, Boverket delivered the second verdict with the same result as before, but this time, it was in regard to existing buildings (Boverket, 2015). The IMC of heat and hot water are assessed as non-cost-efficient in Sweden. The Swedish government has accepted their assessment and will not introduce a new regulation for IMC. However, Boverket have been instructed to monitor if conditions change (Government Office of Sweden, 2016).
Along with the discussion about cost-efficiency, another discussion about fair heat cost allocation has arisen. When measuring the amount of heat delivered to an apartment (which is advocated by the European Parliament), the main issue is heat transfer between adjacent apartments (Siggelsten,
2015). If there is a lack of insulation, heat will leak from apartments with a higher indoor tempera-ture to those with lower temperatempera-tures. This may cause a situation where apartments gain all or al-most all of their heating from neighbours, which can be perceived as unfair (Siggelsten, 2014). However, it can also be perceived as unfair to determine heating costs by only looking at the total area of the space.
The European Commission DG ENERGY has commissioned Empirica, a research and consulting firm in Bonn, Germany, to analyse what is the best practice across Europe regarding individual me-tering for heating (Robinson & Vogt, 2016). Five workshops were held in total in Sweden, Spain, Netherlands, Germany and Poland. In December 2016, Empirica published a guideline with the pur-pose “to support Member State authorities and building owners in correctly and effectively imple-menting certain provisions of Articles 9–11 of Directive 2012/27/EU on energy efficiency (“EED”) concerning the consumption of thermal energy for heating, cooling and hot water in multi-apart-ment and multi-purpose buildings”.
1.1. Problematizing
Article 9 of Directive 2012/27/EU is likely to be interpreted in different ways. The article calls for measuring the consumption of heat. However, an individual meter only measures the amount of heating energy delivered to an apartment, and an individual heat cost allocator only measures the amount of heating energy emitted from the radiators. Because heat leaks between adjacent apart-ments, the actual consumption of heat can both be higher and lower depending on the indoor tem-perature of the neighbouring apartments. However, could it be that the amount of heat leaking between adjacent apartments is so significant that we cannot measure the actual consumption of heat? One can debate this question in two ways:
(1) If we measure something, we should do it correctly within close tolerances.
(2) We accept wider tolerances with the argument that it is better than not measuring at all. Denmark is one of few countries in the European Union that adopted IMC at an early stage. By 1945, Denmark had 600,000 heat cost allocators installed (Boverket, 2015). Their rules and regulations for IMC were updated in 2014 and are now based on Directive 2012/27/EU, which considers cost effi-ciency and technical feasibility (Trafik- og Byggestyrelsen, 2015). Moreover, rules and regulations have been introduced to motivate lower consumption, and according to their guidance for IMC, the average savings with IMC for heat is about 10 percent (Trafik- og Byggestyrelsen, 2015). In the guid-ance, no advice against IMC is found regarding having underfloor heating. However, there is advice for using an allocation key (correction factors) based on the location of the apartment within the building (e.g. a reduction of the measured amount of heat if the apartment is located in a gable or above an unheated parking garage).
In the guidelines set by Empirica (Robinson & Vogt, 2016), there is a recommendation against IMC for heat when one has underfloor heating. Chapter 3.2, “Technical Feasibility”, explains further:
There are some further special cases for which heat meters and heat cost allocators cannot be expected to deliver a reliable measurement of heat flow – such as where heat exchangers are built into the ceiling of one unit and also heat the floor of the unit above, or into building walls with similar effect. No reliable system is available to subdivide the heat flow into a flow upward and downward, so buildings with heating systems of this kind can be declared an exempted building class.
Regardless of a recommendation or not, it would be interesting to see figures for the heat transport between adjacent apartments with underfloor heating. Depending on the size of the heat trans-ports, it could strengthen or weaken one’s opinion.
1.2. Purpose and objective
The purpose of this study is to analyse the accuracy of allocating heat cost by measuring the deliv-ered amount of heat in an energy-efficient multi-apartment building with underfloor heating. The objective is to contribute with conclusions to the ongoing discussion about IMCs and whether they should or should not be used within the European Union, where the number of energy-efficient multi-apartment buildings is rapidly increasing. The study is delimitated to only one building con-taining 31 apartments located in southern Sweden.
2. Previous studies
The fact that heat leaks between adjacent apartments is the main issue when allocating heat cost based on consumption. Siggelsten (2014) shows how it is possible for an apartment located in the middle of a building to gain almost all its heating needs from neighbouring apartments. However, the study also presents a method for estimating the amount of heat leaked between adjacent apart-ments. The method was tested on an existing multi-apartment building with 16 apartments with a high standard of insulation. The principle of the method is to estimate the gap between the energy purchased and the energy needed to maintain a certain indoor temperature. The indoor tempera-ture can be estimated by iteration, by knowing the thermal resistance between the apartments as well as the thermal resistance of the building envelope. The method needs to be developed further but could be used for reducing measurement error due to heat transfers.
According to Michnikowski (2017), a possible development of the aforementioned method could be to use indoor temperature readings from heat cost allocators. A heat cost allocator has two tem-perature sensors: One is used to register the surface temtem-perature of the radiator and the other is used to register the temperature in the room. By using the logged temperatures, an average indoor temperature can be established for each apartment during a heating season. Further, with the in-door temperatures, it is possible amend each individual apartment’s heat consumption.
Heat transfer between adjacent apartments is not the only issue when allocating heat cost based on consumption. In a study made by Siggelsten, Nordquist, and Olander (2014), it was found that internal heat production, the location of the apartment within the building, and the insulation stand-ard of the building envelope were all significant factors affecting the accuracy of heat cost alloca-tion. The significance of the location of the apartment in relation to the insulation standard has also been shown by Ling, Li, and Xing (2015).
As mentioned, correction factors based on the location of the apartment within the building can be used as a way to compensate for the greater need for heat. According to Siggelsten and Olander (2013), compensation factors could be necessary when installing IMC in an existing building. They state,
This could be necessary when installing IMC in an existing building. Otherwise the market value for an unfavourably located apartment could drop overnight because of increased heating costs. A gable apartment can certainly have a higher market value compared to an apartment in the centre of the building, but the owners have already paid for that when they bought the apartment. However, if it is a new built multi-apartment building, the prospective buyers should know about the conditions and therefore the price for a gable should be adjusted after these conditions. In this case a conversion system would not be needed.
Ziemele, Pakere, Blumberga, and Zogla (2015) conducted a study in a newly built apartment building in Riga with 168 apartments with the purpose of investigating the possibility to achieve a fair heat cost allocation. The specific building used 72 kWh/m2 and year on average for space heating. The study showed that the heat gain from uncovered heat riser pipes varied in the apartments between 4.1 percent and 22.5 percent. These heat gains are important and should be taken into account when applying heat allocators, especially in energy-efficient buildings.
3. Methodology
A lowered indoor temperature should imply a reduced need for purchased heat not only due to the changed temperature but also due to an increased heat gain from the neighbours (if the neighbours have a higher indoor temperature, otherwise, the heat loss to the neighbours will instead be re-duced). This means a lever effect occurs when changing the indoor temperature in a multi-apart-ment building (Siggelsten, 2014). If you can lower the temperature setting and yet the indoor temperature remains the same, it implies that the reduced heat from your radiators are being fully compensated by your neighbours.
For this study, input data has been collected from an existing multi-apartment building located in Malmö, Sweden. The building was completed in 2012 and it contains 31 individual apartments, all with underfloor heating. It is a relatively energy-efficient building with a heating energy perfor-mance of 40 kWh/m2, (stairwells and basement included). The methodology for this study is to ana-lyse the fluctuation of the purchased amount of energy to heat each apartment. This is accomplished by calculating the standard deviation of the energy use during the month of January over four years (2013–2016).
3.1. Purchased energy
All apartments in the building are equipped with individual heat meters, cold and hot water meters and meters for domestic electricity. The heat meters are connected to the underfloor heating sys-tem. They measure flow and temperature difference of the heat circuit water in kilowatt-hours. The basis for the purchased energy includes the reading from the heat meter along with 70 percent of the domestic electricity reading, also in kilowatt-hours. The reason for not using the whole amount of domestic electricity is that approximately 30 percent will not come to use as internal heat (e.g. heat losses to the kitchen flue while cooking). Readings from the cold and hot water meters are not included in this study.
3.2. Framework for the analysis
Standard deviation is used in statistics and is a measure of how spread-out the numbers are. A low value indicates that the data tends to be close to the mean, while a high value indicates that the data are spread out over a wide range. If an apartment uses a similar amount of energy for each period, the standard deviation will be shown as a low number. Consequently, if there is large spread-ing of the amount of energy for each period, the standard deviation will be shown as a high number. So, what is a low or a high number? That is relative, but all the numbers will be analysed and com-pared with the entire building, and the presumption is that a high standard deviation is due to heat transfer between adjacent apartments. A significant deviation of the spreading between the indi-vidual apartments and the entire building should indicate an equation of the heat within the building envelope.
As mentioned, four different periods (months) have been selected for the analysis – the month of January between 2013–2016. The choice of January was made for obtaining as distinct a result as possible with the conditions given. In January, there is a large difference between indoor and out-door temperatures, with little influence from solar radiation. According to the Swedish Meteorological and Hydrological Institute (SMHI), about twice as many hours of sunshine occurs in Malmö in February (about 60 h) compared to January (about 30 h) during a normal year. In December, ap-proximately 30 h of sunshine occurs in Malmö; however, December is not a suitable month for this study because the Christmas holidays may result in periods of empty apartments and/or periods with abnormal internal heat production. All input data for the delivered amount of heat has been cor-rected for a normal meteorological month based on their number of degree days. Given that internal heat production has a large impact on energy-efficient buildings, the measured data of domestic
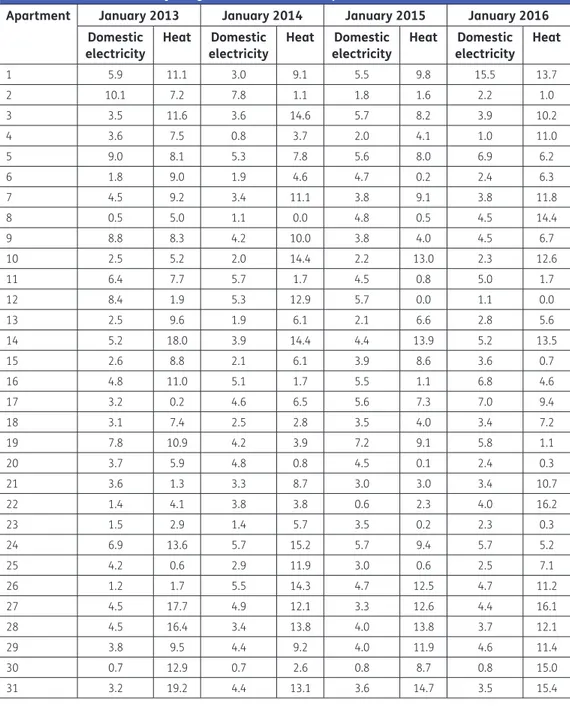
Table 1. Heat and electricity usage (kWh/m2) for each apartment
Apartment January 2013 January 2014 January 2015 January 2016 Domestic
electricity Heat electricityDomestic Heat electricityDomestic Heat electricityDomestic Heat
1 5.9 11.1 3.0 9.1 5.5 9.8 15.5 13.7 2 10.1 7.2 7.8 1.1 1.8 1.6 2.2 1.0 3 3.5 11.6 3.6 14.6 5.7 8.2 3.9 10.2 4 3.6 7.5 0.8 3.7 2.0 4.1 1.0 11.0 5 9.0 8.1 5.3 7.8 5.6 8.0 6.9 6.2 6 1.8 9.0 1.9 4.6 4.7 0.2 2.4 6.3 7 4.5 9.2 3.4 11.1 3.8 9.1 3.8 11.8 8 0.5 5.0 1.1 0.0 4.8 0.5 4.5 14.4 9 8.8 8.3 4.2 10.0 3.8 4.0 4.5 6.7 10 2.5 5.2 2.0 14.4 2.2 13.0 2.3 12.6 11 6.4 7.7 5.7 1.7 4.5 0.8 5.0 1.7 12 8.4 1.9 5.3 12.9 5.7 0.0 1.1 0.0 13 2.5 9.6 1.9 6.1 2.1 6.6 2.8 5.6 14 5.2 18.0 3.9 14.4 4.4 13.9 5.2 13.5 15 2.6 8.8 2.1 6.1 3.9 8.6 3.6 0.7 16 4.8 11.0 5.1 1.7 5.5 1.1 6.8 4.6 17 3.2 0.2 4.6 6.5 5.6 7.3 7.0 9.4 18 3.1 7.4 2.5 2.8 3.5 4.0 3.4 7.2 19 7.8 10.9 4.2 3.9 7.2 9.1 5.8 1.1 20 3.7 5.9 4.8 0.8 4.5 0.1 2.4 0.3 21 3.6 1.3 3.3 8.7 3.0 3.0 3.4 10.7 22 1.4 4.1 3.8 3.8 0.6 2.3 4.0 16.2 23 1.5 2.9 1.4 5.7 3.5 0.2 2.3 0.3 24 6.9 13.6 5.7 15.2 5.7 9.4 5.7 5.2 25 4.2 0.6 2.9 11.9 3.0 0.6 2.5 7.1 26 1.2 1.7 5.5 14.3 4.7 12.5 4.7 11.2 27 4.5 17.7 4.9 12.1 3.3 12.6 4.4 16.1 28 4.5 16.4 3.4 13.8 4.0 13.8 3.7 12.1 29 3.8 9.5 4.4 9.2 4.0 11.9 4.6 11.4 30 0.7 12.9 0.7 2.6 0.8 8.7 0.8 15.0 31 3.2 19.2 4.4 13.1 3.6 14.7 3.5 15.4
Each apartment in this study has its own separate ventilation system with a separate heat ex-changer, which should strengthen the result from this study. If there was a common ventilation system, some of the heat transport between adjacent apartments might come via the heat recovery system and the ventilation air.
3.3. Input data
This section presents the input data for each apartment. However, due to integrity reasons, all fig-ures are presented in kWh/m2 instead of presenting full figures and each apartment’s living space (Table 1). In that order, it should not be possible for third parties to identify individual apartments and consequently the residents should not feel appointed. For the same reason, a cross-sectional drawing is not provided.
The total heat usage and the domestic electricity for all apartments are shown in Table 2. The heat for the common spaces were provided in megawatt-hours with only one decimal accuracy.
In Table 3, the number of degree days are shown for each month. The degree days are the product of multiplying the difference between the average outdoor temperature and the base temperature with the amount of days. The base temperature is an estimation and should be equivalent to the temperature at which the purchased heat and the domestic electricity heats the apartments with the conditions given. Solar radiation and body heat gain are also thought to raise the temperature additionally. The base temperature differs between the different months of the year.
The energy consumption is calculated by adding the heat with 70 percent of the domestic electric-ity and thereafter multiplying with the quota between the degree days. If the month was colder than normal, the energy consumption is reduced to match a normal year (and vice versa). See, for exam-ple, apartment 1 and January 2013:
(11.1 + 0.7 ∗ 5.9) ∗
641.7
647.9
= 15.1 kWh∕m
2 Table 2. Heat and electricity usage (kWh)
Period Heat – All apartments Domestic electricity – All
apartments Heat – Common spaces
January 2013 22,806 11,113 8,300
January 2014 21,626 9,650 6,000
January 2015 17,441 10,337 6,400
January 2016 22,050 10,742 Not available
Table 3. The amount of degree days
Period Days Average temp. (°C) Base temp. (°C) Degree days
January normal 31 −0.7 20 641.7
January 2013 31 −0.9 20 647.9
January 2014 31 1.3 20 579.7
January 2015 31 3.0 20 527.0
4. Results
The fluctuation of the energy consumption between the four different years is high in almost all apartments, as shown in Figure 1 and Table 4. Only a few apartments show a steady consumption. Apartment 7 is the steadiest one with a standard deviation of the fluctuation of 1.21 kWh/m2. Apartment 26 is the one with the greatest fluctuation, with a standard deviation of 8.08 kWh/m2. The averages, as shown in Tables 4 and 5, are weighted means in regard to the apartment’s space area.
In Table 5, the apartments are divided into different categories depending on their location in the building. Apartments 1–8 are located on the first floor, while apartments 1–6 have a basement be-low and apartments 7 and 8 have a parking garage bebe-low. Apartments 26–31 are located on the top floor, while apartments 28 and 31 are also located on each gable. The other gable apartments which are located on the other floors are apartments 1, 6, 9, 12, 15, 18, 22 and 25.
The figures in Table 3 can be compared with the fluctuation for the entire building, which is pre-sented in Table 6. The fluctuation is significantly smaller for the entire building compared to the in-dividual apartments and is even smaller when including domestic electricity. For example, the standard deviation of the difference in purchased energy for the entire building, including all apart-ments, stairwells and basement is 0.13 kWh/m2. This can be compared with the average standard deviation for all apartments, which is 3.47 kWh/m2.
5. Analysis and discussion
The presumption is that the high amount of standard deviation is due to heat transfer between ad-jacent apartments. If someone for any reason changes the temperature setting on the thermostats in their apartment, then one could assume that the energy consumption will change not only for the actual apartment but also for the entire building. The same theory should also apply if the amount of internal heat production changes. In this study, we do not actually know if anyone changed the temperature settings or if the amount of internal heat production had changed. However, with 31 apartments and an investigation with a time span of four years, it is not far-fetched to think so. If no one changed any settings, then the result is astonishing considering the large fluctuation of energy consumption in most of the apartments. Most of the fluctuation will not depend on solar radiation, as there is not much solar radiation in Sweden during January and the domestic electricity has also been taken into account in the result. However, the energy consumption for the investigated building is substantially stable, as shown in Table 6. Looking at the entire building including all apartments, basement and stairwells and including both heating and domestic electrical energy, the standard Figure 1. Energy consumption
deviation of the fluctuation is only 0.13 kWh/m2 between 2013–2015. This should mean that a change in temperature setting would not result in much of a difference in energy consumption for the entire building. Instead, a change of setting would likely be compensated with heat transfer to/
Table 4. Energy consumption for each apartment (kWh/m2) and the standard deviation Apartment January 2013 January 2014 January 2015 January 2016 Std. dev.
1 15.1 12.4 16.6 24.9 4.67 2 14.1 7.3 3.5 2.6 4.53 3 13.9 19.0 14.8 13.1 2.27 4 9.9 4.8 6.7 11.9 2.75 5 14.3 12.8 14.6 11.2 1.35 6 10.2 6.5 4.2 8.1 2.20 7 12.3 14.9 14.3 14.7 1.03 8 5.3 0.8 4.8 17.8 6.38 9 14.3 14.3 8.2 10.0 2.68 10 6.8 17.5 17.7 14.4 4.41 11 12.1 6.3 4.8 5.2 2.94 12 7.7 18.4 4.9 0.8 6.51 13 11.2 8.2 9.9 7.7 1.39 14 21.4 19.0 20.7 17.4 1.55 15 10.5 8.4 13.9 3.3 3.84 16 14.3 5.8 6.0 9.6 3.45 17 2.4 10.8 13.7 14.5 4.79 18 9.5 5.1 7.9 9.7 1.84 19 16.3 7.5 17.2 5.2 5.27 20 8.4 4.6 4.0 2.0 2.32 21 3.8 12.1 6.2 13.3 3.97 22 5.1 7.1 3.3 19.2 6.22 23 3.9 7.4 3.2 1.9 2.04 24 18.3 21.3 16.2 9.3 4.42 25 3.5 15.4 3.2 9.0 4.97 26 2.5 20.0 19.2 14.7 7.00 27 20.7 17.2 18.1 19.4 1.32 28 19.4 17.8 20.2 14.9 2.03 29 12.0 13.6 18.0 14.8 2.20 30 13.3 3.4 11.3 15.8 4.64 31 21.2 17.8 20.9 18.1 1.56 Average 11.4 11.8 11.3 11.3 3.47
Table 5. Average standard deviation (kWh/m2) for each category
Apartment category Average std. dev.
Gable 3.60
Gable and top floor 1.79
Top floor 2.99
Middle 3.38
from adjacent apartments. In each individual apartment, the fluctuation is significantly larger. The average standard deviation of the fluctuation in all apartments is a remarkable 3.47 kWh/m2 between 2013–2016. The difference in dispersion for the entire building compared to each apart-ment should be able to be used as a good assessapart-ment of the heat transfer, and in turn, a good as-sessment of the IMC accuracy.
One could assume that an apartment with a small amount of surface area to adjacent apart-ments should have a smaller fluctuation of energy consumption compare to an apartment with a larger amount. That is also the case for the two apartments (28 and 31) located on each gable on the top floor. They had the smallest fluctuation, with a standard deviation of 1.79 kWh/m2. However, the apartments located in the middle of the building, with the largest amount of surface to adjacent apartments, do not have the highest fluctuation. From this, we might assume that the heat transfers could also be related to a significant extent to the behaviour of the residents. A small change of temperature setting or a change of residents can make a big difference of heat consumption due to the lever effect.
Heat transfer between adjacent apartments reflects that IMC is inaccurate due to the possibility to obtain heat, but it is heat which is paid for by neighbours. With a large amount of heat transfer between adjacent apartments, there should be a significant larger fluctuation of the energy con-sumption in each individual apartment in comparison with the entire building, which also has been shown in this study. The building’s envelope is well-insulated with the purpose of keeping the heat inside. The apartments’ dividing walls and slabs are made of concrete, which is a good heat conduc-tor. This should result in a relatively homogeneous temperature among all the apartments. However, an exception could be the apartments with a large exterior surface area (e.g. it is located at the top floor and/or at a gable).
6. Conclusions
Despite a time span of four years (three years for the entire building), hardly any fluctuation in the energy consumption for the entire building occurred. However, on the individual apartment level, a remarkably large fluctuation has been observed. The main reason for this fluctuation is assumed to be heat transfer between adjacent apartments thus indicating an inaccuracy with IMC. The main conclusion of this study is that you cannot use IMC as a general argument for achieving a fair heat cost allocation. Instead, one can discuss whether IMC is more or less inaccurate than allocation based on space area.
Finally, this study addresses two additional questions:
• What tolerances on the accuracy can we accept when allocating heat costs? • Is it worth a wide tolerance to achieve energy savings?
Table 6. Purchased energy (kWh/m2)
January in year Heat (only) Heat and domestic electricity Entire building All apartments Entire building All apartments
2013 11.55 8.5 14.5 11.4
2014 11.70 9.2 14.3 11.8
2015 11.32 8.3 14.2 11.3
2016 Not available 8.4 Not available 11.3
© 2018 The Author(s). This open access article is distributed under a Creative Commons Attribution (CC-BY) 4.0 license. You are free to:
Share — copy and redistribute the material in any medium or format
Adapt — remix, transform, and build upon the material for any purpose, even commercially. The licensor cannot revoke these freedoms as long as you follow the license terms. Under the following terms:
Attribution — You must give appropriate credit, provide a link to the license, and indicate if changes were made. You may do so in any reasonable manner, but not in any way that suggests the licensor endorses you or your use. No additional restrictions
You may not apply legal terms or technological measures that legally restrict others from doing anything the license permits.
Cogent Engineering (ISSN: 2331-1916) is published by Cogent OA, part of Taylor & Francis Group.
Publishing with Cogent OA ensures:
• Immediate, universal access to your article on publication
• High visibility and discoverability via the Cogent OA website as well as Taylor & Francis Online • Download and citation statistics for your article
• Rapid online publication
• Input from, and dialog with, expert editors and editorial boards • Retention of full copyright of your article
• Guaranteed legacy preservation of your article
• Discounts and waivers for authors in developing regions
Submit your manuscript to a Cogent OA journal at www.CogentOA.com Funding
The authors received no direct funding for this research. Author details
Simon Siggelsten1
E-mail: simon.siggelsten@mah.se
1 Urban Studies, Malmö University, Malmö 20506, Sweden.
Citation information
Cite this article as: Heat cost allocation in energy efficient multi-apartment buildings, Simon Siggelsten, Cogent Engineering (2018), 5: 1438728.
References
Boverket. (2014). Individuell mätning och debitering vid ny- och ombyggnad. Karlskrona: Author. ISBN pdf: 978-91-7563-174-5 (In Swedish).
Boverket. (2015). Individual metering and charging in existing buildings. Karlskrona: Author. ISBN pdf:
978-91-7563-338-1.
Government Office of Sweden. (2016). Retrieved from November 11, 2016, http://www.regeringen.se/ pressmeddelanden/2016/05/boverket-ska-pa-nytt-utreda-fragan-om-individuell-matning-i-lagenheter/ (In Swedish).
Ling, J., Li, Q., & Xing, J. (2015). The influence of apartment location on household spaceheating consumption in multi-apartment buildings. Energy and Buildings, 103, 185–197. https://doi.org/10.1016/j.enbuild.2015.06.057 Michnikowski, P. (2017). Allocation of heating costs with
consideration to energy transfer from adjacent
apartments. Energy and Buildings, 139, 224–231. https://doi.org/10.1016/j.enbuild.2017.01.020 Robinson, S., & Vogt, G. (2016). Guidelines for thermal energy
efficiency (MBIC (ENER/C3/2013-977)). Empirica GmbH - Communication and Technology Research.
SFS 2014:267. (2014). Lag om energimätning i byggnader. Stockholm: Miljö- och energidepartementet (In Swedish). Siggelsten, S. (2014). Reallocation of heating costs due to
heat transfer between adjacent apartments. Energy and Buildings, 75, 256–263. https://doi.org/10.1016/j. enbuild.2014.02.022
Siggelsten, S. (2015). Individual metering and charging of heat and hot water in multi-apartment buildings. Lund: Lund University. ISBN pdf: 91-85257-10-9.
Siggelsten, S., Nordquist, B., & Olander, S. (2014). Analysis of the accuracy of individual heat metering and charging. Open House International, 39(2), 69–77.
Siggelsten, S., & Olander, S. (2013). Individual metering and charging of heat and hot water in Swedish housing cooperatives. Energy Policy, 61, 874–880. https://doi.org/10.1016/j.enpol.2013.06.083 Trafik- og Byggestyrelsen. (2015). Vejledning til
bekendtgørelse om individuel måling af el, gas, vand, varme og køling. Transport- og Bygningsministeriet. j.nr. BS0702-00001 (In Danish).
Ziemele, J., Pakere, I., Blumberga, D., & Zogla, G. (2015). Economy of heat cost allocation in apartment buildings. Energy Procedia, 72 87–94. International Scientific Conference “Environmental and Climate Technologies – CONECT 2014”, ScienceDirect, Elservier Ltd.