Brian J. Wienholdl
Todd P. Trooien2
ABSTRACT
Wetlands present in irrigated areas may be subject to groundwater discharge. The potential exists for contamination if these water inputs contain agricultural chemicals. Irrigation scheduling and fertilizer management are two aspects of irrigated crop management that influence the potential for nitrate (NO)
contamination of groundwater. Meteorological methods of scheduling irrigation are becoming more accessible to producers. These methods utilize weather data to estimate potential evapotranspiration (En and incorporate a crop coefficient to adjust for the water requirements of different crops and growth stages. Nitrogen fertilizer is the agricultural chemical used in the greatest quantities and is also the most commonly detected contaminant in ground waters. Efficient fertilizer management involves applying sufficient fertilizer to meet a yield goal with adjustments in the fertilizer rate for residual fertilizer N in the soil and additions in crop residue, manure, and irrigation water. We have been measuring com yield, internal drainage, and determining the fate of applied N in lysimeters at two sites in central North Dakota. Lysimeters were fertilized to 90 or 180 lbs N a·1 (100 or 200 kg N ha·l
) with the higher rate being the rate recommended for an optimum crop yield. Irrigation was applied such that precipitation plus irrigation equalled the calculated ET rate. Averaged over years, com receiving 180 lbs N a-I yielded 30% more dry matter; had a 40% greater N content; and derived 40% more N from fertilizer than com receiving 90 lbs N a·l
. The meteorological method estimated water use by the com crop receiving 180 lbs N a·1 well as only 6% of the applied water drained out of the root zone. In contrast, over 20% of the applied water drained out of the root zone of lysimeters receiving 90 lbs N a-I. Reduced growth of the under fertilized crop resulted in poor utilization of applied
Soil Scientist, USDA-ARS, Northern Great Plains Research Laboratory, tAandan, ND 58554
Research Agricultural Engineer, Kansas State University, Southwest Research-Extension Center, Garden City, KS 67846
USDA-ARS is an equal opportunity/affirmative action employer and all agency services are available without discrimination.
134 1996 USCID Wetlands Seminar
irrigation. Inadequate fertilization not only reduced yield but resulted in an increase in leaching potential of agricultural chemicals.
fNTRODUCTION
Water is the factor most limiting to crops in the semi-arid Northern Great Plains.
Precipitation is highly variable both in total amount and temporal distribution throughout the growing season. Supplemental irrigation is a management practice that can be used by producers to meet crop moisture needs during periods of below-normal precipitation or to grow crops that require more water than is normally available. Supplemental irrigation has been demonstrated to be economically feasible in areas of North Dakota (Leitch et aI., 1991) but remains underutilized by producers. Construction of a potato processing plant in Jamestown, ND and a corn processing plant in Wahpeton, ND are increasing the demand for stable sources of potatoes and corn. Irrigation is likely to expand as producers implement management practices that will help them meet contract obligations to these processing plants.
As irrigation increases, best management practices (BMP) will need to be developed and implemented to insure economic returns are realized and environmental impacts are minimized. Irrigation scheduling and fertilizer management are two areas where a number of BMP's exist. Irrigation scheduling can be used to provide water to meet crop needs and for salinity management in the root zone. Fertilizer management includes: soil sampling and testing; adjusting fertilizer inputs to account for nutrients added in crop residue, manure, and cover crops; and applying fertilizer in the proper form and at the proper time to optimize utilization by the crop and minimize losses due to leaching or surface runoff. However, interactions between management practices need to be
determined in order to develop improved management practices for efficient water use. Information concerning the effect of changes made in one management practice on efficacy of another management practice is lacking.
Meteorological methods of scheduling irrigation are becoming more accessible to producers. These methods utilize weather data collected at or near the irrigation site to calculate crop ET (e.g. Jensen et aI., 1970). An adjustment is usually made to account for different crops and growth stages (e.g. Lundstrom and Stegman, 1983). Adjustments for other management practices (e.g. fertility, residue management) are generally not available. The objective of the present paper is to evaluate the effect ofN fertility on internal drainage, the downward movement of water out of the root zone, from soils supporting corn grown under irrigation at two sites in central North Dakota.
METHODS
The study was conducted at two sites in central North Dakota; the Menoken township site (T139N, R78W, Sec. 19, SE 114) (Doering et al., 1986) and the Naughton township site (T140N, R79W, Sec. 35, SW 1/4) (Trooien and
Reichman, 1990). Soils at the Menoken site are Lihen sandy loam (sandy, mixed Entic Haploboroll), Roseglen loam (fine-loamy, mixed Pachic Haploboroll), and Parshall (coarse-loamy, mixed Pachic Haploboroll). These soils developed on aeolian-lacustrine sediments deposited over fine lacustrine sediments. Soil structure at the Menoken site is massive or single-grained and is similar
throughout the sampled profile. Soils at the Naughton site are Falkirk loam (fine-loamy, mixed Pachic Haploboroll) and Bowbells loam (fine-(fine-loamy, mixed Pachic Argiboroll). These soils developed on slope-worked alluvium deposited on glacial till. Soil structure at the Naughton site is weak to moderate coarse subangular blocky or prismatic in the surface layers and moderate to strong coarse subangular blocky to prismatic at lower depths. Soils at both sites are well drained.
Data collected from six nonweighing lysimeters at each site will be presented in this paper. Each lysimeter measured eight feet by eight feet (2.5 by 2.5 m) and extended seven feet (2.3 m) below the surface. A vertical plastic barrier was placed around each lysimeter to minimize water loss from the plot due to horizontal flow. The undisturbed lysimeters retained the natural drainage characteristics of the soil profile (Doering et aI., 1986; Trooien and Reichman, 1990). A neutron access tube was installed in the center of each lysimeter to facilitate water content measurements. Tensiometers were installed at depths of 3 (0.9 m), 4.4 (1.35 m), and 6.6 feet (2.00 m). The tensiometers were used to measure soil matric potentials and hydraulic gradients. Hydraulic conductivity was calculated using soil water potential at 6.6 feet and data from previous hydraulic calibrations (Doering et al., 1986; Trooien and Reichman, 1990). Drainage was calculated with Darcy's Law using the measured gradient between 4.4 and 6.6 feet (Trooien and Reichman, 1990).
Each lysimeter was planted to corn and irrigated such that precipitation plus irrigation equalled the calculated Jensen-Haise corn evapotranspiration (Jensen et aI., 1970; Lundstrom and Stegman, 1983). Water from the Heart River (a tributary of the Missouri River) was used for irrigation. Nitrogen fertility treatments were 90 and 180 Ibs a-I (100 and 200 kg ha- I). Nitrogen was applied such that fertilizer N plus soil inorganic N in the upper 2 feet (0.6 m) of the soil profile equalled the treatment rate. Nitrogen was applied as ammonium nitrate. Corn was harvested shortly after the first killing frost each fall. The plants were separated into leaves, stalks, and grain, oven dried, and weighed.
136 1996 USCID Wetlands Seminar
A study was conducted at the Menoken site from 1984-1989 to determine corn fertilizer N use efficiency, percent N derived from fertilizer, and fertilizer remaining in the root zone at the end of the growing season. Corn was grown in cylinders adjacent to the Iysimeters which received irrigation and N fertility treatments identical to the Iysimeters except that fertilizer N was enriched with
15N (Wienhold et ai., 1995). Soil and plant samples were digested for total
Kjeldahl N (Bremner and Mulvaney, 1982) and subsamples sent to Isotope Services in Los Alamos, NM (1984, 1985) and to the Nitrogen Isotope Laboratory, University of Nebraska, in Lincoln (1986-1988) for 15N analysis.
RESULTS
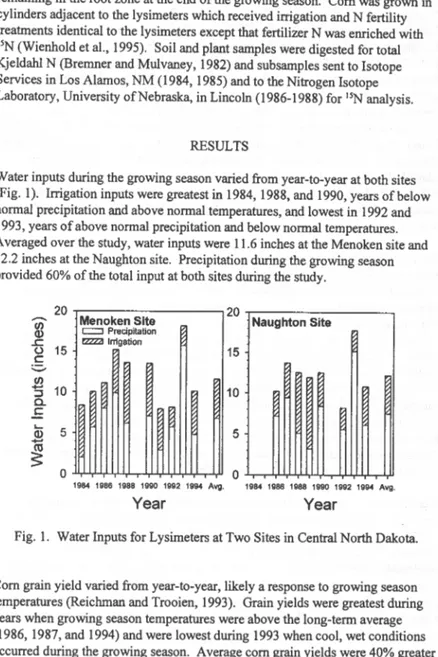
Water inputs during the growing season varied from year-to-year at both sites (Fig. 1). Irrigation inputs were greatest in 1984,1988, and 1990, years of below normal precipitation and above normal temperatures, and lowest in 1992 and 1993, years of above normal precipitation and below normal temperatures. Averaged over the study, water inputs were 11.6 inches at the Menoken site and 12.2 inches at the Naughton site. Precipitation during the growing season provided 60% of the total input at both sites during the study.
20 ~---,20 . , - - - , - Menoken Site
lfi
=
Precipitation ~ !'ZZZ2I Irrlgationo
15 Naughton Site 15 c:::..
.!B
~ 10 10a.
c
....
2
5 5~
1984 1986 1986 1990 1992 1994 Avg. 19114 1986 1986 1990 1992 199<4 Avg.Year
Year
Fig. 1. Water Inputs for Lysimeters at Two Sites in Central North Dakota.
Corn grain yield varied from year-to-year, likely a response to growing season temperatures (Reichman and Trooien, 1993). Grain yields were greatest during years when growing season temperatures were above the long-term average (1986, 1987, and 1994) and were lowest during 1993 when cool, wet conditions occurred during the growing season. Average corn grain yields were 40% greater
when adequate N was provided (2.5 tons a·l
) than when N fertility was less than optimum (1.6 ton a·l
) (Fig. 2). Com grain yields were similar and the response of
com grain yield to N-fertility was similar between the two sites. 4 Men oken Site c::J 9011>0 N ac·1 4
-
fZZ2I 180 Ibs N ac·1Naughton Site
..-Iro
3 3 (/) C 0 2...
2 ""-" c.i!!
~
C>
0 0~
1984 1986 1988 1990 1992 1994 Avg. 1984 1986 1988 1990 1992 1994 Avg.Year
Year
Fig. 2. Annual Com Grain Yield at Two N Fertility Levels at Two sites in Central North Dakota.
Aboveground com dry matter varied from year-to-year, likely a response to growing season temperatures (Reichman and Trooien, 1993). Above ground dry
matter was nearly 30% greater when adequate N was provided (6.6 ton a·l ) than
10 Menoken Sit ~ 901bsNac·1 10 Naughton Site
rzzza 180 lb. N ac· 1 8 6 4 2 1984 1986 1988 1990 1992 1994 Avg. 1984 1986 1988 1990 1992 1994 Avg.
Year
Year
Fig. 3. Annual Above Ground Dry Matter Production at Two N Fertility Levels at Two Sites in Central North Dakota.
138 1996 USCID.Wetlands Seminar
when·N fertility was less than optimum-(4.5 ton a·l
) (Fig. 3). Above ground dry
matter production and the response of corn dry matter production to·N-fertility was similar between the two sites.
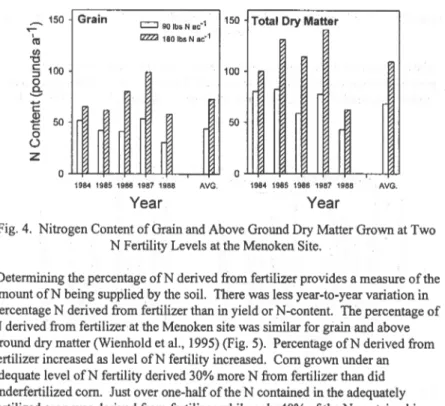
Nitrogen content in the grain increased as N-fertility level increased (Fig. 4). While there was year-to-year variation in N-content, grain grown under an adequate level ofN fertility averaged 40% more N (73 Ibs a·l) than did grain
grown under an inadequate level ofN fertility (44 Ibs a·l
) (Wienhold et aI., 1995). Grain N-content was greatest during years when temperatures' during the growing season were above the long-term average (1986 and 1987). Extremely high temperatures early in the 1988 growing season stunted the crop. Nitrogen content in above ground dry mattei eXhibited a pattern similar to that of grain. Dry matter N-content grown under adequate N fertility averaged 110 Ibs a·1
while that in dry matter gro~ under less than' optimum N fertility was 68 Ibs a·l. Sixty percent of
the N in the crop was present in the grain.
~ 150
..- Grain c:::J 90 lb. N ac·l 150 Total Dry Matter I (II t22Zl 180 lb. N ac·l C/) "0 c: 100 :::J 100 0
.s
c
~
50 50 0 () Z 0r
r
1984 1985 1986 1987 1988 AVG. 1984 1985 1986 1987 1988 AVG.Year
Year
Fig. 4. Nitrogen Content of Grain and Above Ground Dry Matter Grown at Two
N Fertility Levels at the Menoken Site. '
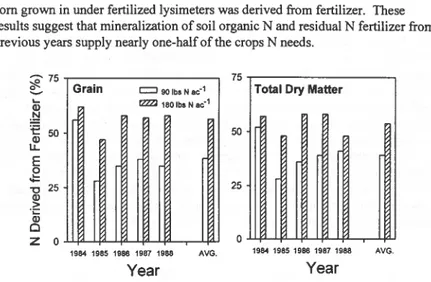
Determining the percentage ofN derived from fertilizer provides a measure of the amount ofN being supplied by the soil. There was less year-to-year variation in percentage N derived from fertilizer than in yield or N-content. The percentage of N derived from fertilizer at the Menoken site was similar for grain and above ground dry matter (Wienhold et aI., 1995) (Fig. 5). Percentage ofN derived from fertilizer increased as level ofN fertility increased. Corn grown under an adequate level ofN fertility derived 30% more N from fertilizer than did underfertilized corn. Just over one-half of the N contained in the adequately fertilized crop was derived from fertilizer while only 40% of the N contained in
corn grown in under fertilized lysimeters was derived from fertilizer. These results suggest that mineralization of soil organic N and residual N fertilizer from previous years supply nearly one-half of the crops N needs.
75~---~
~o_o_ _ 75 Grain
c:::J 90 lb. N 8C·l Total Dry Matter
.~
:e
50 ~ E,g
"U 25 ~ .;:: Q) C rlZ2'J 180 Ibs N 8C·l Z 0 .J..l.1f4-1Lf4-....Lf<L....J..f4-Lfd---,----Lf'U 1984 1985 1988 1987 1988 AVG.Year
50 25 1984 1985 1988 1987 1988 AVG.Year
Fig. 5. Annual Percentage of Grain and Total Above Ground Dry Matter N Derived From Fertilizer at Two Levels ofN Fertility at the Menoken Site. Nitrogen fertilizer-use efficiency varied from year-to-year (Fig. 6). Level ofN-fertility did not influence fertilizer utilization with 35% ofthe applied fertilizer being utilized by the grain and 50% being utilized by the total above ground crop (Wienhold et al., 1995). ;? ~ Z 75 Grain c::::l 90 Ibs N ac-1
=
180 Ibs N ac·l 75Total Dry Matter
...
Q) ~:e
Q) 50 50 u...-
0 c 0 25:;
~:5
0I
I
25o
1984 1985 1988 1987 1988 AVG. 1984 1985 1988 1987 1988 AVG.Year
Year
Fig. 6. Annual Utilization of Fertilizer N by Grain and Above Ground Dry Matter at Two Levels ofN Fertility at the Menoken Site.
140 1996 USCID Wetlands Seminar
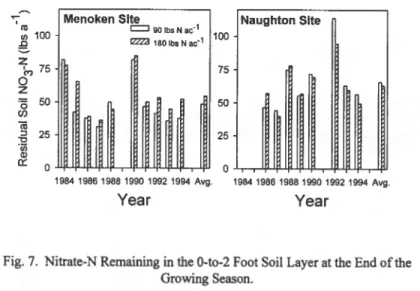
Nitrate-N present in the O-to-2 foot layer of the soil varied from year-to-year (Fig.
7). Trends in residual soil NO)-N were similar for both levels ofN fertility.
Residual soil NO)-N was slightly higher at the Naughton site (65 lbs ac·l
) than at
the Menoken site (50 lbs ac·I). Residual soil NO)-N is not solely unused fertilizer.
Soil samples collected following the ISN study at the Menoken site showed that
30% ofthe applied N fertilizer remained in the 0-to-2 ft soil layer (data not
shown); 20% of the applied fertilizer could not be accounted for, lost to leaching
or denitrification; and these percentages were similar between the two N fertility
levels (Wienhold et al., 1995). Residual N fertilizer was found throughout the
root zone (0-5 ft) demonstrating that leaching of the chemical had occurred. A
trend common to both sites was for a large increase in NO)-N following years
when no crop was planted (no fertilizer added). This increase was likely due to
N-mineralization combined with no N uptake by a crop.
~ .-, m '" 100
g
~ M 75o
Z '0 50 en iii-6
25 'iii ~Menoken Site Naughton Site
c::::J 90 lb. N 8c·1 rzzz.a 180 lb. N oc·1 100 75 50 25 1984 198619881990 1992 1994 Avg. 1984 1986 1988 1990 1992 1994 Avg.
Year
Year
Fig. 7. Nitrate-N Remaining in the 0-to-2 Foot Soil Layer at the End of the
Growing Season.
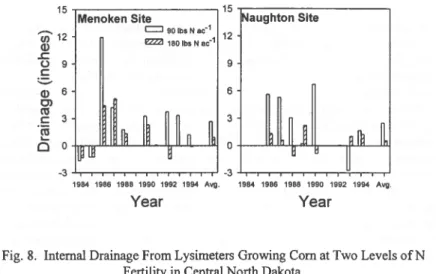
Internal drainage during the growing season varied from year-to-year (Trooien and Reichman, 1993) (Fig. 8). During years where temperatures where above average (1984,1985,1988, and 1989) little drainage occurred. Drainage tended to be greater from lysimeters with corn crops fertilized with a suboptimal level of
N. At the Menoken site, lysimeters receiving 90 lbs N a·1 averaged 2.6 inches of
drainage and lysimeters receiving 180 Ibs N a·1 averaged 0.9 inches of drainage.
At the Naughton site, lysimeters receiving 90 Ibs N a·1 averaged 2.5 inches of
15~---,15~---~
Menoken Site aughton Site
(j) 12 CD .r::. o 9 C :::;.
=
90lbsNac1 12=
180lbsNac1 9 CD 6 6 0> n:J C 3 3'm
o
0 0 +---l.II.Ul4,...!LJI!,-__ ..,j1..Jl.IL....Illl -3 -3 .J...,--r-r-r-.--r-r-r-.-~r-rc--r! 1984 1986 1988 1990 1992 1994 Avg. 1984 1986 1988 1990 1992 1994 Avg.Year
Year
Fig. 8. Internal Drainage From Lysimeters Growing Com at Two Levels ofN Fertility in Central North Dakota.
DISCUSSION
Inadequate fertilization resulted in a reduction in dry matter production (Fig. 3). While evapotranspiration was not measured directly in this study it seems likely that evapotranspiration was less in underfertilized crop where less biomass was produced. This reduction in evapotranspiration resulted in increased internal drainage in soils supporting underfertilized crops (Fig. 8). The leaching fraction in lysimeters fertilized for an optimum yield averaged 8% at the Menoken site and 4% at the Naughton site. The leaching fraction in lysimeters that were under fertilized averaged 23% at the Menoken site and 20% at the Naughton site. These results suggest that the meteorological method of scheduling irrigation works quite well for a crop fertilized for an optimum yield. IfET were calculated exactly, no drainage would have occurred. The observed drainage in lysimeters receiving adequate fertilizer was the result of precipitation being received at the site after an irrigation event. The observed drainage in underfertilized lysimeters was the result of precipitation plus water not utilized by the crop. The measured leaching fractions in adequately fertilized lysimeters were about what is needed to prevent salinity problems from developing in the root zone. Reichman and Trooien (1993) demonstrated that the increase in salinity observed in the lysimeters did not effect yields and that the leaching fraction was sufficient for salinity control. The results suggest that the meteorological method did not work well for an underfertilized crop as the leaching fraction from lysimeters that were
142 1996 USCID Wetlands Seminar
under fertilized exceeded what is needed for salinity control.
The leaching fraction in lysimeters that were under fertilized was nearly three times that of optimally fertilized lysimeters at the Menoken site and five times that of optimally fertilized lysimeters at the Naughton site. This excess leaching represents an economic cost and a potential environmental problem. The economic cost arises from the cost of the water and pumping costs (Le. electricity or fuel). The environmental problems arise from the potential for leaching of agricultural chemicals out of the root zone. In this study, the residual soil N03-N content was determined for the O-to-2 foot increment and internal drainage was measured between 4.4 and 6.6 feet. The residual N03-N remained within the root
zone of subsequent crops and the potential exists for utilization of this N by the next crop. The drainage measured is below the root zone and this water can not be utilized by subsequent crops. Any agricultural chemicals present in this drainage water would also be unavailable to subsequent crops. Such leaching could potentially transport these chemicals to groundwater or surface waters if this groundwater were to discharge into wetlands, streams, rivers, or lakes.
Results presented in this paper suggest a need for more information concerning the interactive effects of various management practices on crop water use efficiency and the need to incorporate these interactions into irrigation scheduling programs. While this paper has emphasized fertilizer management there are other management practices that should be evaluated as well. Crop residue
management could influence crop water use, especially early in the growing season. Presence of surface crop residue reduces evaporation from the soil surface by creating a boundary layer through which water must diffuse from the soil surface to the atmosphere. Surface residue may also maintain a cooler soil temperature thereby reducing evaporation. In addition, cooler soil temperatures may slow germination and seedling development resulting in reduced
evapotranspiration early in the growing season. Weed infestations have the potential for altering crop water use. Timing of weed suppression practices could exert a strong influence on crop water use.
ACKNOWLEDGEMENTS
Thanks are extended to John Bullinger and Wallace Sellner for maintaining the plots and to the Burleigh County Water Resources District for supplying equipment and providing access to the sites.
REFERENCES
Bremner, 1. M., and C. S. Mulvaney. 1982. Nitrogen-Total. p. 595-624.ln A. L. Page (ed.) Methods of soil analysis. Part 2. 2nd ed. Agron. Monogr. 9. ASA and SSSA, Madison, WI.
Doering E. 1., L. C. Benz, and G. A. Reichman. 1986. Internal drainage of fine-textured alluvial subsoils in North Dakota. Trans. ASAE 29:517-521. Jensen, M. E., D. C. N. Robb, and C. E. Franzoy. 1970. Scheduling irrigations using climate-crop-soil data. J. Irrig. Drain. Div. Am. Soc. Civ. Eng. 96:25-38. Leitch, 1. A., 1. F. Baltezore, R. G. Johnson, and R. C. Coon. 1991. A
reevaluation of Garrison Diversion Unit irrigation. Project Rep. Garrison Diversion Conservancy District, Carrington, ND.
Lundstrom, D. R., and E. C. Stegman. 1983. Irrigation scheduling by the checkbook method. North Dakota Ext. Pub!. AE-792. North Dakota State Univ., Fargo.
Reichman, G. A., and T. P. Trooien. 1993. Corn yield and salinity response to irrigation on slowly permeable subsoils. Soil Sci. Soc. Am. J. 57:1549-1554. Trooien, T. P., and G. A. Reichman. 1990. Hydraulic conductivity of till subsoil in North Dakota. Trans. ASAE 33:1492-1496.
Trooien, T. P., and G. A. Reichman. 1993. Internal drainage under irrigation of two slowly permeable subsoils of the Northern Great Plains. Trans. ASAE 36:709-715.
Wienhold, B. 1., T. P. Trooien, and G. A. Reichman, 1995. Yield and Nitrogen Use Efficiency ofIrrigated Corn in the Northern Great Plains. Agron. 1. 87:842-846.