Annual Report 2007: Activities and Findings
This has been a year of changing personnel, building new collaborations within and among other institutions, and increasing synthesis activities while maintaining our central focus of studying the structure and function of the SGS ecosystem and
addressing broader scientific initiatives. We continue to initiate new experiments (in response to the comments from our 2005 site review) that will help form the basis for the next submission. This annual report provides a summary of our A) Research
Activities, B) Information Management, C) Education, Outreach and Training Activities, and D) Project Management.
A. Research Activities
During the last year, we produced 27 papers in refereed journals, 18 book chapters, three dissertations, one thesis and 33 abstracts from national and international
meetings. Fifteen additional papers have been accepted by refereed journals, and one for book chapters. Twenty-one graduate students, 31 undergraduate students
and three post-doctoral fellows worked on research related to the shortgrass steppe
LTER. We continue to sample our long-term projects, as well as initiating some new short-term experiments. Key research progress for 2006-2007 is presented below for each of our three core areas: population dynamics, biogeochemical dynamics, and land-atmosphere interactions, as well as for integrated, synthetic and cross-site work. 1. Population Dynamics a. Plants Bouteloua gracilis 0 5 10 15 20 25 30 1 4 6 8 10 12 Years of Treatment Ba s a l Co v e r (% ) UG UU GU GG
1) Temporal Convergence after Shifts in Grazing Treatments: Grazing exclosures and grazing intensity treatments at the CPER were established in 1939, but the temporal dynamics of the plant communities were not closely monitored at that time. We are conducting a long-term experiment that opens half of old long-term exclosures to
grazing and creates new exclosures on long-term grazed areas. This will assess the dynamics of convergence of
previously ungrazed communities (UG- previously Ungrazed, now Grazed) to grazed communities (GG- previously Grazed, still Grazed) and convergence of previously grazed communities (GU- previously Grazed, now Ungrazed) to ungrazed (UU- previously Ungrazed, still Ungrazed) (Figure 1). Bouteloua gracilis, the dominant species of the shortgrass steppe, is of particular interest in
Figure 1 Response in basal cover of Boutelous gracilis versus years of grazing treatment
response to these treatments because it is 70-80% of the plant community. Long-term results indicate that B. gracilis that is newly grazed will rapidly converge to the long-term grazed levels, but that newly ungrazed B. gracilis does not rapidly converge to long-term ungrazed levels. Larger differences between the UU and other treatments are observed during wet cycles of high abundance, but differences diminish during dry cycles. This suggests that the reaction to grazing may be more sensitive than the recovery from grazing, and that temporal increases in productivity within a system among years increases sensitivity to grazing similar to that predicted for local and global spatial scales among communities (Milchunas and Lauenroth 1993).
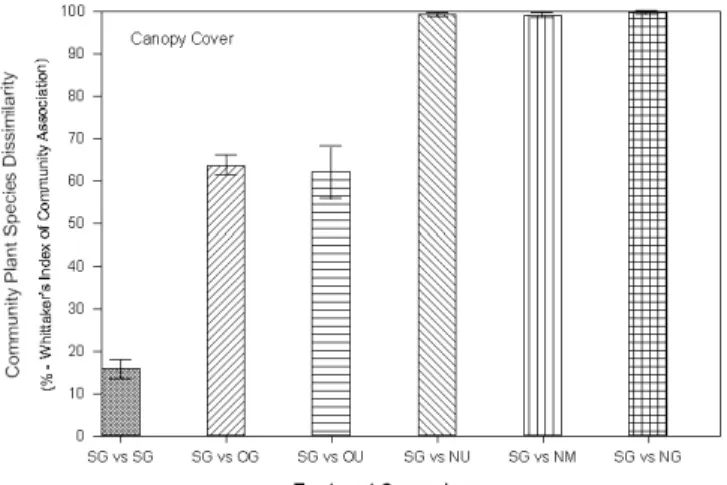
2) Grazing of CRP to Speed Succession: The shortgrass steppe of the Great Plains is an ecosystem that has evolved with grazing by large herds of bison. Current-day grazing by domestic livestock is a surrogate for this integral component of the system that favors endemic shortgrass fauna and flora, and reduces the abundance of invasive, ruderal, or ‘weed’ plant species. Planting of CRP lands with mid- and tall- grass species fragments native shortgrass steppe, and early seral stages have high densities of annual weed species. Relatively greater aboveground to belowground allocation ratios of these CRP fields compared to native shortgrass communities has additional implications for soil stability and carbon sequestration potentials of the two. A study was initiated to assess the potential for grazing (compared to the usual no grazing on CRP) to speed succession to native short grasses on seeded CRP land, to produce a physiognomy more favorable to endemic wildlife, and to increase recovery rates of soil organic matter that is depleted by previous plowing by selecting for late seral stage species that allocate relatively more belowground than to aboveground (Milchunas et al. 2005). The study includes both newly planted CRP fields (2 years old) and older CRP fields (10 years old) with grazed or mowed and ungrazed treatments. The new field was seeded, and allowed to establish for two years. Preliminary results indicate that new fields are nearly 100 percent dissimilar from native shortgrass (SG) and new ungrazed (NU), new mowed (NM), or new grazed fields (NG) show little difference after only one year of treatment. Old CRP fields grazed (OG) or ungrazed (OU) are approximately 60% different in species
composition and initial (one year) treatments have not yet induced changes in the plant community. This system does not respond rapidly to aboveground disturbances, and changes due to treatments are not expected to occur initially.
Figure 2 Disimilarity index of plant communities in CRP lands as a function of management. Shortgrass (SG) and new ungrazed (NU), new mowed (NM, new grazed fields (NG), old CRP fields grazed (OG) or
3) Livestock Responses to Very Heavy Stocking Rate Experiment: A new experiment was initiated in 2004 to evaluate the vegetation and animal responses to very heavy stocking. Previous grazing management research in the shortgrass steppe had largely addressed stocking rates within the constraints of the livestock production paradigm. Here, we implemented stocking rates that were double the recommended rate on
shortgrass steppe. Individual animal responses in terms of average daily gains (gain per head per day) decreased by 15% (2004) and 24% (2005) in the first two years of the study, with marked reductions observed in 2006 (77% reduction) (Figure 3). Gains expressed on a per unit land area basis (kg/ha), however, show that the very heavy stocking rates produced more total gain over the summer grazing season in 2004 and 2005, but not in 2006. The greater gains per unit land area in 2004 and 2005 were manifest due to the doubling of the number of yearlings on the study pastures (Figure 4). The greater numbers of yearlings in 2006, however, did not compensate for the very marked reduction in livestock performance per individual animal. As a result, this suggests that short-term overstocking may be economically feasible for land managers, but continued implementation of this management practice has longer-term negative economic consequences. These results suggest that an ecological threshold in terms of animal performance was crossed in 2006, although forage production taken from temporary exclosures established prior to the grazing season did not differ between moderate (527 kg/ha) and very heavy (515 kg/ha) stocking rates. This experiment is planned to continue for 10 years with annual measurements of vegetation (cover, density, diversity, production) and animal (weight gains) responses.
Figure 3. Weight gain per individual animal for 2004, 2005, and 2006 under moderate and very heavy stocking rates.
Figure 4. Weight gain per unit area for 2004, 2005, and 2006 under moderate and very heavy stocking rates.
4) Precipitation Manipulation Experiment: Future climate scenarios for the central US include the potential for a shift to more extreme precipitation patterns in which growing season rainfall events will be fewer in number but larger in size. Within this region, a strong west-east precipitation gradient (350 to 850 mm) gives rise to three distinct grassland types – the shortgrass steppe, mixed grass prairie, and tallgrass prairie – which differ strongly in ecosystem structure and function. Aboveground net primary productivity (ANPP) is characteristically water-limited in each of these grasslands. A shift to fewer rainfall events is likely to alter soil water availability for plant uptake via changes in rates of evaporation, transpiration, and runoff. To investigate how
ecosystem function may be impacted by shifts in precipitation patterns, we conducted a multi-site study in which growing season precipitation was manipulated through the use of small-scale rainout shelters (n=15 per grassland). Beneath these, we varied rainfall distribution through application of 12, 6, or 4 events/season, while maintaining cumulative amounts at 30-yr averages. Reducing event number had dramatic but opposite effects across the precipitation gradient. In tallgrass prairie, a reduction from 12 to 4 events resulted in a 15% reduction in ANPP (Figure 5). In contrast, an increase in ANPP of 30% and 70% was observed in short- and mixed- grass prairie, respectively, as event number decreased (but event size increased). Data suggest that changes in precipitation patterns strongly influence soil moisture dynamics and soil water content, which, in turn, drive ecosystem function.
Figure 5. ANPP vs rainfall events data for the SGS LTER site in 2006. SGS 2006
# of rain events
Ambient 12 events 6 events 4 events
ANPP ( g /m 2 ) 0 20 40 60 80 100 120 140 160 a a b b
5) Small Plot Burning Experiments: Although fire is an important driver in grassland systems, comparatively little is known about the response of the shortgrass steppe. Based on comments we received from the NSF-LTER site review team we began a new experiment last year and report on this years findings. The goal of this study is to
increase our understanding of the responses of the shortgrass steppe, not just to a single fire, but to a variety of fire frequencies. 20 m x 20 m plots were set up in an area in the Shortgrass Steppe LTER not grazed by cattle. Plots burned every year and every three years will be compared to unburned control plots. The first burn of both annual and triennial plots was conducted in early May 2006. ANPP was lower in the burned plots than the controls. This difference was due to a decrease in perennial grass productivity (Figure. 6). Species richness did not differ between treatments, although the relative cover of annual grass tended to be lower in burned plots. Soil moisture and temperature did not differ between burned and unburned plots. There was lower than average
precipitation in 2006, which may affect how the system responds to burning.
Three individual cactus plants were marked in 2006 within each of the 4 replications of the 5 treatments (unburned, burned every spring, burned every fall, burned every third spring, and burned every third fall). All plots that had a burning treatment were burned in 2006, with the annual spring burning plots burned a second time in 2007. Plants were censused on June 14, 2007 with cladodes counted in the following categories: new, older (including injured cladodes) and dead, along with the number of flowers per plant. The values in the above graph represent means per treatment (n=12 plants). General trends include the following: a) New and older cladodes are greatest on plots not
burned, and lowest on plots burned last fall, b) Number of flowers are greatest on plots not burned, and lowest on plots burned last fall and plots burned annually in the spring, c) Number of dead cladodes was greatest in the plots burned last fall and plots burned annually in the spring, whereas unburned and plots burned only in the spring of 2006 had the lowest numbers of dead cladodes.
Figure 6. ANPP (mean ± SE) of different plant types in control (black) and burned (gray) plots in 2006. *** Difference between treatments is significant (P<0.001).
0 20 40 60
per. grass per. forb shrub ann. grass ann. forb Plant type ANP P ( g /m 2 )
***
0 20 40 60per. grass per. forb shrub ann. grass ann. forb Plant type ANP P ( g /m 2 )
***
Figure 7. Response of cactus (Opuntia polyacantha) to burning in 2006.
b. Fauna
1) Long-term mammal studies: This year we continued our long-term studies of small mammals and carnivore populations on the site, which now consists of 14 years of monitoring. In an effort to take advantage of this growing dataset, we organized a Working Group at the LTER All-Scientists Meeting (LTER-ASM) in Estes Park to bring together LTER scientists working in arid and semi-arid grasslands to discuss
opportunities for cross-site comparisons. We received funding from the Network Office for one meeting in February 2007 in Albuquerque to facilitate data synthesis and
Jornada, Mapimi). Preliminary results of these cross-site analyses were presented a part of a special symposium at the American Society of Mammalogists meeting on long-term studies of small mammals in arid and semi-arid environments. Work from this symposium will be published in a Special Feature in the Journal of Mammalogy in 2008. We published 1 manuscript in 2006 based on our long-term studies.
2) Ecology of shortgrass steppe in relation to prairie dogs and plague: This year we continued our estimates of prairie dog densities, based on mark-resight methodologies. Our own analyses indicate that previous estimates based on indices from visual counts on survey grids, developed by Severson and Plumb (1998; Wildl. Soc. Bull. 26:859-866) have been useful to a limited extent (E.g. Derner et al. 2006), but lack estimates of reliability and error. The first reassessment of these estimates is in press (Magle et al., J. Wildl. Manag., in press), but further analyses are currently underway in collaboration with the CSU department of Fisheries, Wildlife and Conservation.
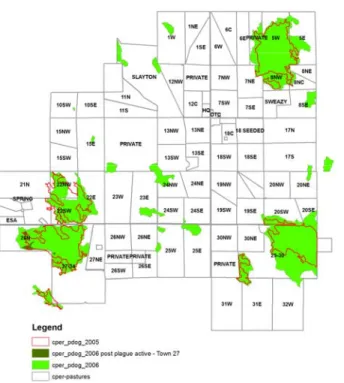
We work closely with the PNG staff to monitor activity of prairie dogs on the both the PNG and CPER (SGS work), by GPS measurements of prairie dog size. Data are currently updated to 2006, with the following general trends, including plague outbreaks on all five major prairie dog towns on the CPER (27, 22, 5, 29, 30).
Figure 8. Distribution of prairie dog towns on the CPER. Updated with surveys from 2006
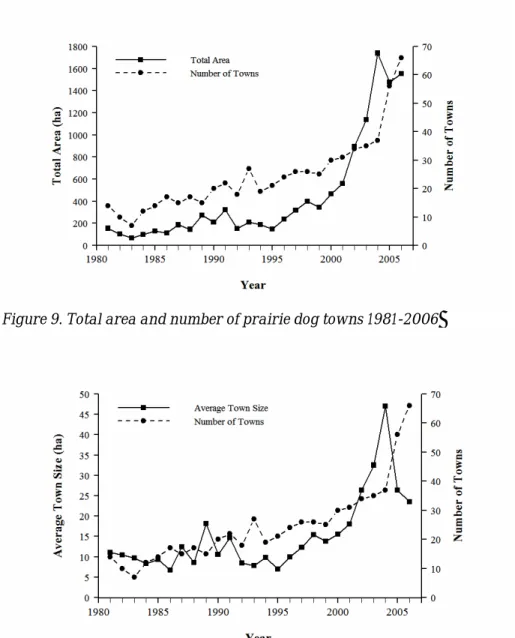
The long-term trend (1981-2006) follows two patterns: a general increase in area during the last 10-15 years, with recent declines because of plague. The number of prairie dog towns has also increased greatly during this time (Figure 9). At the same time, the average size of colonies has decreased, as expected when the largest towns are
extirpated by plague but many new towns are colonized at the same time (Figure 10). The data are being incorporated into a dynamic metapopulation model (Webb,
Unpublished). The model was presented at the 5th Ecology and Evolution of Infectious
Diseases Conference in Ithaca, NY (May 30-June2, 2007) as a poster:
Figure 9. Total area and number of prairie dog towns 1981-2006
Figure 10. Trend in average size of prairie dog towns over time.
2) Flea transmission studies: Two fleas are thought to be important in plague epizootics among black-tailed prairie dogs: Oropsylla hirsuta and Oropsylla tuberculata
cynomuris (Siphonaptera: Ceratophyllidae). Both are competent vectors of Y. pestis and commonly harbor infections in the wild, but evidence of their role in plague epizootics is conflicting. Prior studies of vector efficiency of these two fleas showed they are relatively inefficient vectors, suggesting they are incapable of supporting epizootic spread among prairie dogs. We examined transmission efficiency of O. hirsuta and O. tuberculata
cynomuris in the laboratory using naïve mice to groups of potentially infectious fleas from 1 to 4 d post-infection (early-phase). In contrast to traditional ideas of flea-borne transmission, the results show that both fleas are infectious soon after exposure to a bacteremic host. These conclusions offer an alternative mechanism for flea-borne epizootic spread in prairie dogs that is more consistent with the rapid spread observed in plague epizootics than traditional flea-borne transmission after a prolonged
incubation period The two flea species are separated seasonally, with O. tuberculata cynomuris dominating in late winter and spring, and O. hirsuta abundant in summer and early fall.
3) Prairie dog parasite studies: Prairie dogs, are commonly parasitized by coccidians in the genus Eimeria. The study was conducted from September 2005 to October 2006, and revealed four Eimeria species: E. callospermophili, E. cynomysis, E. lateralis, and E. morainensis. Samples from 222 prairie dogs were collected from 8 active towns that included plague or no plague present. Parasite prevalence, abundance, intensity, and species diversity were related to mean air temperature and presence of plague in towns. These results support the hypothesis that plague, which also has infection dynamics driven by temperature, affect the animals’ immune systems and allow higher numbers of other parasites to invade or persist.
A PhD project entitled “Functional genetic diversity and pathogen resistance in black-tailed prairie dogs” will examine how host genetic diversity may play an important role in buffering populations against infectious disease. The genes encoding the major histocompatibility complex (MHC) of the vertebrate immune system are highly
polymorphic and well-characterized for many species, and have thus been an attractive target to discern relationships between genetic diversity and disease. However,
evolutionary dynamics of MHC remain unclear, likely because other immune system genes are also important in responses to pathogens and parasites. Recent
immunogenetic discoveries make it practical to isolate immune system genes besides MHC in wildlife, and examine responses of specific immune system genes to different types of pathogens and parasites. An extensive literature search for parasites of black-tailed prairie dogs, revealed 37 pathogen and parasite species, primarily coccidia and arthropods, but also two zoonotic bacteria and several helminth species. Given the potential parasite diversity in black-tailed prairie dogs, evidence of disease-induced decline, their taxonomic relationship to several species of conservation concern,
extensive knowledge of their life-history and ecological traits, and our previous studies of populations in northern Colorado, prairie dogs are an excellent model for associations between pathogen resistance and functional genetic diversity in mammals. The project is moving beyond the single-pathogen single-gene approach by investigating the
relationship between allelic diversity (heterozygosity) in three functionally different immune system genes and the entire parasite community of black-tailed prairie dogs. Currently we have PCR-cloned the DRB gene (10 alleles in Colorado), and with
development of markers for the chemokine receptor interleukin-10 and toll-like receptor-2 underway.
4) Burrowing owl studies: Burrowing owls (Athene cunicularia) are a state listed threatened species in Colorado, declining across most of their range in the Americas.
Burrowing owls on the PNG are associated with the metapopulation of black-tailed prairie dogs where periodic local town extinctions are caused by plague (Yersinia pestis), providing a system for studying multi-species dynamics in the presence of an introduced pathogen. We are locating nests and monitoring abundance, apparent nest success, and fledging success for owls on the PNG, and making use of owl count data collected by the Forest Service from 1998 – present. In collaboration with CDOW, banding efforts increased in 2007 with the major goal of estimating fledging success, which has never measured for burrowing owls in natural burrows and will require new estimation techniques. We are using models to investigate the existence of a threshold in prairie dog town area lost, beyond which owl populations may decline. The burrowing owl is a species of conservation concern in the state of Colorado.
5) Swift fox studies: The purpose of this project is to contribute to our growing understanding of swift fox behavior and the relationship between a northeastern
Colorado swift fox population and black-tailed prairie dogs. Specifically, we investigate seasonal changes in swift fox spatial and temporal movement patterns, habitat use, den site selection, and diet in relation to the distribution of prairie dog towns on the CPER by radio tracking of individual foxes. Home ranges of foxes are being compared from times before plague outbreaks on prairie dog colonies (data acquired from 2003 – 2006) compared to post-plague event home ranges (2007 – 2008). Before the plague epizootic foxes denned on or in close proximity to prairie dog towns, but little is known how foxes shift with respect to a plague outbreaks. The swift fox is a species of
conservation concern in the state of Colorado.
6) Pollinator studies: Black-tailed prairie dogs’ intensive herbivory, vegetation clipping, and burrowing greatly modify colonized patches, and the increase in bare ground and forbs affects pollinating insects. We sampled six prairie dog towns and six similar uncolonized sites for bare ground and forb cover, inflorescence and open flower density, and insect floral visitation in 2003 and 2004. Bare ground, forb cover, and total
number of inflorescences and open flowers on prairie dog colonies were approximately double that on uncolonized sites in both years. Diurnal insect visitors, primarily
pollinators, visited flowers at twice the rate on towns as off, indicating preferential use of prairie dog towns for foraging. The most-visited plant species had denser
inflorescences and insect diversity was related floral resource diversity. These results are evidence for a terrestrial tri-trophic interaction with consequences for conservation of shortgrass steppe flora and insects, and further substantiates prairie dogs role as ecosystem engineers.
7) Harvester ant studies: Social animals contribute to habitat heterogeneity by building long-standing dwellings that house many individuals for extended periods of time. These habitat alterations and disturbances change resources for other available that exploit engineered habitat. Two conspicuous ecosystem engineers occur on the Colorado shortgrass steppe are the mound-building black-tailed prairie dog and the nest-building western harvester ant (Pogonomyrmex occidentalis). These taxa overlap in much of their ranges ant nest densities are similar on and off prairie dog towns, but on-town nests were significantly larger. Mounds and nests were significantly aggregated on the landscape; a striking 22% of nests overlapped mounds, which covered only 1.2% of
prairie dog towns. Mounds supported more vegetation than nests on and off colonies; in particular, a native forb (Sphaeralcea coccinea) and an exotic forb (Salsola iberica) were associated with mounds but not nests. Beyond mounds and nest perimeters, there were few differences in vegetation cover, diversity, or height that can be attributed to harvester ant activity. Instead, differences in vegetation characteristics were manifested at the town scale as a likely response to prairie dog grazing.
8) Effects of prairie dog dynamics on vegetation: Plague causes periodic die-offs of prairie dog towns, and during periods of inactivity vegetation may recover from the effects of heavy grazing. During the previous 25 on the PNG, most colonies (97%) experienced plague outbreak within 15 years of activity, and that over half (55%) were inactive for at least five years after an outbreak. Further, the probability of a town attaining its pre-outbreak size within 5 years was low (28%). Comparing towns of different ages before and after outbreaks showed that average plant canopy cover and functional groups (forb, grass, shrub, cactus) did not differ between on- and off-town either before or after outbreaks. However, average grass biomass was lower on towns before outbreaks, but not after, while forb biomass did not differ either before or after outbreaks. Herbivore exclosure cages demonstrated that cattle and prairie dogs had similar and additive effects on plant biomass. Cattle consumed about the same amount of plant biomass on- and off-towns, total aboveground plant production was did not differ between on- and off-colonies, but graminoid production decreased and forb production increased with prairie dog grazing. Total plant species richness was greater only on old and plague-extirpated towns, and greater species richness was due to greater numbers of forb species rather than graminoid species. Shoot N concentrations of the dominant grass (Bouteloua gracilis) and forb (Sphaeralcea coccinea) were significantly greater on active towns. However, total standing crop N was lower on active towns because aboveground biomass was lower. Prairie dog mounds on active colonies had greater rates of N mineralization compared to off-colony or intermound spaces, suggesting that mounds may be sites of high nutrient turnover. Soil organic matter pools (total C and N, particulate organic matter C and N) appear to be relatively
unaffected by prairie dogs, with differences seen only in the older colonies. Both mound and intermound areas on-colonies had lower total organic C than off-colonies. The introduction of plague to North America may be altering the role of prairie dogs in shaping ecosystem structure and function because plague-extirpated towns were rarely different than off-colony sites. Effects of prairie dogs appear to increase with colony age, but because of plague, few colonies now persist for multiple decades.
2. Biogeochemistry
Among our new efforts, we have 1) evaluated the role of fungi vs bacteria in controlling trace gas fluxes, 2) analyzed the relationships between soil microbial ecology and
methane uptake, and 3) invested in cross-LTER-site activities to address the large-scale and regional scale controls over decomposition. In the latter case, we have conducted 3 major syntheses.
1) Soil respiration and N2O emissions under patches dominated by C3 and C4 grasses,
nitrogen transformations via nitrification and denitrification contribute about 70% of the annual global emissions of N2O. Nitrification is the main source of N2O in the short
grass steppe, where water contents do not exceed 24%, and it could be carried out by autotrophic bacteria or heterotrophic microorganisms. Previous work in grasslands and semiarid soils has shown that N2O emissions were related to heterotrophic activity, but
the source has been unknown in shortgrass steppe. Our first objective were to estimate respiration rates of fungi and bacteria in patches dominated by different plant
functional types (C3 and C4 grasses, and invasive forbs) in plots under control and
resource addition treatments (Figure 11). These resource addition treatments included nitrogen + water addition plots, which were fertilized and watered 30 years ago. The second objective was to evaluate N2O emissions during lab incubations, and determine
whether fungal or bacterial biomass was the most important source. We incubated soils collected monthly during the growing season. Respiration and N2O emissions were
lower in June, when the precipitation was relatively low, and they increased during consecutive months when precipitation increased. Field trace gas fluxes were variable in time and space. We did not find consistent differences between plant functional types or resource additions. In general, fungal inhibition significantly decreased respiration and N2O emissions. Carbon dioxide and N2O emissions were higher under higher
precipitation. Future analyses will help determine whether N2O emissions were mainly
determined by nitrification or denitrification. This work will be presented at ESA this summer.
Figure 11: Monthly patterns of N2O flux on a grazing exclosure (control), and plots that were fertilized
and watered 30 years ago (NW) under patches of different functional types: C3, C4, and forbs. Soils were incubated in the laboratory with antibiotics to discriminate microbial activity: B: cycloheximide was applied and only bacteria were left; F: streptomycin was applied, and only fungi were left; Nmo: both antibiotics were applied, and neither bacteria nor fungi were left; B+F: control without antibiotics and with both bacteria and fungi present.
C3 grass NW 0.00 0.05 0.10 0.15 0.20 0.25 0.30 0.35 0.40 0.45
Jun Jul Aug Sept Oct
N 2 O (µg g -1 dr y s o il ) B F Nmo B +F C3 grass control 0.00 0.05 0.10 0.15 0.20 0.25 0.30 0.35 0.40 0.45
Jun Jul Aug Sept Oct
N 2 O (µ gg -1 d ry s o il ) B F Nmo B +F C4 grass control 0.00 0.05 0.10 0.15 0.20 0.25 0.30 0.35 0.40 0.45
Jun Jul Aug Sept Oct
N 2 O (µ gg -1 d ry s o il ) B F Nmo B +F forbs NW 0.00 0.05 0.10 0.15 0.20 0.25 0.30 0.35 0.40 0.45
Jun Jul Aug Sept Oct
N 2 O (µ gg -1 d ry s o il ) B F Nmo B +F
2) Linking soil microbial ecology with ecosystem function: There is fundamental interest in understanding how soil biogeochemical processes relate to functional traits of soil microbes and environmental controls of their activity. For many biogeochemical processes, understanding the linkage to microbes is complicated by the myriad types of organisms and multiple environmental controls. In contrast, methane consumption in upland soils (i.e., well-drained, oxic) is relatively simple: methane molecules diffuse from the atmosphere into the soil, where they are consumed by methanotrophic bacteria, a phylogenetically cohesive group of organisms.
We have developed a new biogeochemical model to describe methane consumption dynamics. This model both provides insight into methane consumption, and it serves as the basis for a new method for determining soil methanotroph activity that does not require laboratory incubations of soils, but uses field measurements using flux chambers. This work was submitted to the Journal of Geophysical Research – Biogeosciences.
The methane consumption model describes how soil diffusivity (i.e., the capacity of the soil to conduct gas movement) and methanotroph activity yield methane uptake rates. The model solution (illustrated below) reveals a surprising, non-linear relationship between soil diffusivity, methanotroph activity and methane uptake rates: doubling microbial activity or soil diffusivity leads to only a √2 increase in flux rate, not to a doubling of flux as might be expected (Figure 12). This relationship has important implications for interpreting measures of methanotroph community size or activity in lab incubations.
Figure 12: Modeled relationship between soil diffusivity, methanotroph activity and methane flux (consumption) rate from von Fischer et al. (submitted). Note log scales on methanotroph activity and flux rates.
-5 -4 -3 -2 -1
Log methanotroph activity (µ), min-1
Diffusivity ( D ), cm 2 min -1 0 1 2 3 4 5 6 Flux rate, mg CH4-C m -2 d-1 ≤0.02 ≤0.04 ≤0.08 ≤0.16 ≤0.32 ≤0.63 ≤1.26 ≤2.51 ≤5.01 >5.01
Because the relationship between methane flux and its controls is quantified with this mathematical model, the model can also be used to determine the methanotroph activity from field measures of soil diffusivity and the methane flux rate made from traditional gas flux chambers. Results from application of this field technique illustrate the temporal changes in methanotroph activity in response to changing environmental conditions. For example, between July 11 and August 9, we observed a 98% reduction in methanotroph activity, as soils dried and became hotter over the summer.
We have begun using molecular tools to relate these field measures with the distribution and abundances of methanotrophic bacteria. Preliminary results reveal that
methanotroph abundance falls off sharply with depth in the soil profile ; methanotrophs are 40% less abundant in the 10-20cm depth than they are in the 0-10cm. Although methanotroph activity varies with topographic position and soil texture, we found no changes in methanotroph abundance, so we are investigating variability in
methanotroph community composition by sequencing the methane monooxygenase gene from methanotrophs from these different sites.
3) Global Scale Patterns in N Dynamics during Decomposition: Our SGS scientists have been extremely involved in the LIDET synthesis work (Parton et al. 2007, Adair et al. in press, Bontti et al. submitted). The LIDET experiment has been the first experiment to be conducted across all LTER sites (as well as several others). Parton et al. (2007) found interesting patterns across all sites with respect to N dynamics during
decomposition. Litter decomposition provides the primary source of mineral nitrogen (N) for biological activity in most terrestrial ecosystems. The 10-year decomposition experiment data from at 21 sites from seven biomes found that net N release from leaf
ration and mass remaining regardless of climat
conditions, or biota (Figu 13). Arid grasslands expo high UV radiation were an exception, where net N was insensitive to initial N. Roots released N linearly with decomposition and exhib little net N immobilization. We suggest that fundamenta constraints on decomposer physiologies lead to predictable global-scale patterns in net release during decompositio
Figure 13. Average
litter is dominantly driven by the initial tissue N concent
e, edaphic re sed to release ited l N n.
mass remaining as a function of time for LIDET core leaf (n = 5 to 6 species) and ot (n = 3 species) litters decomposed in 21 sites. (A) Leaf litter decomposed in forest and tundra
nd ro
biomes; (B) root litter decomposed in forest and tundra biomes; (C) leaf litter decomposed in humid a arid grasslands; (D) root litter decomposed in humid and arid grasslands. Each species and litter type was decomposed in replicate bags and collected at multiple time points. Results show that leaf and root litter decomposition rates generally increase as the CDI increases (Table 1). In arid grasslands, leaf litter decomposed more rapidly than expected (based on the CDI), possibly due to photodegradation.
In a separate study, our investigators evaluated the extent to which the LIDET data could be modeled using simple approaches (Adair et al in press). As atmospheric CO increases, ecosystem carbon sequestration will largely depend on how global change climate will alter the balance between net primary production and decomposition. The response of primary production to climatic change has been examined using well-validated mechanistic models, but the same is not true for decomposition, a primary source of atmospheric CO2. We used the Long-term Intersite Decomposition
Experiment Team (LIDET) data set and model selection techniques to choose and parameterize a model that describes global patterns of litter decomposition. M was best represented by a three pool negative exponential model, with a rapidly
decomposing labile pool, an intermediate pool representing cellulose, and a recalcitran pool. The initial litter lignin/nitrogen ratio defined the size of labile and intermediate pools. Lignin content determined the size of the recalcitrant pool. The decomposition rate of all pools was modified by climate, but the intermediate pool’s decomposition rat was also controlled by relative amounts of litter cellulose and lignin (indicative of lignin-encrusted cellulose). The effect of climate on decomposition was best represented by a composite variable that multiplied a water stress function by the Lloyd and Taylor (1994) variable Q10 temperature function. Although our model explained nearly 70% of
the variation in the LIDET data, we observed systematic deviations from model
predictions. Below- and aboveground material decomposed at notably different rates, depending on the decomposition stage (Figure 14). Decomposition in certain
ecosystem-specific environmental conditions was not well represented by our model; this included roots in very wet and cold soils, and aboveground litter in N-rich and arid sites. Despite these limitations, our model may still be extremely useful for global modeling efforts, because it accurately (R2 = 0.6804) described general patterns of
long-term global decomposition for a wide array of litter types, using relatively minimal climatic and litter quality data.
2 s in ass loss t e 20 30 40 50 60 70 80 90 100 0 2 4 6 8 10 Time (years) M as s re m ai ni ng (% ) Obs-DGRL Obs-PIEL H2 model-DGRL H2 model -PIEL H1 model-DRGL H1 model-PIEL
Figure 14. Litter quality affects the rate of mass loss. Leaf litter of two species with different litter quality is shown averaged across all sites: Drypetes glauca (DGRL; low L/Cell and /N) decays more
g L
rapidly than Pinus elliottii (PIEL; high L/Cell and L/N). The predictions of two models representin different hypotheses are shown. The H1and H2 models are both 3 pool models but litter quality modifies
4) Evaluation of grassland decomposition: another LIDET synthesis: A team of graduate
d ite Decomposition Team (LIDET) data set to detect the
.
ant
on at ce students at our site were interested by the fact that both of the above analyses, done on the entire LIDET dataset, suggested that grasslands behave somewhat differently. These students submitted a paper to Global Change Biology (currently under revision, Bontti et al) evaluating these grassland decomposition dynamics. In addition to resulting in interesting results below, the students were exposed to the data and metadata associate with a large cross-site study.
We used the Long Term Inters
most important climatic and litter quality variables to predict above-and belowground decomposition rates in grassland ecosystems as well as assess their relative importance We also compared above- and belowground decomposition rates of Pinus spp, Drypetes glauca, and wooden dowels, the latter to control for substrate quality. We also evaluated nitrogen dynamics by following the trends in nitrogen remaining through time in litter of high and low quality placed in xeric and mesic grasslands. Percent lignin was the best quality predictor, for above- and belowground decomposition, whereas precipitation class was the best climate predictor for belowground decomposition. This suggests that in grasslands temperature does not directly affect decomposition, but it might affect carbon pools through decreasing water availability. When percent lignin and
precipitation groups were included in the same model, litter quality was more import than climate to predict decomposition. Part of the variability in decomposition remains unexplained, particularly in leaf litter decomposition, which suggests that abiotic factors such as UV light or wind might influence leaf mass loss, especially in arid and semiarid grasslands. Aboveground decomposition was faster than belowground decomposition when leaves and root of the same species were compared. The opposite resulted when above-and belowground dowels of homogeneous composition were compared,
supporting the importance of other abiotic factors to accelerate aboveground decomposition of leaf. Root litter released nitrogen regardless of quality and precipitation class, whereas leaf litter of only high quality showed mineralizati mesic and xeric sites. Low quality leaf litter released nitrogen at xeric sites, and immobilized nitrogen at mesic sites, suggesting carbon limitation or UV light influen in xeric sites. Xeric Mesic DRGL Decom posi ti on R a te (k) 0.0 0.1 0.2 0.3 0.4 0.5 Aboveground Belowground
Precipitation Group Xeric Mesic P inus Decompositio n Rat e (k) 0.00 0.05 0.10 0.15 0.20 0.25 Precipitation Group Xeric Mesic Pinus Decom p osition Rate ( k ) 0.00 0.05 0.10 0.15 0.20 0.25
Figure 15. Aboveground and belowground Drypetes glauca and Pinus species decomposition rate (k) by precipitation group. Aboveground decomposition is significantly higher than belowground for both DRGL and Pinus species (p = 0.033 and p = 0.0069, respectively). Both aboveground and belowground decomposition rates increase with greater precipitation levels. Error bars represent ±1 SE.
3. Land-Atmosphere Interactions
1) Soil N constraints and vegetation responses to rising atmospheric CO2: Recent abrupt
increases in atmospheric CO2 have tremendous implications for the ecology of native
grasslands like the shortgrass steppe, where NPP has been shown to be strongly enhanced by CO2 enrichment and plant species sensitivities to CO2 are variable. A
doubling of ambient CO2 concentration was earlier reported to lead to an average 41%
increase in aboveground biomass in the shortgrass steppe over a five-year experiment (Morgan et al., 2004), but resulted in a decline in overall forage quality due to lower
ds, was nhanced over 20-fold by a doubling of CO2 (Morgan et al., in press). This is the first
tissue N concentrations and species changes (Milchunas et al., 2005). In last year’s annual report, we showed evidence that productivity of Artemisia frigida, a sub-shrub common to the site as well as to many other North American and Asian grasslan
evidence from a manipulative experiment supporting the notion that rising atmospheric ment in grasslands of the past two centuries. hile important, these findings, cannot completely answer important questions about he
5-uce C CO2 is contributing to the shrub encroach
W
the long-term effects of rising CO2 on the ecology of grasslands since time constants for
many soil processes involved in soil nutrient cycling, which can modulate plant responses to CO2, can be in the order of decades or centuries, much longer than t
year period of the experiment (Morgan, 2002). Understanding the long-term implications of rising CO2 requires a fundamental understanding of its impacts on
nutrient cycling. Recently, Luo et al. (2004) introduced the progressive nitrogen limitation (PNL) hypothesis, which postulates that rising atmospheric CO2 might red
available soil N, thereby constraining the CO2-induced stimulation in plant growth a
sequestration. PNL is hypothesized to occur when proportionally more of the available soil N is fixed into long-lived plant biomass and soil organic matter under elevated CO2.
2) Ecosytem Models and rising CO2:
Two different exercises were
conducted this past year to evaluate the long-term implications of rising CO2 on N cycling. First, we
parametrized the DAYCENT
ecosystem model (Parton et al.., 1998) to simulate the impact of elevated CO2
from results of the open-top chamber experiment conducted in eastern Colorado (Morgan et al., 2001), and used the results to simulate combined warming and
rising atmospheric CO2 scenarios that
g and t. esponses
s in
spiration and nutrient mineralization, but when O2 has variable effects on these processes
er stress (Parton et al., 2007). DAYCENT
anic carbon (Figure 17a) and organic nitrogen (Figure combinations of CO2 and temperature, but
s much by year-to-year variation in weather, etations of the long-term impacts on soil C and N difficult.
Figure 16. Comparison of modeled and measured aboveground productivity (July) of
chamber ambient and elevated CO2 plots.
are the basis of a new global change experiment, the Prairie Heatin
CO2 Enrichment (PHACE) experimen
The model gave a fairly accurate prediction of plant biomass r to CO2 (Figure 16), and result
water content, plant production, soil re combined with warmer temperatures, C depending on yearly differences in wat predicted a decline in both soil org 17b) for rising CO2, temperature, and
variability in these traits was affected a making interpr
In an analysis of plant and soil d
our previous open top chamber experiment, Dijkstra et al. (in review) developed a novel
15N tracer method that explained how
greater plant N uptake in plants expo double present ambient CO2 concent
(King et al., 2004) was due to
mineralization. We found that plant biomass 15N, expressed
n an analysis of plant and soil d
our previous open top chamber experiment, Dijkstra et al. (in review) developed a novel
15N tracer method that explained how
greater plant N uptake in plants expo double present ambient CO2 concent
(King et al., 2004) was due to
mineralization. We found that plant biomass 15N, expressed ata form sed to rations greater soil N as a fraction of total lant N from plants harvested in July and
Collectively, these findings suggest that ther fate of shortgrass steppe soil N in future CO2
modeling exercise of Parton et al. ( o r o elevated CO2, and
ijkstra et al. (in
f PNL ha as t of ive vege-
ntributed to a decline in forage quality under elevated CO2 (Milchunas et
ies changes which occurred in our open-top-chamber experiment under ata form
sed to rations greater soil N as a fraction of total lant N from plants harvested in July and
Collectively, these findings suggest that ther fate of shortgrass steppe soil N in future CO2
modeling exercise of Parton et al. ( o r o elevated CO2, and
ijkstra et al. (in
f PNL hanced as t of ive vege-
ntributed to a decline in forage quality under elevated CO2 (Milchunas et
ies changes which occurred in our open-top-chamber experiment under p
p
October, significantly declined over time (Figure 18). The decline in the 15N fraction
was larger under elevated CO2 (significant
CO2*year interaction, P < 0.05). The
dilution of 15N in aboveground biomass
occurred over time because of progressive plant uptake of non-labeled N from the soil, which Dijkstra et al. (in review) argue
comes from N mineralization resulting from greater root activity and higher soil water content.
e is still considerable uncertainty about the -enriched and warmer climates. The October, significantly declined over time (Figure 18). The decline in the 15N fraction
was larger under elevated CO2 (significant
CO2*year interaction, P < 0.05). The
dilution of 15N in aboveground biomass
occurred over time because of progressive plant uptake of non-labeled N from the soil, which Dijkstra et al. (in review) argue
comes from N mineralization resulting from greater root activity and higher soil water content.
e is still considerable uncertainty about the -enriched and warmer climates. The 2007) showed nly minor eductions of soil rganic N under 2007) showed nly minor eductions of soil rganic N under D D review) observed increasing N mineralization under elevated CO2, contrary to the notion o (Luo et al., 2004). However, CO2-en N mineralization w insufficient to mee higher N demand more product tation, which co al., 2005). Spec review) observed increasing N mineralization under elevated CO2, contrary to the notion o (Luo et al., 2004). However, CO2-en N mineralization w insufficient to mee higher N demand more product tation, which co al., 2005). Spec nced
Figure 17. DAYCENT simulated soil organic C (a) and soil organic N (b) in top 20 cm of soil profile for PHACE experimental site, with
treatments (control; CO2 enrichment,
warming, CO2 + warming) starting in 2004.
Figure 18. (a) Aboveground 15N fractions (expressed per total amount
of N) in aboveground biomass over time in July, (b) in October from grids that were not harvested that same year in July, and (c) in October from grids that were harvested that same year in July. Open
circles, ambient [CO2]; filled triangles, elevated [CO2]. For each year
CO2 treatment effects were tested with ANOVA (ns: not significant, *:
CO2 enrichment (Morgan et al., in press) are likely affected by soil nutrient dynamics,
hange over time depending on how global changes affect the HACE experiment, which features an intensive soils research e additional data and insights concerning the interactive effects of
ment and warming on N cycling in semi-arid grasslands. and those dynamics may c
soil biology. Our new P program, will provid combined CO2 enrich
3) Impact of grazing on surface energy budgets: How the available energy (net radiation + soil heat flux) is partitioning between sensible and latent heat fluxes can affect the near-surface atmosphere through their impact on water vapor content and temperatur Eventually, this could influence cloud formation and precipitation processes. Variations in the characteristics of the underlying surface, like albedo, vegetation cover, leaf area index, soil wetness that occur at different time scales (i.e., 2-3 days after rainfall events, during the growing season, in dry and wet years) may also affect the energy bal
Table 1. Mean values of the components of energy balance and Bowen ration (H/Le) for each of the grazing treatments.
e.
ance and artition among fluxes. Grazing management practices can affect for instance biomass
ms
during two growing seasons, May to October 2001 nd 2002. Aboveground plant biomass was sampled monthly and separated into live (gr av ent. here were nnual e 320 p
amount and albedo and consequently impact energy fluxes and near-surface climate. All these processes need to be accurately parameterized in numerical models of weather and climate to be able to use them to have a correct assessment of how different processes at the field level within SGS LTER site may affect the near-surface regional atmosphere. The goals of this analysis are to evaluate the impact of different levels of grazing and green biomass on near-surface climate and energy fluxes in the SGS region. This particular task is associated with one of the major hypotheses that drive the work in the Land Atmosphere Interactions:
L2d Disturbances of domestic livestock grazing and winter wheat cropping syste at the field level affect the regional atmosphere and influence local weather patterns, through their influence on energy partitioning and balance.
We used 20-min averaged measurements of sensible, latent and soil heat fluxes using Bowen ratio flux towers located over three different grazing treatments (i.e., ungrazed, moderately and heavily grazed) plots
a
een) and standing dead (brown) biomass. Additional observations included 20-min eraged air temperature at two vertical levels, soil temperature, and water cont
T clear interannual and seasonal variability in the energy fluxes. Mean a precipitation averag mm on the western side of the LTER
site, but characterized by a high interannual variation (Lauenroth and Burke, 1995; Lauenroth and Sala 1992). Annual precipitation during 2001 was 61% higher than in 2002, 262 mm and 163 mm respectively. The overall behavior of energy fluxes clearly reflected those differences: higher sensible heat (0.6Rn) than latent heat flux (0.2Rn)
during 2002 and an increase in latent heat fluxes during the relatively wet year 2001 (0.4Rn) (Table 1).
e found lower sensible and higher latent heat fluxes until the middle of the growing re
Figure 1 . Seaso d 2002, for each of
Overall, grazing treatments showed little impact on seasonal energy fluxes (Table 1 and l
ainfall events have an impact over water losses at the shortgrass steppe (Parton et al. 1981): water loss is equal to potential evapotranspiration rate immediately after
W
season consistent with high precipitation and available energy (see as an example Figu 19 for latent heat fluxes). At the end of growing season the pattern reversed, associated with a decrease in available energy and precipitation.
9 nal variation in latent heat fluxes and precipitation (Pr) for 2001 an
the grazing treatments, Moderate, Heavy and Ungrazed.
Figure 19) and evapotranspiration rates. Heavy grazing tended to have the lowest live and total (green + standing brown) biomass as expected, but the impact of grazing leve on green biomass was relatively small (results not shown). This could have influenced the overall response of energy and water (evapotranspiration) fluxes to grazing. R
precipitation events, and then decreases rapidly after three to days. We selected two to three day after each rain event and
the possible impact of gr
biomass on energy fluxes and air and soil temperature. Significant effects of green biomass wer found on fluxes and soil temperature: high
evapotranspiration rates are expected to be found with high green biomass values during wet periods (Figure 20). No clear impacts of grazing treatments wer found in the energy fluxes vs. biomass relationship, but result suggest a significant potential impact of grazing on energy
budgets if grazing treatments had a significant effect on live biomass. During the wet periods after a rainfall event high green biom
were related to cooler soil Figure 20. Latent (a) and sensible (b) heat flux versus green biomass during the wet periods in 2001 and 2002, for each of the grazing treatments: HG: heavy grazing; MG: moderate grazing; UG: ungrazed.
Figure 21. Mean soil and air temperatures versus green biomass during the wet periods in 2001 and 2002.
four s analyzed een e e green s ass emperatures (Figure 21). No effect
-a e
tion a ces.
a clear on the surface energy fluxes and temperature
is ugh t
was found for air temperatures at 2 m and 1m. This indicates that high green biomass tends to reduce the soil available energy is used in evapora and air-soil-air temperature differen
In summary, we did not find effect of grazing
ir temperature differences after a rain event: th nd transpiration, reducing soil temperatures
when all the growing season information was considered. Th could be significant in the days following a rainfall event, thro the impact of green biomass on latent and sensible heat flux
partitioning: our analysis showed a significant potential impact of grazing on energy budgets if the live biomass is very different in each of the grazing treatments.
Further analysis is needed to clarify some of the results. We recommend the following: albedo impact on net radiation. Remote sensing technology could also be used to •
aracteristics on latent heat fluxes. tion •
effects on energy fluxes in the SGS
4) Modeling of photosynthesis and energy fluxes
• Albedo measurements collected at each grazing treatment plot would help assess assess reflective differences of the surface.
Estimation of evaporation and transpiration separately would allow addressing differential effects of soil and vegetation ch
• Remote sensing technology could be used to obtained high resolution vegetation greenness maps through vegetation indices like Normalized Difference Vegeta Index (NDVI). The indices could help in addressing spatial differences in surface energy budgets within the SGS LTER domain.
Species composition, vegetation cover, and soil characteristics could be more thoroughly studied to clarify grazing treatment
LTER domain.
: We also continued the refinement of
e GEMRAMS and GEMLEAF modeling systems being used together with observations ons
the SGS LTER, Pascopyrum smithii (PASM) (C3) and for Bouteloua gracilis (C4)
of in in
SM observed and simulated hotosynthesis. Data showed the typical asymptotical response to increases in
t values e best
ature (Figure 22). or temperatures around 25°C, simulated photosynthesis was underestimated for high Ci values. For higher temperatures (30.7°C), the agreement was slightly better with the
th
of water, energy, and CO2 fluxes to investigate land-atmosphere interactions at the
Shortgrass Steppe LTER. The photosynthesis parameterization in GEMLEAF was evaluated using leaf gas exchange measurements conducted over three growing seas (1997 to 1999) collected using large open-top chambers that received ambient air (approx 360 mol mol-1 CO2). For a detailed description of the chambers and the
complete set of experiments see Morgan et al. (2001) and LeCain et al. (2003).
Previous evaluation of the photosynthesis submodel for the dominant C3 and C4 species
in
(Chen et al. 1996) were performed with leaf gas exchange experiments data obtained from plants in growth chambers. Although this data represents controlled conditions light, temperature, soil water conditions, and CO2, rarely are those conditions present
the field, especially in terms of water stress. The parameters Vc,max (maximum rate of
carboxylation by Rubisco), Jmax (saturated rate of electron transport and quantum
efficiency (α) required for the estimation of leaf photosynthesis were taken from LeCa et al (2003). We used data provided by D. LeCain and J. Morgan to evaluate the response of photosynthesis to intercellular CO2.
Preliminary results are shown in Figure 22 for PA p
intercellular CO2 (Ci). LeCain et al (2003) in their Table 1 present three differen
of Vc,max, Jmax and α for each part of the early, mid, and late growing seasons. Th
values that fit the observations were the average value of Vc,max= 57 µmol CO2 m-2 s-1;
photosynthesis was controlled by Vc,max for all ranges of Ci values.
For a better visualization, the data was divided according to temper F
Figure 22. Top: Leaf photosynthesis versus
intercellular CO2 concentration for PASM measured
during the 1997 to 1999 growing seasons. Data was grouped according to mean temperature Modeled data is shown with lines, and with open triangles for temperatures higher than 30°C Bottom: Modeled
the response of photosynt intercellular CO2. We expect a
that the C4 photosynthesis
submodel will satisfactorily reproduce the observed photosynthesis data for Bouteloua gracilis and will adequately reproduce the effect of doubled CO2 concentration
photosynthesis for both C3 and C4. The next step is to evaluate the C4
vs. observed photosynthesis. the typical ped, s. experiments in the GS LTER accurately simulated
hesis to lso
on
hotosynthesis submodel and
sis ra
ues and/ o
GEMLEAF and t ed to
crop rasslands dominance
urface atmosphere. CO2 fluxes collected using
observed data for high Ci. During the mid-season (days of the year around 188 and 190)
seasonal water stress develo with leaf water potential of approximately -3 MPa. Water stress effect on assimilation rates is incorporated using zero-to-one factor functions parameterized using plant water potential. Using plant water potential values of -2 MPa and -3 MPa greatly improved the response of assimilation rates to water stres In summary, the current
photosynthesis submodel in GEMLEAF for PASM using the information from leaf gas exchange field
S
p
doubled CO2 effects in photosynthe
second step, all the updated val the land-surface model
model experiments will be conduct (i.e., increasing the area covered by and CO2 enrichment over the near-s
Bowen ratio flux towers for a mixed C3/C4 shortgrass site, winter wheat and corn will also be used to assess if GEMLEAF is able to capture the differences among those systems.
tes and soil and plant water relations. In a or parameterizations will be incorporated int he 3-D spatial model GEMRAMS. Several address the effects of landscape heterogeneity ping systems), C3/C4 g
4. Integrated, Synthetic and Cross Site Research
g in semi-arid Ecosystems
1) Phosphorus Transformations as a function of weatherin :
cosystem P is mainly supplied through weathering of parent material. As soils
r semi-a
400-ensity C
has
ortgrass steppe to tall grass prairie ed
ss NPP E
weather, P can be partitioned into secondary mineral precipitates, incorporated into biomass, or lost via leaching and erosion. As little is known about P cycling unde arid conditions, studying P biogeochemistry within may provide insight into the
importance of abiotic and biotic P controls within such ecosystems. We further assessed P fractionation patterns and processes in three grassland communities spanning
mm precipitation gradient across the central Great Plains. Total element to Ti ratios indicated basic cations weathered rapidly, P moderately, and Fe and Al slowly from the shortgrass steppe to the tall grass prairie. Soil surface horizon P accumulation was likely related to plant uptake and decomposition, though eolian input cannot be discounted. Patterns across the climosequence follow previous observations of decreasing Ca-bound P and increasing occluded P with increasing weathering int (Figure 23). Upper soil horizons showed evidence of Ca-bound P, yet inorganic
content was low. Ca-bound P trends within these horizons do not appear to follow that of organic C, supporting the contention that secondary Ca-P mineral precipitation broad implications for the retention of P across semi-arid ecosystems. Subsurface Ca-bound P compared well with inorganic C content, demonstrating the importance of carbonate P controls in semi-arid ecosystems.
Across all US Great Plains grassland sites elemental weathering losses were variable when compared to soil Ti concentration. The sh
weathering scheme of Ca > Mg > P > Fe >= Al was similar to that found by others. In addition to intermediate P weathering, some redistribution to the soil surface occurr at all sites suggesting biological cycling or eolian input. Soluble P played a minor role within all soil profiles most likely due to this phase being quickly utilized by plants, microorganisms, or precipitated as secondary mineral phases. The greatest percentage of inorganic P was bound to Ca phases in the shortgrass steppe (Arik) and mixed gra prairie (SV and Hays) sites. As observed in other weathering sequences, the total amount of P associated with Ca phases decreased with a concomitant increase in occluded P, following increased weathering intensity along the precipitation and A gradient.
A. P Fractionation - Surface Horizon B. P Fractionation - Upper Subsurface Horizon
Arikaree BAt SV ABt Hays ABt Konza ABt
Fr acti o n of Tot al P (% ) 0 20 40 60 80 100
Arikaree A SV A Hays A Konza A
Fr act io n of T o ta l P ( % ) 0 20 40 60 80 100
C. P Fractionation - Lower Subsurface Horizon
Arikaree Bt SV Bt Hays Bt Konza Bt1
Frac tion of Tot al P (% ) 0 20 40 60 80 100 Soluble P Al-Bound P Fe-Bound P Occluded P Ca-Bound P
Figure 23. Phosphorus fractions of A) A horizon, B) upper subsurface, and C) lower subsurface horizons across sites.
2) Primary controls on soil BSi pools in grass dominated ecosystems: The overall goal of the research is to address three questions. (1) How variable are biogenic silica soil pools in grass-dominated ecosystems, (2) Do climatic controls of BSi identified in North American grasslands operate similarly in South African grasslands, despite differences in parent material, soil age (degree of development), and evolutionary history? And (3) How do key ecological drivers (fire and grazing) of grassland structure and function influence the size of these biogenic pools. We were testing the hypothesis that precipitation amount will have a strong, inverse impact on the storage of above and belowground Biogenic Silica in subtropical savanna grasslands and this pattern will be similar to that observed in North America (Fig. 24).
America (KZ, SEV, SGS) and in South Africa to begin to assess differences in BSi content
er et a, We have now preliminarily sampled experimental plots in three LTER sites in North in plants and soils as a function of ANPP (Melzer and Kelly, unpublished data) and the results are intriguing.
With increasing ANPP, biogenic silica stored in aboveground vegetation increases (Fig 24). However, biogenic silica storage in the soils was inversely related to aboveground production suggesting that greater losses of this biogenic material occurred in higher ANPP grasslands - this is consistent with other North American studies (Bleck 2006). Further assessment of lower ANPP sites (lower MAP) on different parent materials will allow us to more rigorously test this hypothesis.
0 100 200 300 400 Pl a n t B S i (k g /h a ) 125 185 406 502 ANPP (g/m2)
North America South Africa
Figure 24. Preliminary data of BSi content of Plants and Soils (A horizons) as a function of ANPP for North America and South Africa study sites.
0 125 185 406 502 ANPP (g/m2) 500 1000 1500 S o il B S i ( x 1 0 3)(k g /h a )
North America South Africa
Frequent fire will increase BSi amounts in vegetation, but have a negative impact on Si storage in the soils of savanna grasslands. We base this prediction on our central Great Plains studies that suggest that in tallgrass prairie where fire is most important, BSi in above ground materials was greatest. This could be due to a fire-induced increase in transpiration and ANPP, a shift to greater graminoid dominance or due to an increase in water stress in the post-fire environment (Knapp et al. 1998, Collins et al. 1998).
urther, soil mass balance calculations indicate that leaching of Si could not account for
s that, in F
the low quantities of BSi found in soils (Blecker, 2005), suggesting that frequent fire could be an important vector of silica loss through wind and water erosion of ash. In sites with complete fire exclusion, soil BSi will be increased since no post-fire loss occurs.
Preliminary sampling from Konza and Kruger National Park (Fig. 25) indicate
general, the uptake of Si by plants increases with frequent fire, but this response is not evident in the soil, perhaps due to BSi loss in ash. It’s also interesting to note the higher content of BSi in plants and soils found in the South Africa site relative to North
0 AB UB AB UB Burn Treatment 100 200 300 400 P la n t B S i (k g /h a ) South Africa North America 0 20 AB UB AB UB Burn Treatment So il B 40 60 80 100 S i ( x 1 0 3)( k g /h a)
North America South Africa
Figure 25. Preliminary data of BSi content of plants and soils (A horizons) as a function of fire frequency for North America and South Africa study sites. AB = annually burned, UB = unburned.
B. Information Management
The SGS-LTER Information Management System archives extensive amounts of data, metadata, and other information. This year we have made significant revisions to relational database management system to more efficiently organize, relate and deliver our
formation, data and metadata. Our new schema also contains metadata content to s each attribute within each dataset and the
ons. We are beginning to implement EML vel 5 with long term studies consisting of 30 datasets, (15% of our entire database)
nt system, and increased ease of use for our end users with the latest web
TER ll
s Unfortunately, integrating NPP data over time and over regions is not a
g tes to
programs for analysis of SGS-LTER data. in
generate level 5 EML, which define
associated measurement units or code definiti le
which support both legacy and current studies. Perl scripts have been developed to generate EML from our database and store it on our web server for harvest by the LTER Network metacat catalog. This level of metadata and our participation in the
communitywide metacat will facilitate data discovery, data integration and synthetic research.
We have contracted with a web development team at our home institution, Colorado State University, to implement our newly designed website that queries, joins, and publishes information from the revised database. The benefits of using the database to drive the website content include delivery of information that is more dynamic,
connections between different types of information within the relational database manageme
features. An example of related information that can be delivered within just a few clicks of the mouse includes a publication citation with the supporting data and the authors’ e-mails. The SGS-LTER website is large in scope, presenting an impressive amount of information that requires unique tools compared to other projects on the CSU campus. The tools we will build can be maintained and expanded by SGS-L Staff and may be passed along to other LTER sites. Implementation is planned for Fa of 2007.
We also provided data, metadata and expertise to integrate datasets with other LTER sites working directly with researchers from the SGS, SEV, and JRN, as well as the leaders of the TRENDS project. The Grasslands Data Integration Project (GDI) bring together ecologists, computer scientists, and information managers to address the challenges of integrating diverse datasets and produce analyses from the integration product.
straightforward problem. Issues of ecological synthesis and data integration arise from questions of methodology (e.g., sampling, plot sizes, etc.), data semantics (e.g., changin taxonomic information), and straightforward but messy data transformations. These datasets represent a core area of research within the LTER community, and an
integrated databank would create a powerful resource for ecologists from several si perform cross-site analyses.
Our IM staff continues to provide support for SGS-LTER researchers and students in various aspects of GIS including gathering data with GPS equipment and imagery, assisting with GIS model development for their particular research, and providing GIS data and maps for field work and modeling. We have also extended existing GIS